Moss Tom. DNA-protein interactions: principles and protocols
Подождите немного. Документ загружается.


Competition Assay Using ANS 265
265
From:
Methods in Molecular Biology, vol. 148: DNA–Protein Interactions: Principles and Protocols, 2nd ed.
Edited by: T. Moss © Humana Press Inc., Totowa, NJ
18
A Competition Assay for DNA Binding Using
the Fluorescent Probe ANS
Ian A. Taylor and G. Geoff Kneale
1. Introduction
Fluorescence spectroscopy is a useful technique for investigating the inter-
action of DNA-binding proteins with DNA. Generally, use is made of the
intrinsic fluorescence of the protein arising from the aromatic amino acids,
which is frequently perturbed in a DNA–protein complex (see Chapter 33). In
some cases, however, changes in the intrinsic fluorescence emission of a pro-
tein arising from its interaction with nucleic acid may not be detectable. For
example, if tryptophan and/or tyrosine residues are not located in the proxim-
ity of the DNA-binding site, the emission spectrum may not be perturbed by
the interaction. Furthermore, in the presence of a large number of tryptophan
and tyrosine residues, a relatively small perturbation in the overall emission
spectrum brought about by DNA binding may be masked.
To overcome these problems, an alternative approach is to add an extrinsic
fluorescence probe to the system that competes with DNA for the binding site
of the protein. One can then measure the change in the fluorescence emission
spectrum of the probe as DNA is added. If the fluorescence characteristics
of the free and bound probe differ, displacement of the probe by DNA can then
be observed.
The fluorescent probe 1-anilinonaphthalene-8-sulfonic acid (ANS) and its
derivatives have long been used to study protein structure (1) and, more
recently, to study protein–nucleic acid interactions (2–4). ANS has the prop-
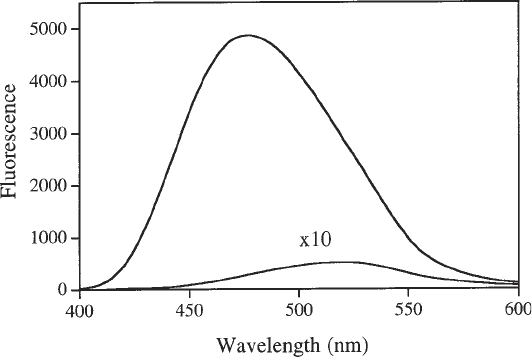
erty that its fluorescence emission spectrum undergoes a 50-nm blue shift along
with an approx 100-fold enhancement when transferred from an aqueous envi-
ronment to a less polar solvent, such as methanol (see Fig. 1). ANS will bind
weakly to hydrophobic patches on protein molecules with an average dissocia-
266 Taylor and Kneale
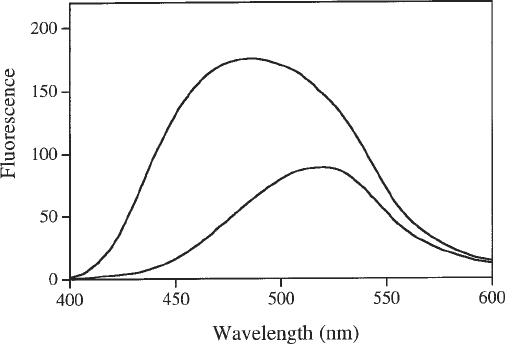
tion constant of 100 µM (3). When molecules of ANS are bound to protein,
enhancement and shifting of the fluorescence spectrum similar to that observed
in apolar media often occurs (see Fig. 2). Thus, bound molecules of ANS fluo-
resce much more a strongly and at shorter wavelength than ANS molecules in
an aqueous solvent.
The precise reason why ANS molecules bind at DNA-binding sites is not
entirely clear, as such sites are not particularly hydrophobic. Nevertheless, ANS
is a planar aromatic molecule that will have some properties in common with
the DNA bases despite the lack of hydrogen-bonding capacity. Furthermore,
the negatively charged sulfonate group of ANS may mimic the phosphate group
of the DNA backbone.
The protocol described has been successfully applied to an investigation of
the DNA-binding properties of a type I modification enzyme (M.EcoR124I
[4]). It was possible to demonstrate differential binding affinity for an oligo-
nucleotide containing the canonical recognition sequence and one that differs
by just one base pair in a nonspecific spacer sequence in the enzymes recogni-
tion site. It remains to be seen how general the method is because there have
been very few instances of its application to DNA-binding proteins. Since it
can be established fairly rapidly whether ANS binds to a given protein, and
whether there is some release of ANS by the addition of DNA, it is a technique
worth investigating. Subheadings 3.1. and 3.2. deal with preliminary experi-
ments. If these are encouraging, then accurate fluorescence titrations can be
Fig. 1. The effect of solvent polarity on the fluorescence emission spectrum of
ANS. Fluorescence emission spectra (λ
ex
= 370 nm) of 50 µM ANS in 100% methanol
(upper curve) and in aqueous buffer (lower curve) are shown.
Competition Assay Using ANS 267
undertaken to investigate the DNA binding characteristics of the protein in
more detail (Subheading 3.3.).
2. Materials
1. A fluorimeter is required that is capable of scanning with both emission and exci-
tation monochromators and in which the emission and excitation slit widths can
be varied. In our laboratory, we routinely use a Perkin-Elmer LS50B. The fluo-
rimeter is controlled by a PC using software written by the manufacturer.
2. It is desirable that the cell holder compartment be thermostatically controlled to
±0.1°C, and some models of fluorimeter have a built-in temperature control.
Alternatively, this can be achieved by circulating water through the cell holder.
In this case the temperature is controlled by a programmable circulating water
bath (e.g., Neslab RTE-100).
3. Good quality quartz cuvets (preferably stoppered) with all four faces polished are
required. A 1 × 0.4-cm (semimicro) cuvet is preferred, because this minimizes
the inner filter effect compared to the standard 1 × 1-cm (3-mL) cuvets (see Sub-
heading 3.1.). The excitation beam should pass through the 0.4-cm path because
absorption of the emission beam should be negligible.
4. All buffers should be prepared from the highest-quality reagents and ultrapure
water. The buffers should be degassed and filtered to remove any particulate
contaminants. In the example provided the assay was carried out in 10 mM
Tris-HCl, pH 8.2, 100 mM NaCl, and 5 mM MgCl
2
(see Note 1).
5. High-purity ANS free of contaminating bis-ANS may be obtained from Molecular
Probes (Eugene, OR). A 1 mM solution of ANS should be made fresh just prior to use.
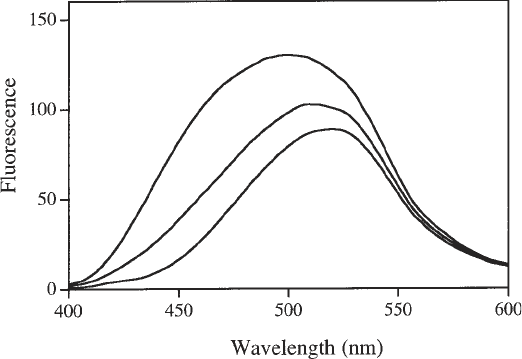
Fig. 2. Enhancement and spectral shift of ANS fluorescence by the addition of pro-
tein. Fluorescence emission spectrum (λ
ex
= 370 nm) of 100 µM ANS alone (lower
curve) and with the addition of 2.2 µM M.EcoR124I (upper curve).
268 Taylor and Kneale
6. A 50-µM stock solution of the purified DNA-binding protein of interest.
7. A 100-µM stock of an oligonucleotide duplex containing the DNA-binding site
to be investigated (see Note 2).
3. Methods
3.1. Titration of Protein with ANS
To find optimal conditions for the use of ANS in a DNA-binding experi-
ment, it is advisable to first titrate the protein of interest with ANS to check the
extent to which the protein binds the fluorescent probe. The precise con-
centrations of the reagents and composition of the buffer used here work
well for M.EcoR124I and its subsequent binding to a 30-bp DNA duplex con-
taining a single recognition site. It may be necessary to vary the conditions for
other systems.
1. Prepare 250 mL of a degassed and filtered standard buffer that will be used
throughout the set of experiments (e.g., 10 mM Tris-HCl, pH 8.2, 100 mM NaCl,
and 5 mM MgCl
2
). Dialyze or desalt (see Note 3) the DNA-binding protein into
this same standard buffer and prepare approx 2 mL of a 1 µM solution.
2. Prepare 50 mL of a 1 mM ANS solution again in the same buffer. The concentra-
tion of ANS can be determined from its UV absorption spectrum (ε
370 aqueous
=
5500/M/cm; see Note 4).
3. Adjust the excitation and emission slits on the fluorimeter to 2.5 nm (wider
slits can be used if the signal is weak) and set the desired temperature. Allow
time for the machine to “warm up” and also for the cell holder to tempera-
ture equilibrate.
4. Place 1 mL of buffer in the fluorimeter cuvet and record the fluorescence emis-
sion spectrum between 400 and 600 nm, using an excitation wavelength (λ
ex
) of
370 nm. Add 2 µL aliquots of the 1 mM ANS solution to the cuvet and mix
gently. After each addition record the fluorescence emission spectrum as before.
At the end of the titration measure, the OD
370
of the sample using the same opti-
cal path length as used in the fluorescence titration.
5. In a clean cuvet, place 1 mL of the solution of 1 µM DNA-binding protein and
record the fluorescence emission spectrum between 400 and 600 nm (λ
ex
= 370 nm).
Repeat the ANS titration as in step 4 and again record the OD
370
of the sample at
the end of the titration.
6. To analyze the titration data, choose the wavelength in the emission spectrum
that shows the largest difference between the two titrations. This will probably be
in the vicinity of 480 nm, although shorter wavelengths can be used to minimize
the background signal from free ANS (see Fig. 2).
7. To obtain the corrected fluorescence intensity (F
corr
), first correct for any dilu-
tion (if significant, see Note 5), then correct the observed fluorescence intensity
(F
obs
) by application of Eq. 1. which accounts for any nonlinearity resulting from
inner filter effects (see Note 6).
Competition Assay Using ANS 269
F
corr
= F
obs
× 10
(Aex/2)
(1)
Apply Eq. 1 to the data from each point in the titration. A
ex
is the absorbance of
the sample at the excitation wavelength (370 nm). This absorbance can be calcu-
lated from the ANS extinction coefficient and the known ANS concentration,
taking into account the appropriate path length, but it should be checked against
the OD
370
value measured at the end of each titration.
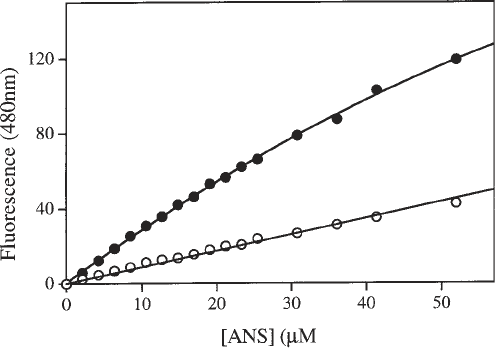
8. Plot the corrected fluorescence at the chosen wavelength against the ANS con-
centration for each titration. A typical case is shown in Fig. 3. The titration curve
in the absence of protein should be linear if the corrections for inner filter and
dilution have been correctly applied.
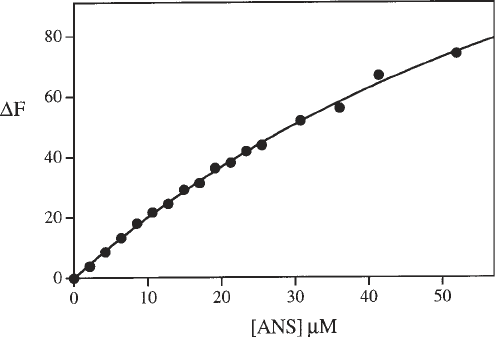
9. Subtraction of the curve of ANS added to buffer from the curve of ANS added to
the protein solution yields the binding curve of ANS to the protein, as illustrated
in Fig. 4. The shape of the curve will depend on the ANS binding properties of
the particular protein under study (see Note 7). In the case shown in Fig. 4, this
curve is fairly representative of the situation in which several ANS molecules are
associated weakly.
3.2. Preliminary investigation
of the Displacement of ANS by DNA
Once satisfied that the protein under investigation binds ANS, one must
ascertain if any of the bound ANS molecules are located in the DNA-binding
site of the protein. If so, their fluorescence will change upon being displaced
by DNA.
Fig. 3. Fluorescence titration of M.EcoR124I (1.5 µM) with ANS (upper curve).
The lower curve shows the fluorescence increment in the absence of protein. Both
titrations have been corrected for dilution and the inner filter effect.
270 Taylor and Kneale
1. Make up a solution of 100 µM ANS in buffer (see Note 8). Measure its fluores-
cence emission spectrum between 400 and 600 nm (using λ
ex
= 370 nm).
2. Prepare an identical solution of ANS containing 1 µM DNA. Measure the emis-
sion spectrum as in step 1. These two spectra should be effectively identical.
There should be no observable interaction between the nucleic acid and the ANS.
3. Make up a 100 µM ANS solution containing 1 µM protein, and an identical solu-
tion containing 1 µM DNA in addition. Measure the fluorescence emission spec-
tra of these two samples as in step 1.
The presence of protein in the ANS solution should cause a change in the
shape and intensity of the emission spectrum. An increase in quantum yield
accompanied by a blue-shifted spectrum should be observed, When the nucleic
acid is present and bound to the protein, any ANS (which is weakly bound) in
the DNA-binding site of the protein will be displaced and change the form of
the spectrum toward that of free ANS (see Fig. 5).
3.3 Fluorescence Competition Assay
Once it has been established that the DNA fragment of interest shows a
measurable displacement of ANS, further investigation of the DNA-binding
characteristics of the protein can be conducted. Titrations can be done in a
number of different ways, but we have found it more reproducible to titrate the
protein into a solution of ANS in the presence and absence of DNA. The differ-
ence in fluorescence at each point then represents the amount of ANS dis-
placed (i.e., the amount of DNA bound). The concentrations used should be
those found to be optimal from the earlier experiments. Because the concentra-
Fig. 4. The binding curve for ANS to M.EcoR124I, generated by subtraction of the
lower curve from the upper curve in Fig. 3.
Competition Assay Using ANS 271
tion of ANS is constant throughout, the absorbance at 370 nm should remain
unchanged and no inner filter correction need be applied.
1. Place 1 mL of a 100 µM ANS solution in the cuvet and record the emission spec-
trum between 400 and 600 nm (λ
ex
= 370 nm).
2. Add small (2–10 µL) aliquots of the 50 µM stock protein solution to the cell up to
a final concentration of 3 µM. After each addition record the fluorescence emis-
sion spectrum.
3. Make up 1 mL of 100 µM ANS, this time containing 1 µM DNA, and record the
fluorescence emission spectrum as in step 1.
4. Titrate the same small aliquots of the stock 50 µM protein solution into the ANS/
DNA mixture and record the emission spectrum after each addition.
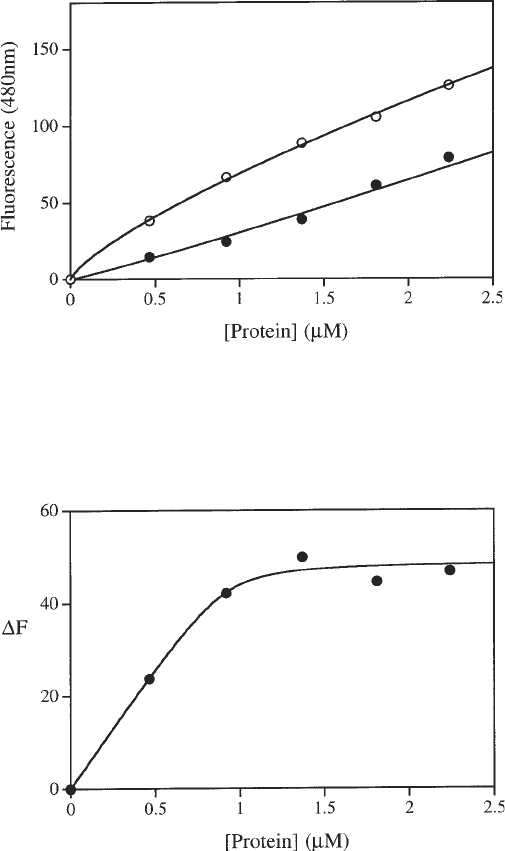
5. Select an appropriate wavelength (e.g., 480 nm; see step 6 of Subheading 3.1.)
and plot the fluorescence intensity at each point in the titration against the protein
concentration for both experiments (see Fig. 6).
6. To obtain a binding curve for the protein–nucleic acid interaction, subtract the
fluorescence intensities at each point in the two experiments (with and without
DNA) and replot against protein concentration (see Fig. 7). This difference rep-
resents the amount of bound DNA, because DNA is solely responsible for the
decrease in fluorescence through displacement of ANS from the binding site. For
a high-affinity DNA protein interaction (with K
d
substantially less than the con-
centration of DNA used in the titration), competition from the ANS will be neg-
ligible and a stoichiometric binding curve will be produced; the sharp break in
the curve at the stoichiometric point indicates the point at which all the DNA is
Fig. 5. Fluorescence emission spectra (λ
ex
= 370 nm) of 100 µM ANS in buffer
(lower), in a solution of 1 µM M.EcoR124 (upper), and in a solution of 1 µM
M.EcoR124I and 1 µM DNA (middle).
272 Taylor and Kneale
Fig. 6. Data from an ANS competition assay. The upper set of points represent the
fluorescence increase resulting from successive additions of M.EcoR124I to a 100 µM
solution of ANS. The lower set of points represent the fluorescence increase when the
same titration is carried out in the presence of 1 µM DNA.
Fig. 7. Binding curve for the interaction of M.EcoR124I with an oligonucleotide
containing its recognition sequence. This curve is generated by the subtraction of the
lower curve from the upper curve in Fig. 6.
bound. Curvature of the plot around the stoichiometric point represents a lower-
affinity interaction. For a more detailed discussion of DNA binding curves, see
Chapter 33.
Competition Assay Using ANS 273
4. Notes
1. The exact composition of the binding buffer will be dependent on the DNA-
binding protein being studied. Also, it is advisable to avoid the presence of
strongly absorbing compounds and/or quenchers that may interfere with fluores-
cence measurements. If the interaction has been characterized by another method
(e.g., by gel retardation assay), the fluorescence experiment should initially be
carried out in the binding buffer used in these studies.
2. In our laboratory, titrations are carried out using short synthetic DNA duplexes
(30-mers) that contain the protein’s recognition sequence. Short oligonucleotides
have the advantage that relatively large amounts of highly pure material are
readily obtainable. However, the same protocol should be applicable to the use of
longer nucleic acids, such as restriction fragments or polynucleotides.
3. It is important that all the components in the titration are “optically matched.”
Preparation of a matched protein sample is best achieved by either dialysis or
buffer exchange. If the protein sample is limiting, small amounts can be prepared
by buffer exchange using NAP5 columns (Pharmacia) or, alternatively, by dialy-
sis using Slide-A-lyzers (Pierce).
4. The value of ε
370 aqueous
for ANS in buffer was derived by comparison of the
OD
370
of two equimolar solutions of ANS, one in a buffer and the other in 100%
methanol for which ε
370
is known (6800/M/cm; Molecular Probes). If the buffer
used differs significantly from the one used here, then it is advisable to recalcu-
late the ε
370
.
5. If the stock solution of ANS is available at high concentration, then the volume
of sample in the cuvet during the titration can be assumed to be constant. If a
more dilute stock solution is used, there will be significant change in volume
(>5%). It is necessary to account for this when calculating the ANS concentra-
tion at each point in the titration.
6. See Chapter 33 for a more detailed discussion of the inner filter effect. As a
guide, for excitation at 370 nm in an aqueous buffer, 52 µM ANS has an OD
370
of
0.11 in a 0.4-cm path-length cuvet. This gives rise to an inner filter correction of
1.14 using Eq. 1.
7. The binding curve generated for ANS can, in principle, take many forms. The
shape will depend on the number and relative affinity of ANS binding sites on the
protein. If the protein contains high-affinity sites, the curve may be biphasic and
may allow the stoichiometry of the strong interaction to be determined. A more
likely situation is that there will be numerous ANS binding sites with differing
but weak affinities (K
d
> 100 µM). The result of this is a curved plot similar to
Fig. 3.
8. The concentration of the ANS solution used in the titration must be determined
empirically from the previous experiments. It should be high enough to ensure
that a good fraction of the ANS binding sites on the protein are occupied (as
determined in Subheading 3.1.),
9. As well as direct excitation of the fluorescent probe (i.e., with an excitation wave-
length of 370 nm for ANS), it may be possible to investigate energy transfer
274 Taylor and Kneale
effects between aromatic amino acid residues in the protein and the bound probe.
If the excitation is performed at 280 nm to excite both tyrosine and tryptophan,
energy transfer to ANS will be apparent from the emission spectrum between
400 and 600 nm. In principle this effect could also be useful to for following
displacement of ANS in a titration with DNA.
10. A further extension of the fluorescent probe approach is to employ the covalent
probe 5-((((2-iodoacetyl) amino) ethyl) amino) naphthalene-1-sulfonic acid
(1,5-IAEDANS) (5). This reagent reacts with accessible cysteine residues in the
protein and has a higher quantum yield than ANS in aqueous solution. One can
look at the emission spectrum of the bound probe, or it may be possible to observe
energy transfer from aromatic residues in the protein. Any of these fluorescence
characteristics could change when the DNA is bound if the probe is located near
the DNA-binding site. We have used this technique to study the interaction of
M.EcoR124I with DNA and found that energy transfer from the protein to the
bound probe decreased by over 30% when DNA was bound. As long as the pres-
ence of the probe does not inhibit binding, then titrations with DNA can be used
to produce DNA-binding curves. However if the probe does inhibit, this can also
be informative; the labelled cysteine(s) can be identified by peptide mapping by
analogy with the methods reported in Chapter 20.
References
1. Brand, L. and Gohlke, J. R. (1972) Fluorescence probes for structure. Annu. Rev.
Biochem. 41, 843–868.
2. Secnik, J., Wang, Q., Chang, C. M., and Jentoft, J. E. (1990) Interactions at the
nucleic acid binding site of the avian retroviral nucleocapsid protein: studies uti-
lizing the fluorescent probe 4,4'-bis(phenylamino)(1,1'-binaphthalene)-5,5'-
disulfonic acid. Biochemistry 29, 7991–7997.
3. York, S. S., Lawson, R. C., Jr., and Worah, D. M. (1978) Binding of recrystallized
and chromatographically purified 8-anilino-1-naphthalenesulfonate to Escheri-
chia coli lac repressor. Biochemistry 17, 4480–4486.
4. Taylor, I., Patel, J., Firman, K., and Kneale, G. (1992) Purification and biochemi-
cal characterization of the EcoR124 type I modification methylase. Nucleic Acids
Res. 20, 179–186.
5. Kelsey, D. E., Rounds, T. C., and York, S. S. (1979) lac repressor changes confor-
mation upon binding to poly[dA-T)]. Proc. Natl. Acad. Sci. USA 76, 2649–2653.
