Morris & Fan. Reservoir Sedimentation Handbook
Подождите немного. Документ загружается.


CASE STUDY: SEFID-RUD RESERVOIR, IRAN 23.3
23.2.2 Water and Sediment Inflow
Streamflow and suspended sediments are measured at the Gilevan and Loushan
stations just upstream of the reservoir on the Qezel Owzan and Shah Rud Rivers
respectively, and at the Roudbar station on the Sefid-Rud River 3 km downstream of
the dam (see Fig. 23.1 for locations). Measurements are made at least twice weekly
during low-flow periods and several times daily during high floods. Stage-discharge
curves for gaging stations are prepared from velocity measurements and the curves are
updated annually after spring floods. Sediment discharge is measured with a USDH-48
depth-integrating sampler at a single vertical, the location of which is adjusted after each
high flood as required to obtain a sample representative of the entire cross section.
During high floods and desilting, sampling is performed at five to seven points across
the river at hourly intervals between 0700 and 1800. Bed load is not measured, but the
sum of bed load plus the contribution from the ungaged area tributary to the reservoir
is estimated as 15 percent of the measured load.
The 56,200-km
2
watershed tributary to the dam consists of semiarid lands
generally receiving from 250 to 400 mm/yr of precipitation. The average elevation within
the watershed is about 1800 m and is composed primarily of unconsolidated to
consolidated clastics (sand, gravel, clay, and their consolidated equivalents), with limited
exposures of pyroclastics and crystalline silicate rocks. Sediments delivered to the
reservoir come from the following sources: sheet erosion 5 percent, gully erosion 25
percent, badlands 57 percent, and channel erosion 16 percent (Sogreah Consulting
Engineers, 1974). Average annual inflow is 5008 Mm
3
, equivalent to 89 mm of runoff
from the tributary watershed. The original reservoir volume was equivalent to a runoff
depth of 31 mm from the tributary watershed, producing a capacity:inflow ratio of 0.36
at closure. Prior to commencement of desilting operations, the trap efficiency was
about 73 percent, with most sediments released as density currents. Characteristics of the
reservoir and tributary streams are summarized in Table 23.1.
Monthly flow and suspended sediment data reported by Tolouie from 1963 through
1987 show water and sediment discharge to be closely correlated in time (Fig. 23.3). A
double mass diagram of water and sediment inflow (Fig. 23.4) clearly shows the large
discharge of both water and sediment during the extremely wet water year 1968-1969,
and reduced sediment yield in the 2 years following the wet year. This short period of
reduced yield probably reflects temporary exhaustion of the sediment supply because the
TABLE 23.1 Summary Characteristivs of Tributaries to Sefid-Rud Reservoir
Qezel Owzan
River
Shahrud River
Reservoir
total
Watershed area, km
2
49,300 5.070 56,200*
Mean annual flow, Me/yr 3824 1183 5008
Capacity, Mm
3
630 370 1760
Original stream slope 0.0033 0.0061 —
Total river length, km 500 180 —
Reservoir length, km 20.0 10.5 —
Sediment yield, 10
6
t/yr 41.6 8.8 50.4
Specific sediment yield, t/km
2
/yr 832 1469 900
Mean suspended sediment concentration, g/L 10.9 7.5
Suspended sediment, sand, % 33 44
Suspended sediment, silt, % 47 46
Suspended sediment, clay, %
20 10
*Includes 1830 km
2
of ungaged area around the reservoir.
Source: Tolouie (1989).
CASE STUDY: SEFID-RUD RESERVOIR, IRAN 23.4
FIGURE 23.3 Mean monthly inflow of water and suspended sediment into Sefid-Rud Reservoir,
1963-1987 (data from Tolouie, 1989).
FIGURE 23.4 Double mass curve of water and sediment inflow at Sefid-Rud Reservoir.
1968-1969 was an extreme-discharge year, contributing 3 times the average annual runoff an
d
5 times the average annual sediment load (data from Tolouie, 1993).

CASE STUDY: SEFID-RUD RESERVOIR, IRAN 23.5
readily mobilized sediment was delivered to the reservoir during 1968-1969. The high
discharge during that year had a return interval of 200 years on the Qezel Owzan River and
1000 years on the Shahrud River.
During conventional impounding, the grain size of suspended sediment discharged
from the dam was significantly finer than the inflow. However, when flushing operations
began the average grain size of the discharged suspended solids became larger than the
inflow (Fig. 23.5). Tolouie (1996) indicated that this increase in grain size during
flushing could be attributed to several factors:
Extensive piping occurred at Sefid-Rud during the flushing period, which eroded the
sandy sediment layers into the flushing channel while the overlying cohesive sediment
layers slumped in place.
FIGURE 23.5 Grain size distribution of suspended sediments entering and leaving Sefid-Rud
Reservoir and of sediment deposits. The grain size discharged below the dam increase
d
significantly as a result of flushing (Tolouie, 1989).
1.
Consolidated blocks of cohesive sediment were frequently transported as bed load
and were not sampled as part of the suspended load. Bed load transport was not
measured.
2. Because the sill elevation of the bottom outlet is located very close to the original
thalweg elevation of the river, coarse material can be transported very effectively despite
reduced discharge during the flushing season. Sand and gravel deposited in the upper reaches
of the main channel by floods during the impounding period are almost completely removed
during the next flushing operation, whereas fines continued to deposit on the submerged
floodplain.
23.2.3 Sediment Deposits
No borings were made through the deposits prior to desilting. After 6 years of desilting
operations which dewatered and compacted the sediments to an unknown degree, 250
borings were made. The borings revealed that the average composition of the deposits
CASE STUDY: SEFID-RUD RESERVOIR, IRAN 23.6
was 41 percent sand and 59 percent clayey silt. Specific weights averaged 1.20 t/m
3
for
clayey sediments and 1.45 t/m
3
for sandy layers, or about 1.3 t/m
3
overall, reported to
agree well with estimates of 1.25 and 1.34 t/m
3
made by the Trask (1931) and (Lane and
Koelzer, 1953) methods respectively. Nine of the deep borings made through the
sediments between 7 and 20 km above the dam were reported by Tolouie (1989). The
profile for borehole 7. reproduced in Fig. 23.6. shows the alternating layers of sand
andfines encountered in most of the reported borings. The deepest boring reported by
Tolouie penetrated 22 m of layered sediment deposits. Deposits near the dam consisted
entirely of cohesive sediments without lenses of coarser material.
FIGURE 23.6 Vertical profiles through sediment deposits more than 5 km from the dam in
borehole 7 showing the presence of alternating layers of sandy noncohesive and clayey cohesive
sediments. This layering is largely absent closer to the dam because coarse sediments
were not transported that far into the reservoir (after Tolouie, 1989).

CASE STUDY: SEFID-RUD RESERVOIR, IRAN 23.7
23.2.4 Turbid Density Currents
The reservoir geometry, particularly along the steep Shahrud River, in combination with
large-capacity bottom outlets near the original river bed and 15 m below the
power intakes, is conducive to the venting of turbid density currents. Despite the 12
m high cofferdam located 150 m upstream of the main dam, which interfered with
density current movement, and the low priority given to the release of density
currents, 27 percent of the inflowing suspended sediment was released over the
1963-1980 period, primarily as density currents. The effect of bottom sluice
operation on sediment release is illustrated in Table 23.2, showing the release of as
much as 36 percent of the inflowing sediment load during an individual flood
event. The average d
50
and d
90
diameters for sediment vented through the Sefid-Rud
Dam by turbid density currents were 0.007 and 0.080 mm, respectively, which is
coarser than the values reported for turbid density currents in Chinese reservoirs.
On January 1, 1976, a turbidity current was observed to enter the reservoir at a
point 15 km upstream of the dam in the Qezel Owzan River, and was vented on
January 4 through bottom outlets, resulting in an average forward velocity of 0.058
m/s in the turbidity current. During this same period the Qezel Owzan inflow
averaged 412 m
3
/s with an average sediment concentration of 6.35 g/L.
23.3 SEDIMENT CONTROL ALTERNATIVES
23.3.1 Hydraulic Dredging
Dredging was initially considered for sediment removal at Sefid-Rud, and the
recommended scheme entailed the removal of up to 700 Mm
3
of sediment, to be
deposited in terraces constructed of hydraulic fill to maximum heights on the order of
20 to 30 m, without use of a retaining wall. The dredging system would consist of a
floating hydraulic cutterhead dredge, floating and overland pipeline, booster pump
stations, and hydrocyclones for separation of the coarse fraction for terrace construction
by hydraulic fill (Fig. 23.7). The terraces would be located between 40 and 120 m above
the average reservoir elevation, and maximum digging depth would be 35 m, on the
basis of a maximum fluctuation in reservoir level of about 30 m during normal
operation. Twelve dredging units plus three standby units, with an annual dredging
capacity of 70×10
6
tons, were proposed. At the time of its proposal in 1985, dredging
was estimated to require a capital investment of $155 million, which would be recovered
after 20 years at an interest rate of 8 percent.
TABLE 23.2 Role of Bottom Outlets in Venting Turbid Density Currents, Sefid-Rud
Reservoir
Average flow rate
Discharge averaged
sediment concentration
Date
Operation
mode*
Inflow, m
3
/s
Discharge
m
3
/s
Average
reservoir
level, m
Inflow, g/L Outflow, g/L
Sediment
release
efficiency,
%
Apr. 1-2, 1973 P 290 109 259 4.1 0.1 0.9
Apr. 9-10, 1973 P + B 484 145 264 13.0 10.0 23.0
Apr. 17-18, 1973 P 420 127 267 4.4 0.1 0.8
Oct. 5, 1973 P 321 280 272 7.4 0.2 2.3
Oct. 14-15. 1973 P + B 415 385 273 13.0 5.0 36.0
*P= power intakes open, P + B = power intakes + one bottom outlet open.
CASE STUDY: SEFID-RUD RESERVOIR, IRAN 23.8
FIGURE 23.7 Schematic diagram of dredging strategy considered but not implemented at Sefid-
Rud Reservoir (after Tolouie, 1993).
Dredging with discharge to the river downstream of the dam was not considered
feasible because, during the irrigation season, the dredged sediment would be carried
downstream and deposit behind irrigation barrages and diversion dams, or within the
system of irrigation canals. This would only move the sedimentation problem from one
location to another.
Although it was not considered technically or economically feasible to undertake
large-scale dredging at Sefid-Rud, dredging is considered the only feasible method of
removing cohesive sediment deposits within 3 km of the dam. This area is characterized by
difficult access due to the unconsolidated deposits, and the sediments consist of
nonlayered cohesive material. One alternative in this area is for a cutterhead dredge to pump
sediments by pipeline into the main flushing channel, from which they would be washed out
during subsequent flushing. Use of a short pipeline discharging to the flushing channel
minimizes pumping head and dredging cost.
23.3.2 Siphon Dredging
A siphon dredge differs from a conventional hydraulic dredge only in that a pump is not
used; the slurry is moved by the difference in static head between the reservoir and the
discharge point below the dam (Fig. 16.6a). Discharge distance is limited by the head
available between the reservoir water level and the toe of the dam. In the case of
SefidRud, the dredge would be able to work to a distance of about 2 to 3 km from the dam.
However, a siphon dredge was considered too costly for use at this site.
23.3.3 Explosives
Another alternative was the use of explosives to destabilize banks along the flushing channel
during drawdown to increase the amount of sediment removed by flushing. In areas of
low bank elevation, continuous cable charges could be installed at depths up to 3 m by
cable-laying equipment in which the cable drum has been replaced with an explosives tank. In
areas of higher banks, 100-mm holes could be drilled for placement of explosives (Fig.
23.8). Waterproof explosives would be required. This method was estimated to be capable of
removing 30 to 50 Mm
3
of additional sediment over the course of two flushing events.
23.3.4 Venting Turbid Density Currents
The venting of turbid density currents was the primary means of releasing sediment
during normal impounding. Although venting of turbid density currents can retard
sediment accumulation, it cannot stop deposition or recover capacity. Thus, density
current release was not considered a feasible solution.
CASE STUDY: SEFID-RUD RESERVOIR, IRAN 23.9
FIGURE 23.8 Proposed use of explosives at Sefid-Rud Reservoir to enhance bank failure and
widen the flushing channel (after Tolouie, 1993).
23.3.5 Sediment Bypassing
Sediment bypass would release inflow on those days of high sediment discharge during
flood events. However, the topographic features at Sefid-Rud are not conducive to
construction of a bypass channel around the reservoir. The hydrologic size of the
reservoir is too large to effectively pass sediment through the impoundment, and a large
fraction of the inflowing load is sand that would settle quickly and be more difficult to
bypass. Thus, bypassing was not considered a viable alternative.
23.3.6 Emptying and Flushing
The sediment management technique selected for utilization was to seasonally empty and
flush the reservoir, which entailed the change in operating rule shown in Fig. 23.9.
CASE STUDY: SEFID-RUD RESERVOIR, IRAN 23.10
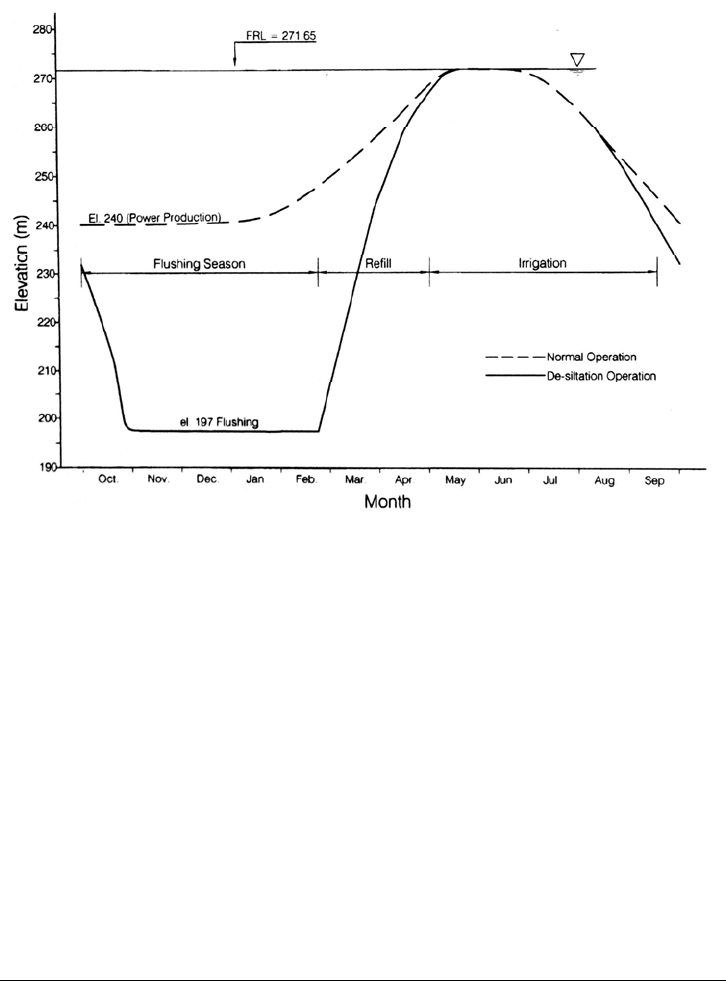
FIGURE 23.9 Operation curve at Sefid-Rud Reservoir showing water levels for conventional
impounding and the modification for flushing operation (after Tolouie, 1993).
Under the original operating rule, which did not consider sediment removal, filling
occurred during the winter wet season and irrigation deliveries were made during the
months of April through September. For continued hydropower production, the minimum
operating level was maintained at 240 m after the end of the irrigation season. To undertake
flushing, instead of maintaining a minimum elevation of 240 m for power generation
during the nonirrigation season, the reservoir is emptied and the river discharges freely
through bottom outlets, scouring a flushing channel through the deposits. This technique
can be implemented without interfering with the primary operational objective, which is
irrigation service. This reservoir does not have carryover storage from one year to the
next. Flushing also does not require costly, sophisticated, and energy-intensive
equipment such as required for dredging, and is economical to implement. Tolouie (1993)
cited the estimated unit cost of sediment removal by the proposed dredging project as a
minimum of $3.00/m
3
, as compared to $0.10/m
3
for flushing.
23.4 RESERVOIR FLUSHING
23.4.1 Reservoir Operation
Sediment control was initiated in water year 1980-1981 by emptying and flushing the
reservoir from October to February, the period of low flow. In some years flushing
began as early as mid-September or as late as mid-November, but refilling was always
initiated in the first or second week of February. It would be highly desirable to delay
closure of the bottom gates to allow large spring discharges to scour the deposits and
CASE STUDY: SEFID-RUD RESERVOIR, IRAN 23.11
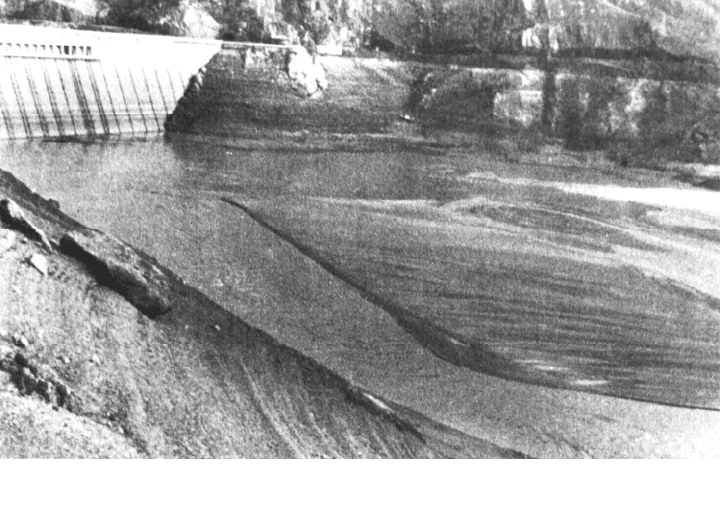
FIGURE 23.10 Photograph of upstream side of Sefid-Rud Dam during partial drawdown in 1981-
1982 (E. Tolouie).
widen the main flushing channel, but the uncertainty of filling the reservoir dictates
closure in February.
During the first 2 years of flushing (1980-1981 and 1981-1982), the reservoir was
not completely drawn down for fear that unstable sediments near the dam would slump
and block the bottom outlets. Figure 23.10 shows the appearance of the deposits
upstream of the dam during the 1981-1982 partial drawdown. The gabion cofferdam,
which had not been demolished after dam construction and had become buried in
sediments, was exposed when sediment deposits near the dam were scoured away.
For 3 months during the first flushing season water overflowed the cofferdam crest and
eroded the downstream face, endangering its stability. During the early part of the
subsequent flushing season, the sediment plug in a broken section of the cofferdam was
eroded through, and by the third year enough sediment had been washed away from the
area near the dam to allow complete drawdown. Flushing created a main channel
through the deposited sediment, generally following the original thalweg of the Qezel
Owzan and Shahrud Rivers. Selected statistics on each of the flushing periods
conducted through 1990 are summarized in Table 23.3.
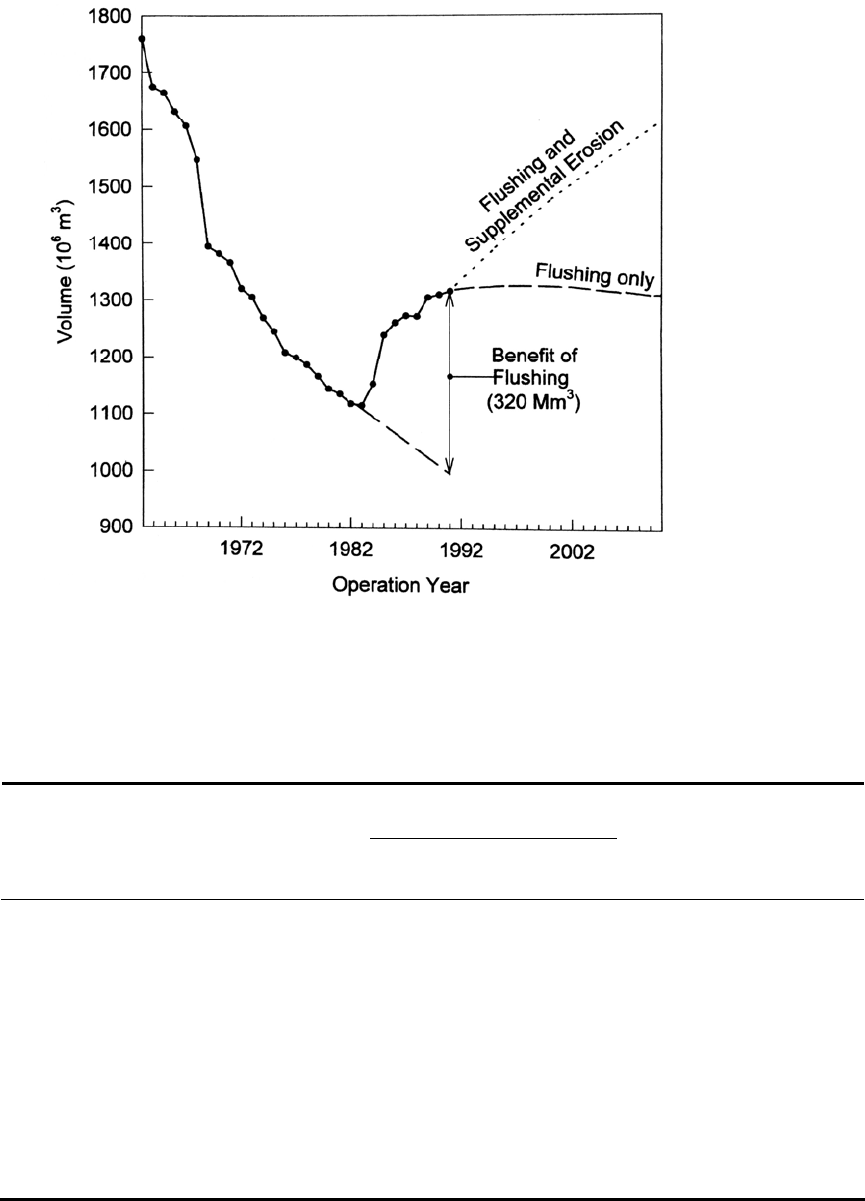
The initial years of erosion and expansion of the main channel produced very high
sediment yields and rapid recovery of storage capacity. As illustrated in Fig. 23.11, the
total benefit of flushing consists of the volume of sediment removed plus the volume of
deposition prevented. At Sefid-Rud this was equivalent to 320 Mm
3
of reservoir volume
over the first 10 years of flushing. The 320 Mm
3
of sediment removal required 10.667
Mm
3
of water, an average of 33 m
3
of water for each 1 m
3
of sediment removed and an
average suspended sediment concentration of 48 g/L, as in Table 23.3. However, these
average values can be misleading because of large year-to-year differences in sediment
removal. Large variations also occur during flushing events; suspended sediment
concentration is highest when flushing starts and declines rapidly.
CASE STUDY: SEFID-RUD RESERVOIR, IRAN 23.12
FIGURE 23.11 Recovery of reservoir storage as a result of flushing. The total benefit
of flushing is the sum of the storage recovered plus the storage loss avoided. Predicted
long-term storage recovery using flushing alone compared to flushing plus supplemental
floodplain erosion by using longitudinal diversion channels (adapted from Tolouie, 1993).
TABLE 23.3 Flushing Statistics
Sedi
ment
Removed,
10
6
t
Average
suspended
sediment
concentration in
flushing flow g/L
Water volume used to flush
D
rawdown
flushing
duration, days
Empty
flushing,
Flushing
period
% of annual
inflows
day
s
10
6
m
3
1980-1981 61 0 536 10 24 45
1981-1982 65 0 390 11 12 31
1982-1983 117 10 1,513 26 52 34
1983-1984 16 80 795 23 68 85
1984-1985 19 138 1,810 29 142 78
1985-1986 18 129 1,131 29 46 41
1986-1987 17 85 942 26 27 29
1987-1988 24 86 1,812 22 57 31
1988-1989 9 113 1,057 31 54 51
1989-1990 5 103 681 22 32 47
Total 351 744 10,667 21 514 48