Menke W. Geophysical Data Analysis: Discrete Inverse Theory
Подождите немного. Документ загружается.

88
5
Linear, Gaussian Inverse Problem, Viewpoint
3
mest
model
m
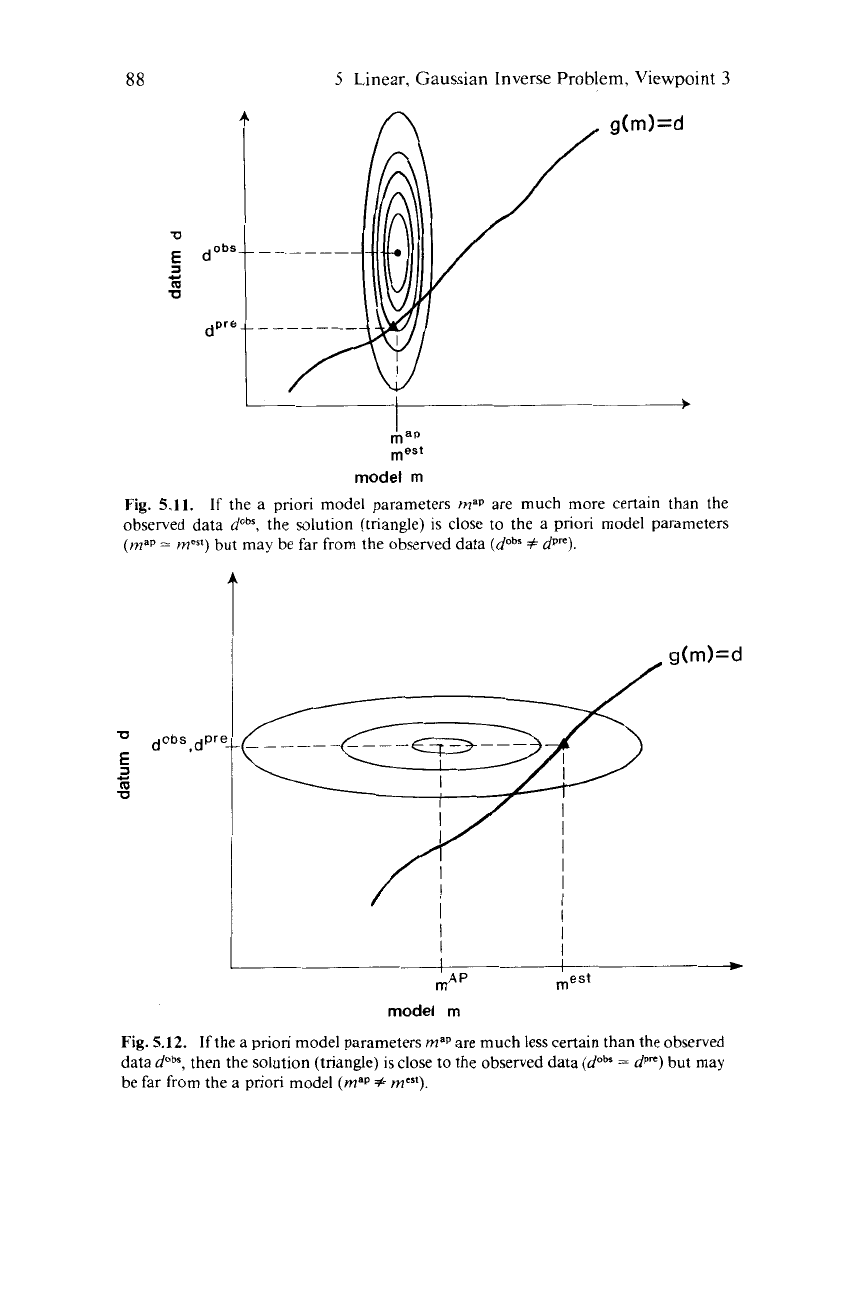
Fig.
5.11.
If
the a priori model parameters
map
are much more certain than the
observed data
dobr,
the solution (triangle)
is
close to the a priori model parameters
(map
)
but may be far from the observed data
(dabs
f
dp").
T
U
CI
5
m
U
I
./
g(m)=d
I
I
I
I
I
I
*
mest
m
AP
model
m
Fig.
5.12.
If
the a priori model parameters
map
are much less certain than the observed
data
dabs,
then the solution (triangle)
is
close to the observed data
(doh
=
dpm)
but may
be far from the a
priori
model
(map
#
mest).

5.5
Inexact
Theories
89
certain than the model parameters (i.e.,
a,
<<
om),
then the estimates
of the model parameters primarily reflect information contained in the
data (Fig.
5.12).
5.5
Inexact
Theories
In many realistic problems there are errors associated with the
theory. Some of the assumptions that go into the theory may be
somewhat unrealistic; or, it may be an approximate form of a clumsier
but exact theory. The model equation
g(m)
=
d
can no longer be
represented by a simple surface. It has become “fuzzy” because there
are now errors associated with it (Fig.
5.13;
Ref.
19).
Instead of a
surface, one might envision a distribution
P,(mld)
centered about
g(m)
=
d,
with width proportional to the uncertainty of the theory.
(The vertical bar in the expression
P,(mld)
indicates that this distribu-
tion is a
conditional probability distribution,
the probability of the
theory predicting a set of data
d
given model parameters
m.
It
is
therefore not a joint distribution of
m
and
d.)
Rather than find the
maximum likelihood point of
P,(m, d)
on the surface, we combine
P,(m, d)
and
P,(mld)
into a single distribution and find its maximum
likelihood point (Fig.
5.13).
Since the theory is assumed to be indepen-
<m>
model
m
Fig.
5.13.
When the theory is inexact and represented
by
the conditional distribution
P,(rnld),
the solution (triangle) is at the maximum likelihood point
of
the product
PAm.
d)P,(mld).
90
5
Linear, Gaussian Inverse Problem, Viewpoint
3
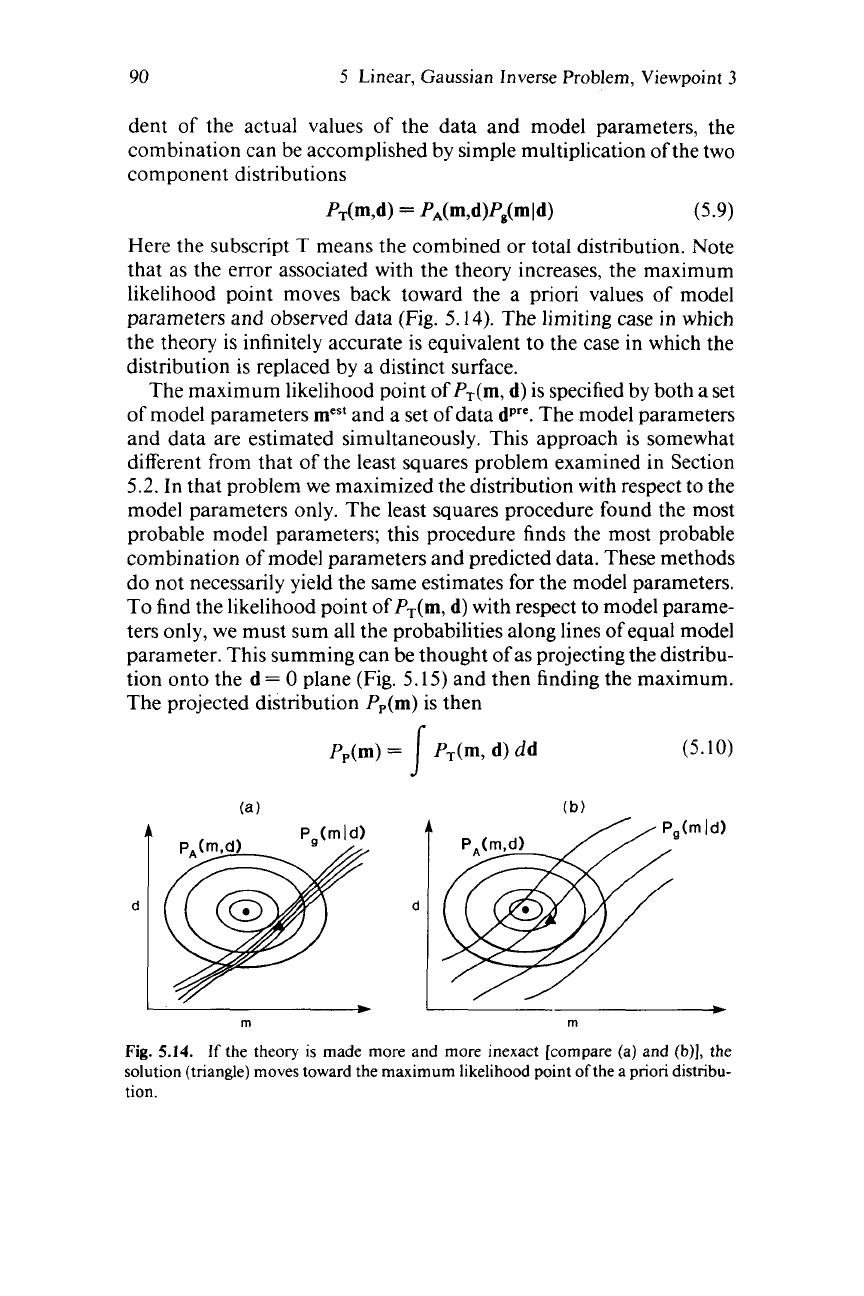
dent of the actual values of the data and model parameters, the
combination can be accomplished by simple multiplication of the two
component distributions
P,(m,d)
=
mW-w,(mld)
(5.9)
Here the subscript T means the combined
or
total distribution. Note
that as the error associated with the theory increases, the maximum
likelihood point moves back toward the a priori values of model
parameters and observed data (Fig.
5.14).
The limiting case in which
the theory is infinitely accurate is equivalent to the case in which the
distribution is replaced by a distinct surface.
The maximum likelihood point
of
P,(m,
d)
is specified by both a set
of model parameters
mest
and a set of data
dpre.
The model parameters
and data are estimated simultaneously. This approach is somewhat
different from that
of
the least squares problem examined in Section
5.2.
In that problem we maximized the distribution with respect
to
the
model parameters only. The least squares procedure found the most
probable model parameters; this procedure finds the most probable
combination of model parameters and predicted data. These methods
do not necessarily yield the same estimates for the model parameters.
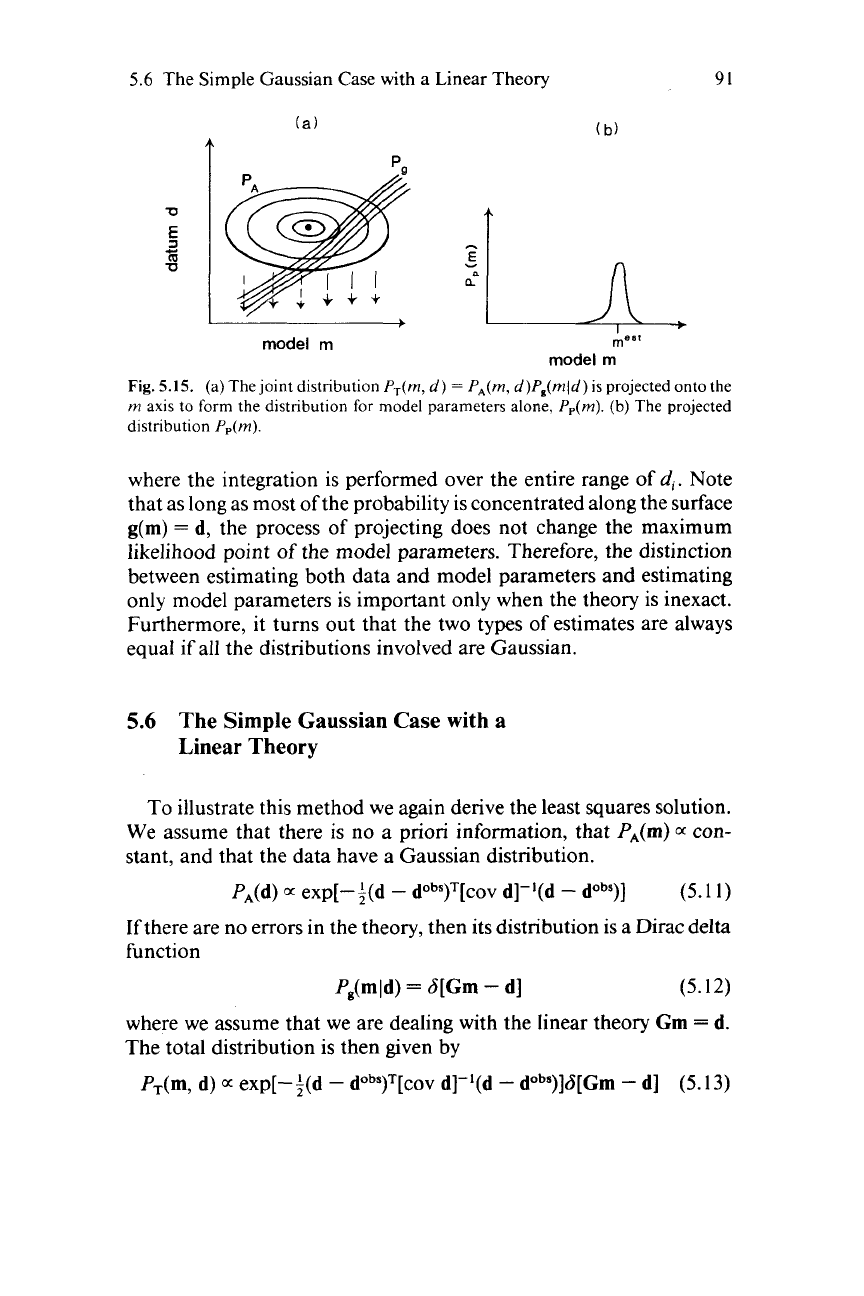
To find the likelihood point
of
PT(m, d)
with respect to model parame-
ters only, we must sum all the probabilities along lines
of
equal model
parameter. This summing can be thought of as projecting the distribu-
tion onto the
d
=
0
plane (Fig.
5.15)
and then finding the maximum.
The projected distribution
Pp(m)
is then
d
r
(5.10)
*
rn
+
rn
Fig.
5.14.
If
the theory is made more and more inexact [compare (a) and
(b)],
the
solution (triangle) moves toward the maximum likelihood point
of
the a
prion
distribu-
tion.
5.6
The Simple
Gaussian Case
with
a Linear
Theory
91
b
model m
n
me*I
model
rn
Fig.
5.15.
(a)
The
joint distribution
P,(m,
d)
=
PA(rn,
d)P,(rnld)
is
projected onto the
rn
axis to form the distribution for model parameters alone,
Pp(m).
(b)
The projected
distribution
Pp(m).
where the integration is performed over the entire range of
di.
Note
that as long as most of the probability is concentrated along the surface
g(m)
=
d, the process of projecting does not change the maximum
likelihood point
of
the model parameters. Therefore, the distinction
between estimating both data and model parameters and estimating
only model parameters is important
only
when the theory is inexact.
Furthermore, it turns out that the two types of estimates are always
equal if all the distributions involved are Gaussian.
5.6
The Simple Gaussian Case with a
Linear Theory
To illustrate this method we again derive the least squares solution.
We assume that there is no a
priori
information, that P,(m)
c~
con-
stant, and that the data have a Gaussian distribution.
P,(d)
0:
exp[-i(d
-
dobs)T[cov d]-'(d
-
dabs)]
(5.1
1)
If
there are no errors in the theory, then its distribution is a Dirac delta
function
P,(mld)
=
6[Gm
-
d]
(5.12)
where we assume that we are dealing with the linear theory Gm
=
d.
The total distribution is then given by
PT(m,
d)
a
exp[--f(d
-
dobs)T[cov d]-I(d
-
dobs)]GIGm
-
d]
(5.13)
92
5
Linear, Gaussian Inverse Problem, Viewpoint
3
Performing the projection "integrates away" the delta function
Pp(m)
0:
exp[-i(Gm
-
dobs)T[cov d]-l(Gm
-
dabs)]
(5.14)
This projected distribution is exactly the one we encountered in the
least squares problem, and the position of its maximum likelihood
point is given by the least squares solution.
5.7
The General Linear, Gaussian Case
In the general linear, Gaussian case we assume that all the compo-
nent distributions are Gaussian and that the theory is the linear
equation Gm
=
d,
so
that
P,(m)
0:
exp[- +(m
-
(m))T[cov m]-'(m
-
(m))]
P,(d)
c~
exp[- i(d
-
dobs)T[cov d]-'(d
-
dabs)]
P,(mld)
a
exp[-i(d
-
Gm)T[cov g]-l(d
-
Gm)]
(5.15)
The total distribution is then the product of these three distributions.
We now show that the combined distribution is itself Gaussian. We
first define a vector x
=
[d, mIT that contains the data and model
parameters and a covariance matrix.
0
[covm]
OI
[cov d]
[cov
XI
=
(5.16)
The first two products in the total distribution can then be combined
into an exponential, with the argument given by
-i[x
-
(x)]"cov XI-"x
-
(x)]
(5.17)
To
express the third product in terms of x, we define a matrix F
=
[I,
-GI such that Fx
=
d
-
Gm
=
0.
The argument of the third
product's exponential is then given by
-~[Fx]~[cov g]-'[Fx] (5.18)
The total distribution is proportional to an exponential with argument
(5.19)
We shall show that this expression can
be
manipulated into the
form
-+[x
-
X*]T[COV x*]-"x
-
x*]
(5.20)
-:[x
-
(x)]~[cov x]-'[x
-
(x)]
-
~[Fx]~[cov g]-'[Fx]
5.7
The General Linear, Gaussian Case
93
Here x* is some vector and [cov x*] is some matrix. The total
distribution PT(x), therefore, has a Gaussian form and has a maximum
likelihood point xest
=
x*. In Section 5.10, we shall derive
x*
and
[cov x*].
For
now, we simply state the result as
X*
=
[I
-
[COV x]FT(F[cov x]FT
(5.2
I)
+
[cov gl)-'Fl(x)
[COV x*]
=
[I
-
[COV x]FT(F[cov x]FT
+
[cov g])-'F][cov x]
Note that the formula for x* has the
form
of a transformation or
projection of the a priori vector (x), that is
x*
=
T(
x). Note also that
nothing
in
this derivation requires the special forms of
F
and [COY x]
assumed above that made Fx
=
0
separable into an
explicit
linear
inverse problem. Equation
(5.21)
is
in fact the solution to the com-
pletely general,
implicit,
linear inverse problem.
When Fx
=
0
is an explicit equation, the formula for xest in Eqn.
(5.2
1)
can be decomposed into its component vectors dpre and mest. An
explicit formula for the estimated model parameters
is
given by
mest
=
(m)
+
G-g[dobs-G(m)]
=
G-gd
+
[I
-
R](m)
G-g
=
[cov m]G'([cov d]
+
[cov g]
+
G[cov m]GT)-'
(5.22)
=
(GT[[cov d]
+
[cov g]]-'G
+
[COY rn]-')-'GT{[cov d]
+
[cov g])-l
where we have used the generalized inverse notation for convenience.
Note that the two forms of the generalized inverse are equivalent (as
can be shown by applying the matrix identities derived in Section
5.10).
Since the estimated model parameters are a linear combination of
observed data and a priori model parameters, we can therefore calcu-
late its covariance as
[cov mest]
=
G-gjcov d]G-gT
+
[I
-
R][cov m][I
-
RIT
(5.23)
This expression differs from those derived in Chapters
3
and
4
in that it
contains a term dependent on the a priori model parameter covariance
[cov m].
We can examine a few interesting limiting cases of problems which
have uncorrelated a priori model parameters ([cov m]
=
aiI),
data
([cov d]
=
a21)
and theory ([cov g]
=
air).
94
5
Linear, Gaussian Inverse Problem, Viewpoint
3
5.7.1
EXACT DATA AND THEORY
Suppose
CT~
=
of
=
0.
The solution is then given by
Note that the solution does not depend on the a priori model variance,
since the data and theory are infinitely more accurate than the a priori
model parameters. These solutions are just the minimum length and
least squares solutions, which (as we now see) are simply two different
aspects of the same solution. The minimum length of the solution,
however, exists only when the problem is purely underdetermined; the
least squares form exists only when the problem is purely overdeter-
mined.
If the a priori model parameters are not equal to zero, then another
term appears in the estimated solution.
mest
=
GT [GGT]-ldobS
+
(I
-
GTIGGT]-IG)(m)
=
[GTG]-'GTdobS
+
(I
-
[GTG]-lGTG>(m)
=
G-gdobs
+
{I
-
R)(m)
(5.25)
The minimum-length-type solution has been changed by adding a
weighted amount of the a priori model vector, with the weighting
factor being
(I
-
GT[GGT]-'G).
This term is not zero, since
it
can also
be written as
(I
-
R).
The resolution matrix of the underdetermined
problem never equals the identity matrix. On the other hand, the
resolution matrix of the overdetermined least squares problem does
equal the identity matrix,
so
the estimated model parameters of the
overdetermined problem are not a function of the a priori model
parameters. Adding a priori information with finite error to an inverse
problem that features exact data and theory. only affects the underde-
termined part of the solution.
5.7.2
INFINITELY INEXACT DATA AND
THEORY
In the case of infinitely inexact data and theory, we take the limit
(m)
(5.26)
02
-
03
or
r~f
-
03
(or both). The solution becomes
mest
=
5.8
Equivalence
of
the
Three Viewpoints
95
Since the data and theory contain no information, we simply recover
the a priori model parameters.
5.7.3
NO
A
PRIOR1 KNOWLEDGE
OF
THE
MODEL PARAMETERS
In this case, the limit is
0%-
m.
The solutions are the same as in
mest
=
GT[GGT]-'dobS
+
(I
-
GT[GGT]-'G)(m)
(5.27)
Infinitely weak a priori information and finite-error data and theory,
produce the same results as finite-error a priori information and
error-free data and theory.
Section
5.6.1.
5.8
Equivalence
of
the Three Viewpoints
We can arrive at the same general solution to the linear inverse
problem by three distinct routes.
Vzewpoint
I.
The solution is obtained by minimizing a weighted sum
of
L,
prediction error and
L,
solution simplicity.
Minimize:
eTW,e
+
a[m
-
(m)ITWm[m
-
(m)]
(5.28)
where
a
is a weighting factor.
Viewpoint
2.
The solution is obtained by minimizing a weighted
sum
of three terms: the Dirichlet spreads of model resolution and data
resolution and the size of the model covariance.
Minimize:
a,
spread(R)
+
a,
spread(N)
+
a3
size[cov,
m]
(5.29)
Viewpoint
3.
The solution is obtained by maximizing the likelihood
of
the joint Gaussian distribution of data, a priori model parameters, and
theory.
Maximize:
PT(m,
d)
(5.30)
These derivations emphasize the close relationship among the
L,
norm, the Dirichlet spread function, and the Gaussian distribution.
96
5
Linear, Gaussian Inverse
Problem,
Viewpoint
3
5.9
The
F
Test
of
Error Improvement
Significance
We sometimes have
two
candidate models for describing an overde-
termined inverse problem, one of which is more complicated than the
other (in the sense that it possesses a greater number of model parame-
ters). Suppose that Model
2
is more complicated than Model
1
and
that the total prediction error for Model
2
is less than the total
prediction error for Model
1
:
E2
<
El
.
Does Model
2
really fit the data
better than Model
l?
The answer to this question depends on the variance of the data.
Almost any complicated model will fit data better than a less compli-
cated one. The relevant question is whether the fit is
significantly
better, that is, whether the improvement is too large to be accounted
for by random fluctuations in the data. For statistical reasons that will
be cited, we pretend, in this case, that the two inverse problems are
solved with two different realizations of the data.
Suppose that we estimate the variance of the data
d,
from the
prediction error
e,
of each model as
a$
=
Ce;?/(N
-
M)
This estimate will usually be larger than the true variance of the data,
since it also includes a contribution from the (possibly) poor fit
of
the
model. If one model fits the data about as well as the other, then the
variance
a$,
estimated from Model
1
should be about the same as the
variance
a;*
estimated from Model
2.
On the other hand,
if
Model
2
gives a better
fit
than Model
1,
the estimated variances will differ in
such a way that the ratio
ail
/a&
will be greater than unity. If the ratio
is only slightly greater than unity, the difference in fit may be entirely a
result of random fluctuations in the data and therefore may not be
significant. Nevertheless, there is clearly some value for the ratio that
indicates a significant difference between the two fits.
To
compute this critical value, we consider the theoretical distribu-
tion for the ratio of two variance estimates derived from two different
realizations of the
same
data set. Of course, the ratio of the true
variance with itself always has the value unity; but the ratio of two
estimates of the true variance will fluctuate randomly about unity. We
therefore determine whether or not ratios greater than or equal to the
observed ratio occur less than, say,
5%
of the time. If they do, then
there is a
95%
probability that the two estimates are derived from data
5.10
Derivation
of
the
Formulas
of
Section
5.7
97
sets with different true variances. We are justified in concluding that
the second model is a significant improvement over the first.
To
handle data with nonuniform variance we form a ratio, not
of
estimated variances, but of the related quantity
N
xz
=
l/v
C
e:/a5Te;
v
=
N
-
A4
(5.31)
This quantity
is
chosen because it has ax: distribution with
v
degrees of
freedom. The ratio of the
xt
for the two models is gven by
i=
I
F
=
xz,
/xt,
(5.32)
Note that the
F
ratio is not a function
of
the overall amplitude
of
the
data's true variance but only of the relative error between the different
observations. In practice it is sufficient
to
use approximate estimates
of
the relative error between the
d,
when computing the
F
ratio.
The distribution
of
the Fratio has been derived by statiticians and is
called the
F
distribution. It is a unimodal distribution with mean
v2/(v2
-
2).
Its variance is given by
2v3v1
+
v2
-
2)
VI(V2
-
2)2(v2
-
4)
var(F)
=
(5.33)
The functional form of the
F
distribution is given by
where is the Gamma function.
Most statistical texts provide tables that give the value for which
ratios greater than or equal to
F
occur only
5%
of
the time.
If
the
F
for
the two candidate models is greater than this critical value, then we can
reasonably assume that the improvement in error is not a result
of
random fluctuations in the data but
of
a significant difference between
the models.
5.10
Derivation
of
the Formulas
of
Section
5.7
We first need to derive two general matrix identities (adapted from
[Ref.
181,
with permission). Let
C,
and
C2
be two symmetric matrices