Lewis R.I. Turbomachinery Performance Analysis
Подождите немного. Документ загружается.

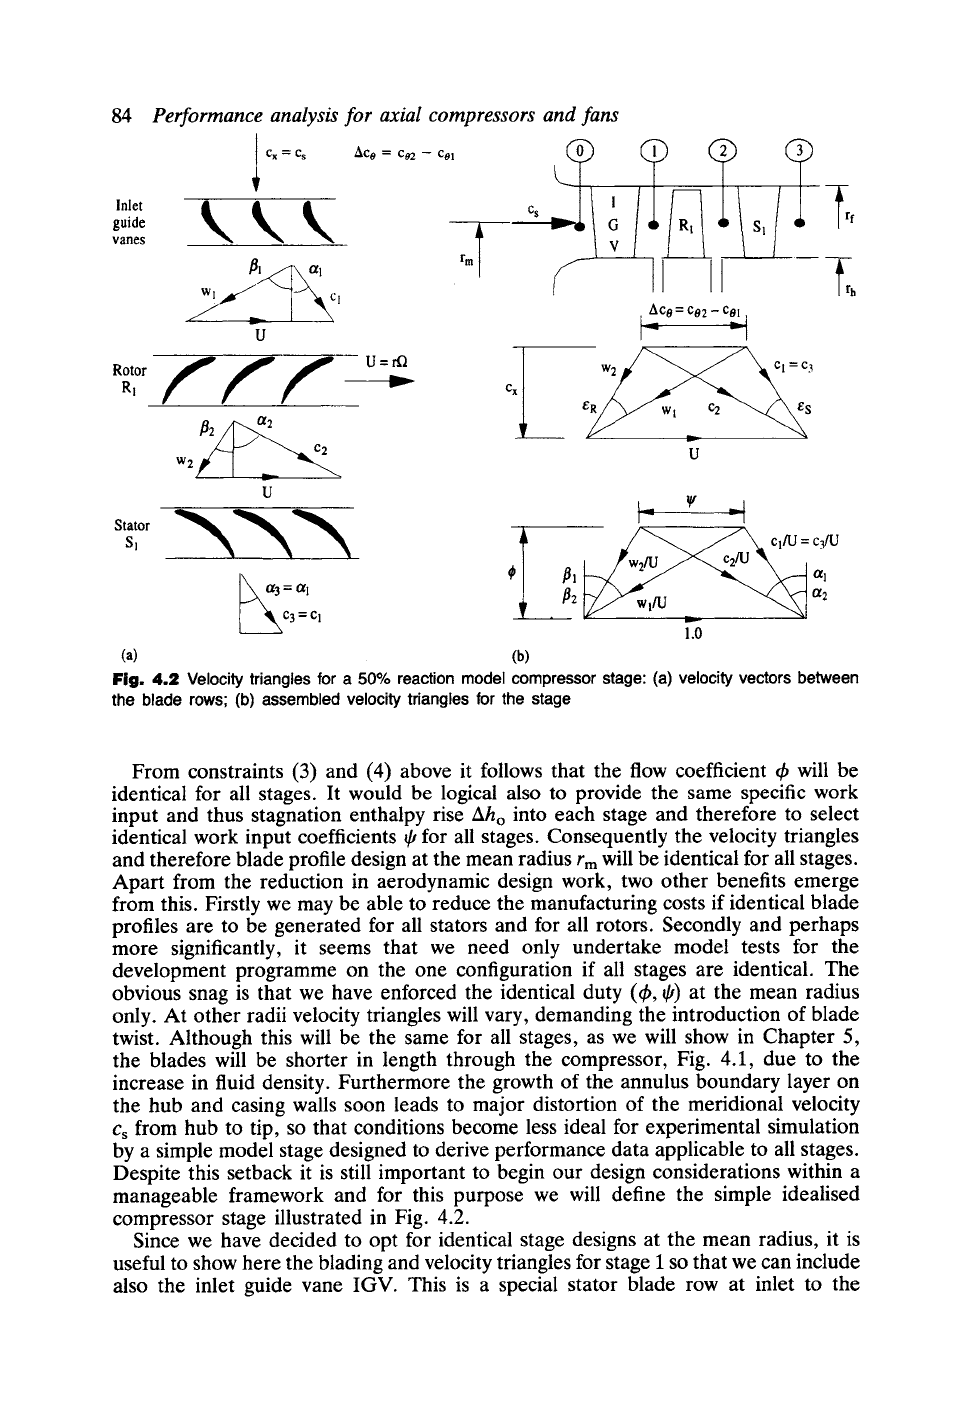
84
Inlet
guide
vanes
Performance analysis for axial compressors and fans
I C x =
C s AC o
= Cg 2 -- C01 L(~
fli rm ~-
u
Rotor
f~f
U-rf~
R~
II~
...__
v
u
StatOrsl
II II
s /
i _Ac~ co2
-
c~i
W 2 ~1 = C3
W 1 c2 ~~.,.~S
-%
u
L... g ..1
I-- Vl
~
=a, /h Lf/~ w,rO a2
C 3 = C !
1.0
(a) (b)
---~rf
Irh
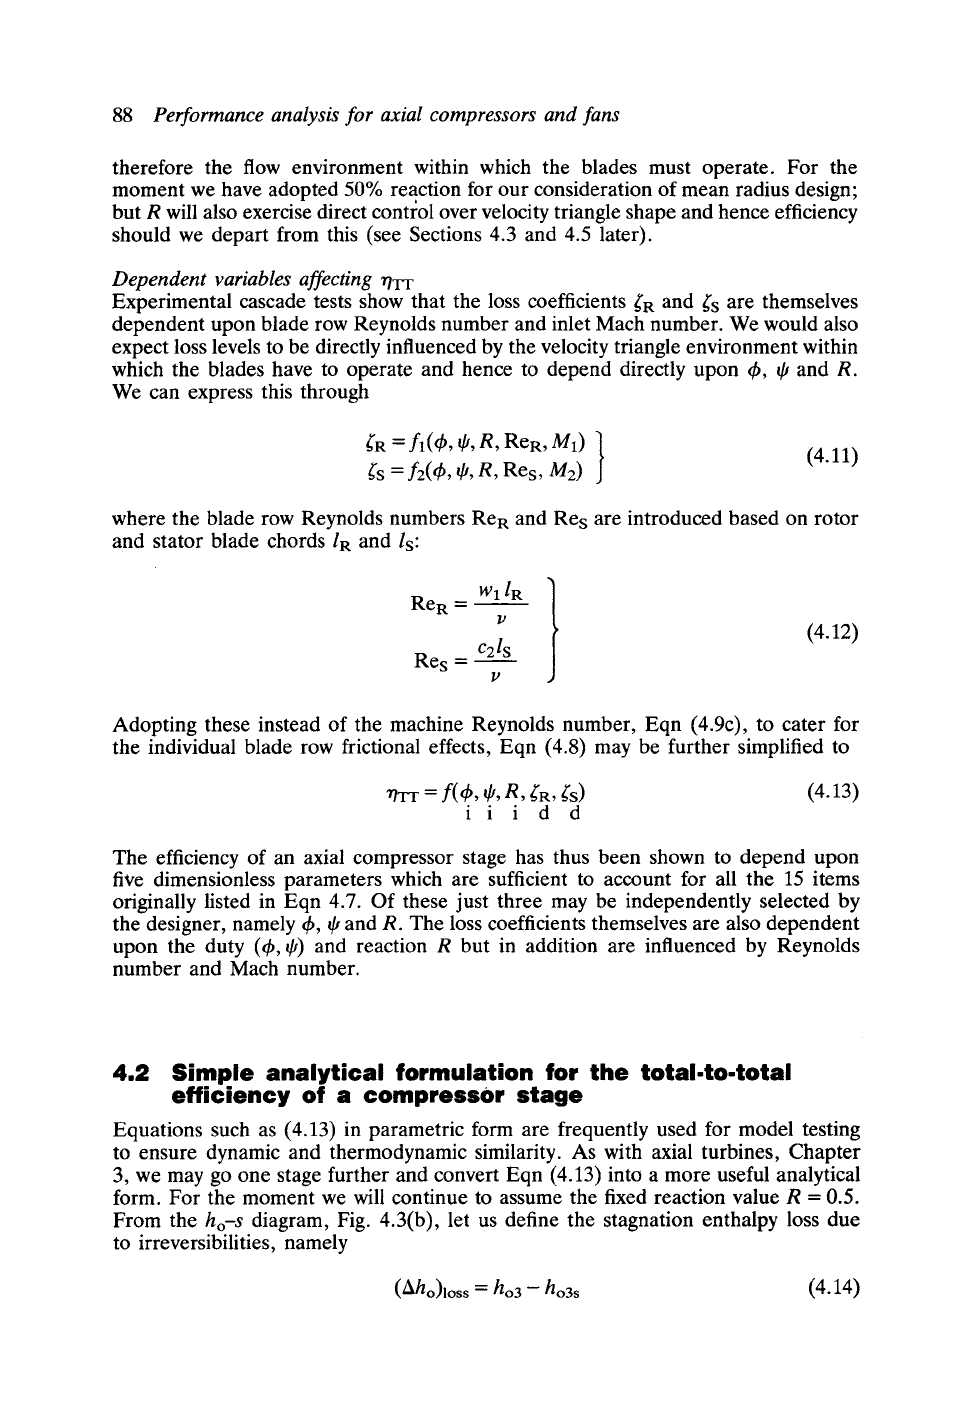
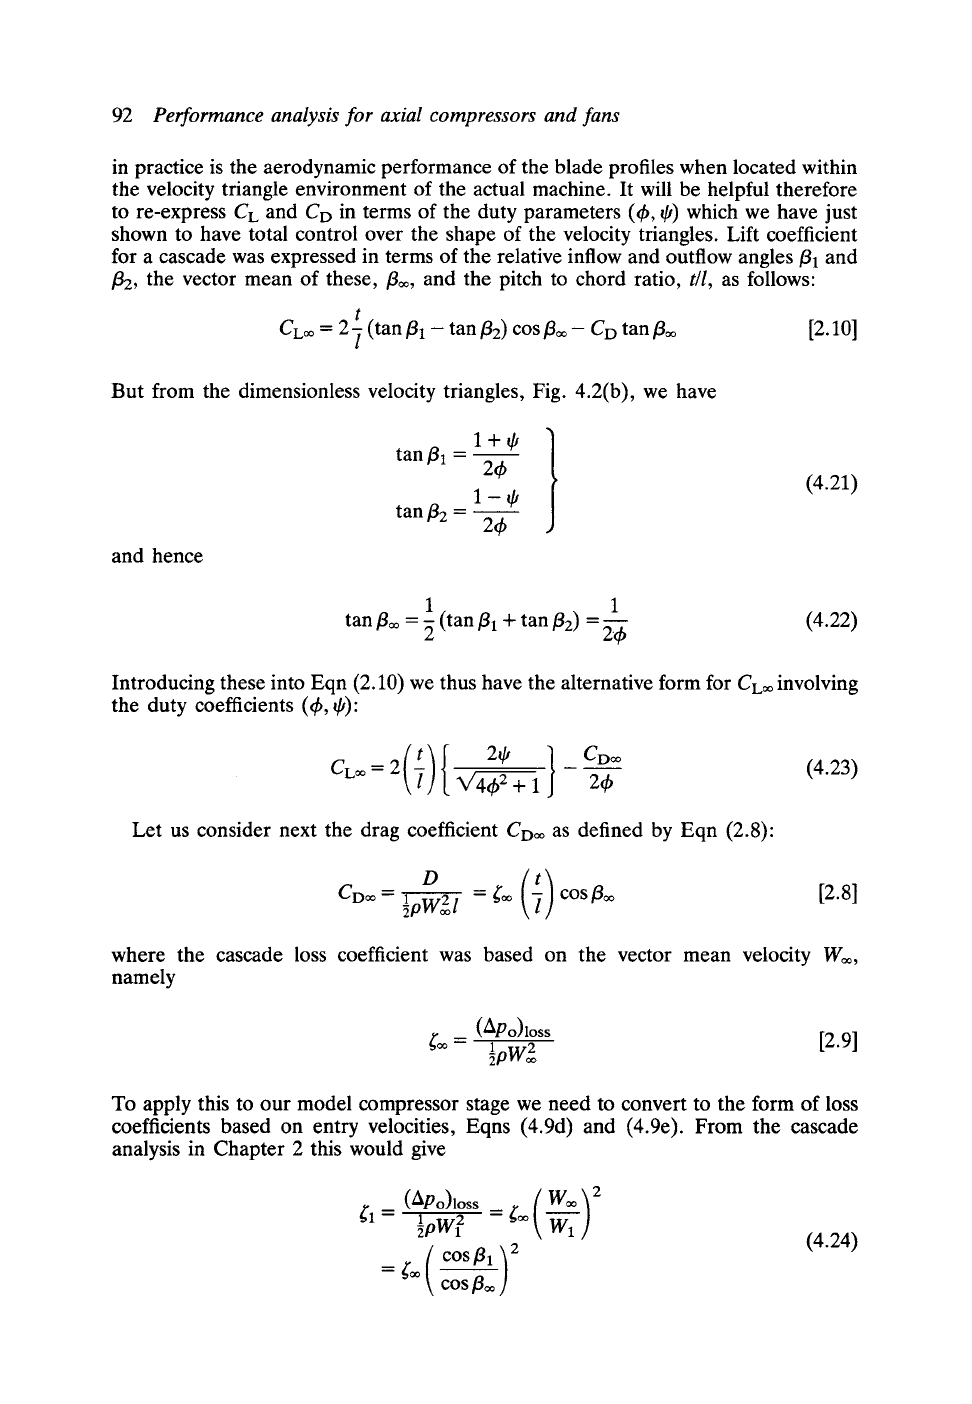
Fig. 4.2 Velocity triangles for a 50% reaction model compressor stage: (a) velocity vectors between
the blade rows; (b) assembled velocity triangles for the stage
From constraints (3) and (4) above it follows that the flow coefficient ~b will be
identical for all stages. It would be logical also to provide the same specific work
input and thus stagnation enthalpy rise Aho into each stage and therefore to select
identical work input coefficients ~ for all stages. Consequently the velocity triangles
and therefore blade profile design at the mean radius r m will be identical for all stages.
Apart from the reduction in aerodynamic design work, two other benefits emerge
from this. Firstly we may be able to reduce the manufacturing costs if identical blade
profiles are to be generated for all stators and for all rotors. Secondly and perhaps
more significantly, it seems that we need only undertake model tests for the
development programme on the one configuration if all stages are identical. The
obvious snag is that we have enforced the identical duty (4), ~) at the mean radius
only. At other radii velocity triangles will vary, demanding the introduction of blade
twist. Although this will be the same for all stages, as we will show in Chapter 5,
the blades will be shorter in length through the compressor, Fig. 4.1, due to the
increase in fluid density. Furthermore the growth of the annulus boundary layer on
the hub and casing walls soon leads to major distortion of the meridional velocity
Cs from hub to tip, so that conditions become less ideal for experimental simulation
by a simple model stage designed to derive performance data applicable to all stages.
Despite this setback it is still important to begin our design considerations within a
manageable framework and for this purpose we will define the simple idealised
compressor stage illustrated in Fig. 4.2.
Since we have decided to opt for identical stage designs at the mean radius, it is
useful to show here the blading and velocity triangles for stage I so that we can include
also the inlet guide vane IGV. This is a special stator blade row at inlet to the
4.1 Dimensional analysis for an axial compressor 85
compressor which introduces the pre-whirl angle ot I required at entry to the first rotor
R 1 in order to establish the repeating velocity triangles. Proceeding through the rotor
and then the first stator S1 the fluid is ejected directly into stage 2 with the same
entry velocity vector Ca = Cl, or3
--
Oil.
The individual velocity vectors at stations 0, 1, 2 and 3 are shown in Fig. 4.2(a)
and the resulting assembled stage velocity triangles in Fig. 4.2(b). Following the
strategy outlined for turbines in Chapter 3, it is extremely helpful also to create
dimensionless velocity triangles by normalising all velocities with the blade speed U
as also shown in Fig. 4.2(b). The dimensionless axial or meridional velocity then
becomes equal to the flow coefficient. That is
Cx r
-~-
= ~ = 4, (4.2)
But from the Euler pump equation (1.9a), the stagnation enthalpy rise is given
by
Aho = rm~(Co2-
col) -- UAco
(4.3)
So that the dimensionless change in peripheral whirl through either rotor or stator
becomes
Aco AWo Aho
U = U =
-~= ~ (4.4)
The duty coefficients (~b, ~) thus predetermine the general shape of the velocity
triangles, the only other controlling design feature being the stage reaction R. By
analogy with the definition for axial turbines, Eqn (3.4), the conventional definition
of stage reaction for axial compressors is as follows:
R = Specific enthalpy rise across the rotor
Specific enthalpy rise across the stage
(4.5)
R represents the fraction of overall specific enthalpy rise of the stage Ah produced
by the rotor. For the case illustrated in Fig. 4.2 the reaction is 50%, i.e. R = 0.5,
so that the rotor R 1 and stator S1 produce equal enthalpy rises. Consequently the
velocity triangles are symmetrical. For axial turbines we were able to show by
theoretical analysis in Section 3.5.1 that the optimum stage reaction would be close
to 50%. Although some of the assumptions made there concerning stator and rotor
aerodynamic loss coefficients were valid for the turbine with its accelerating cascade
flow but are less valid for the diffusing cascades of axial compressors, nevertheless
it is well known that 50% reaction places an axial compressor stage close to the
optimum selection of velocity triangles. It is very reasonable, therefore, for our model
stage to make the design selection of 50% reaction, i.e. R = 0.5, at the mean radius
rm. Of course at other radii, due to vortex design considerations, R will depart from
this ideal value as it did for turbines, Section 3.6 and Eqn (3.52). We will return
to this matter again in the next chapter within the relevant context of vortex and radial
equilibrium analysis.
To conclude this section it will be helpful to draw together, as we did for turbines
86 Performance analysis for axial compressors and fans
T P3 h~
3
P2
Pl
Ir/~~ol .
Pol
S S
(a) (b)
Fig, 4,3 (a)
T-s and (b) ho-S diagrams for an axial compressor stage
Po3
zah o
V
in Section 3.1, the various parameters considered so far which we would expect to
influence the total-to-total efficiency rtrr of an axial compressor and then to see how
these relate to the dimensionless groups which we have defined already. First of all
we must define total-to-total efficiency for a compressor and we will do this for our
model stage with reference to its T-s and ho-s diagrams, Fig. 4.3.
The conventional definition of rh--r is as follows:
~'/TT --
Stagnation enthalpy rise for an ideal (reversible) stage
Stagnation enthalpy rise for the actual stage
ho3s - hol
ho3 - hol
(4.6)
where the ideal stage is operating across the same pressure ratio
p3]Pl .
Due to fluid
friction within the real stage, some of the ordered kinetic energy entering the blade
rows is dissipated as heat during the diffusion processes which are so vulnerable to
loss generation. The gas thus leaves the compressor stage at a temperature T3 higher
than that of the ideal frictionless stage T3s, associated with an increase in specific
entropy, s3 - Sl.
Referring back now to our model stage, we could draw up the following list of
variables which we would expect to have some effect upon the stage total-to-total
efficiency:
rITT = f(~ho, hl,h2,.h~, ~
Cx, ~,
~,p, ai, a 2,
ApoR, Apos)
-y- y ) ~ J
Thermodynamic Speed and Velocity Properties of Roto~r and
variables size triangles working stator
substance losses
(4.7)
At this point the reader is referred to Chapter 3, Section 3.1, where similar groupings
4.1 Dimensional analysis for an axial compressor
87
have been presented and discussed for axial turbines. The main differences here are
selections of maximum velocities W l and c2 and associated local sonic velocities a l
and a2, now all chosen at entry to the blade rows. Following arguments from
dimensional analysis similar to those in Section 3.1, this equation may be simplified
to the following dimensionless form:
r/Tr = f{th, ~, R,
W1 c2
,M1, M2,
Rem, ~'R, ~'S}
,.~ ~ '--.r ,--v -~
Duty Stage Velocity Mach Stage Loss
coefficients reaction triangles numbers Reynolds coefficients
number
(4.8)
where th, ~, and R have been defined already, and
M 1 = w__!
al
C2
M2 =--
a2
Urm
Rem =
/2
~R
~S
(ApoR)loss
1 2
~PWl
(Apos)loss
1
~pc 2
Rotor relative inlet Mach number
Stator inlet Mach number
Stage Reynolds number
Rotor loss coefficient
Stator loss coefficient
(4.9)
But from the dimensionless velocity triangles, Fig. 4.2(b), for our 50% reaction stage
we can show that
W1 __ C2
t~ 2 + (1 + qj)2
--ff - -~ =
~/ 1
w2_ Cl 4,2+ (1_~,)2
--6- - -6 =
(4.10)
so that Eqn (4.8) simplifies to
r/Tr = f(~b, ~,, R, M1, M2, Rem, ~'R, ~'S) (4.8a)
i i i d d d d d
where the labels i and d have been added below to indicate independent and
dependent design variables respectively. Let us comment on these in turn.
Independent design variables
The designer is free at the outset to select the design duty coefficients (th, ~,). As we
will see later from experimental tests, the designer's choice will have a profound effect
upon the stage efficiency rh~r attainable even with optimum aerodynamic design. The
reason for this is that ~b and ~, entirely control the shape of the velocity triangles and
88
Performance analysis for axial compressors and fans
therefore the flow environment within which the blades must operate. For the
moment we have adopted 50% reaction for our consideration of mean radius design;
but R will also exercise direct contl:ol over velocity triangle shape and hence efficiency
should we depart from this (see Sections 4.3 and 4.5 later).
Dependent variables affecting ~TTr
Experimental cascade tests show that the loss coefficients ~'R and srs are themselves
dependent upon blade row Reynolds number and inlet Mach number. We would also
expect loss levels to be directly influenced by the velocity triangle environment within
which the blades have to operate and hence to depend directly upon ~b, $ and R.
We can express this through
SrR = fl(q~, q~, R, ReR, M1) ]
~'s = f2(4, $, R, Res, M2)
I
(4.11)
where the blade row Reynolds numbers ReR and Res are introduced based on rotor
and stator blade chords IR and Is:
ReR
= w l
IR
Res =
C21s
(4.12)
Adopting these instead of the machine Reynolds number, Eqn (4.9c), to cater for
the individual blade row frictional effects, Eqn (4.8) may be further simplified to
nTr = f(~b, q~, R, ~rR, ~'S) (4.13)
i i i d d
The efficiency of an axial compressor stage has thus been shown to depend upon
five dimensionless parameters which are sufficient to account for all the 15 items
originally listed in Eqn 4.7. Of these just three may be independently selected by
the designer, namely th, qJ and R. The loss coefficients themselves are also dependent
upon the duty (~b, q0 and reaction R but in addition are influenced by Reynolds
number and Mach number.
4.2
Simple analytical formulation for the total.to.total
efficiency of a compressOr stage
Equations such as (4.13) in parametric form are frequently used for model testing
to ensure dynamic and thermodynamic similarity. As with axial turbines, Chapter
3, we may go one stage further and convert Eqn (4.13) into a more useful analytical
form. For the moment we will continue to assume the fixed reaction value R = 0.5.
From the
ho-s
diagram, Fig. 4.3(b), let us define the stagnation enthalpy loss due
to irreversibilities, namely
(Aho)loss = ho3- ho3s (4.14)
4.2 Analytical formulation for the total-to-total efficiency of a compressor stage
89
The stage stagnation enthalpy rise is given by
Aho
= ho3- hol
Hence the total-to-total efficiency, Eqn (4.6), becomes
(4.15)
ho3s -
hol
r/T T = ho3_ hol
= 1- (Ah~176
Aho
= 1- (Ap~176
pAho
=1-+( (Ap~176 2
(4.16)
The reader is referred to the full treatment given for turbines in Section 3.2 for
guidance on the thermodynamic approximation leading to the use of the stage
stagnation pressure loss (Apo)los s in this last equation. Since
(apo),oss = (aPoR),oss + (apos),oss
introduction of Eqns (4.9) and (4.10) results in the dimensionless loss
(Apo)los s
1 1
2
= (~R+ ~S 1
Finally, introducing this into Eqn (4.16), the total-to-total efficiency becomes
(4.17)
2-~-{
1( 1+ ~)2} (~'R "+ ~'S)
(4.18)
r/a-r = 1 - 4) 2 +~
Equation (4.18) is equivalent to the parametric equation (4.13) derived in general
form from dimensional analysis for the fixed reaction R = 0.5, but is in the much
more useful explicit form of an analytical relationship which shows exactly how rtrr
depends upon the various dimensionless groups. From this we can make the following
interpretation.
The efficiency of a 50% axial compressor stage is dependent upon two main
factors:
(1) The stage duty coefficients (t h, qJ).
(2) The blade row loss coefficients SrR and ~'s (i.e. the blade row aerodynamics).
The initial selection of the stage duty point (t h, qJ) is crucial. Thus we could rewrite
Eqn (4.18) in the form
r/TT = 1 -fc(~, ~)(~'R + ~'S)
(4.18a)
where the 'loss weighting coefficient' fc is given by
1 { q~2 1 }
fc(~b, 0)= ~- +~(1
+ ~)2
(4.19)
90
Performance analysis for axial compressors and fans
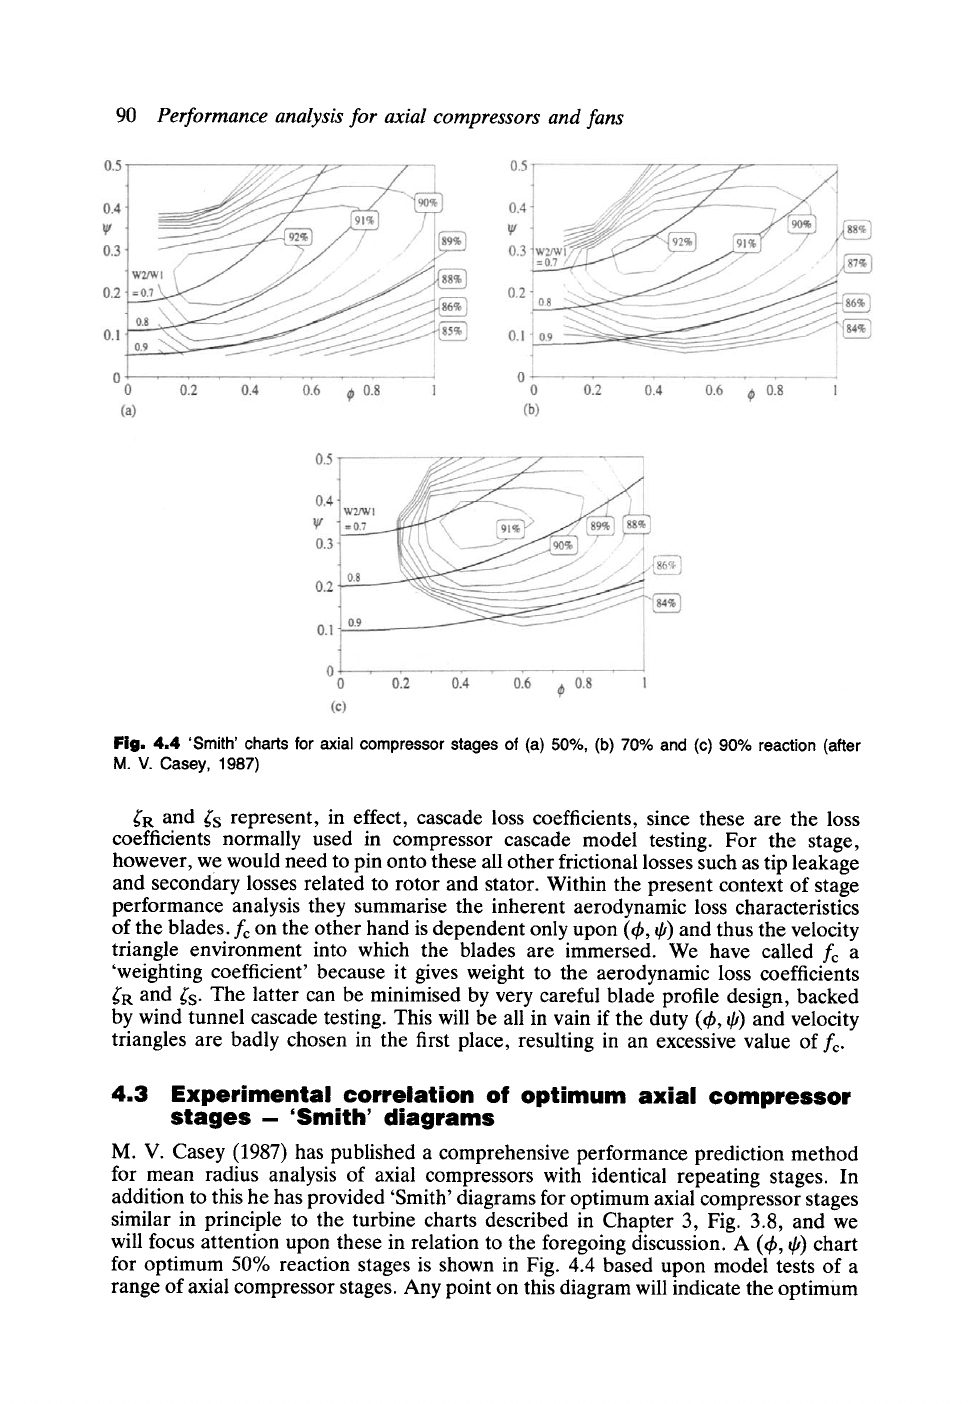
Fig. 4.4 'Smith' charts for axial compressor stages of (a) 50%, (b) 70% and (c) 90% reaction (after
M. V. Casey, 1987)
~'R and ~'s represent, in effect, cascade loss coefficients, since these are the loss
coefficients normally used in compressor cascade model testing. For the stage,
however, we would need to pin onto these all other frictional losses such as tip leakage
and secondary losses related to rotor and stator. Within the present context of stage
performance analysis they summarise the inherent aerodynamic loss characteristics
of the blades, fc on the other hand is dependent only upon (~b, qJ) and thus the velocity
triangle environment into which the blades are immersed. We have called fc a
'weighting coefficient' because it gives weight to the aerodynamic loss coefficients
~'R and srs . The latter can be minimised by very careful blade profile design, backed
by wind tunnel cascade testing. This will be all in vain if the duty (~b, qJ) and velocity
triangles are badly chosen in the first place, resulting in an excessive value of f~.
4.3
Experimental correlation of optimum axial compressor
stages- 'Smith' diagrams
M. V. Casey (1987) has published a comprehensive performance prediction method
for mean radius analysis of axial compressors with identical repeating stages. In
addition to this he has provided 'Smith' diagrams for optimum axial compressor stages
similar in principle to the turbine charts described in Chapter 3, Fig. 3.8, and we
will focus attention upon these in relation to the foregoing discussion. A (~b, qJ) chart
for optimum 50% reaction stages is shown in Fig. 4.4 based upon model tests of a
range of axial compressor stages. Any point on this diagram will indicate the optimum
4.4 Lift and drag coefficients and diffusion factor
91
Table 4.1 Comparison of optimum axial turbine and compressor stages as indicated by the
'Smith' diagrams
q, na-r (%)
Axial turbines 0.6 1.0 94.5
Axial compressors 0.35 0.25 92.5
efficiency likely to be attainable from a well-designed axial compressor matched to
that (t h, q,) duty. Unfortunately the individual tests are not provided on this chart
but efficiency contours have been curve-fitted through the test results, revealing the
strong influence of both 4, and q, upon r/an:.
It is helpful to compare trends with the turbine 'Smith' diagram, Fig. 3.8. For
example, the most efficient machines possible according to these two correlations
would have duty coefficients as shown in Table 4.1.
The effectiveness of a compressor to fulfil its twofold task, as stated in the
introduction to this chapter, may be judged
(a) by the magnitude of ~b, typifying its capacity to move fluid,
(b) by its pressure rise coefficient qJ, typifying its pressure raising capability,
(c) and of course by its efficiency r/an:.
It is clear from the above comparison that the effectiveness of the optimum axial
compressor stage falls far short of that of the optimum axial turbine. The optimum
value of 4, = 0.35 is very low for practical purposes and the suggested work coefficient
q, = 0.25 is but a quarter of that for the optimum axial turbine stage. This is of course
as expected for a turbomachine with diffusing blade rows for the reasons already
discussed in the introduction to this chapter.
However, the efficiency contours of the compressor 'Smith' diagram are quite fiat
so that we could depart some way from the peak efficiency duty point recorded in
Table 4.1 and select efficient compressor stages (e.g. rtrr > 90%) for quite a wide
range of (~b, q,) duties. (The same is of course true for axial turbines as can be seen
from Fig. 3.8 where the bulk of models tested had duty coefficients well in excess
of the optimum.) Thus axial compressor stages with high efficiency and stable flow
may be designed for the more practicable range ~b = 0.5 to 0.9 and with work
coefficients as great as q, = 0.4 to 0.45. We will illustrate this numerically in the next
section after introducing further useful theoretical analysis. To summarise the present
observations based upon Fig. 4.4, the sensible design range for axial compressor
stages lies between the two curves
I/top t =
O. 185
V'4q~ 2 +
1
~max
=
0.32 + 0.2~b
J
(4.20)
4,4
Lift and drag coefficients and diffusion factor
re.expressed in terms of duty coefficients
The key dimensionless parameters that indicate profile aerodynamic quality are the
lift and drag coefficients CL and CD, Eqns (2.2). Various relationships for these were
derived in Chapter 2 for compressor or fan cascades that are useful for the assessment
of aerodynamic performance based upon experimental cascade tests. What matters
92
Performance analysis for axial compressors and fans
in practice is the aerodynamic performance of the blade profiles when located within
the velocity triangle environment of the actual machine. It will be helpful therefore
to re-express CL and CD in terms of the duty parameters (~b, qJ) which we have just
shown to have total control over the shape of the velocity triangles. Lift coefficient
for a cascade was expressed in terms of the relative inflow and outflow angles
fll
and
/32, the vector mean of these, /3o~, and the pitch to chord ratio,
t/l,
as follows:
t
CLoo = 2 7 (tan
fll --
tan f12)
COS floo -- C D
tan/3oo [2.101
But from the dimensionless velocity triangles, Fig. 4.2(b), we have
tan
fll "--
1 +
qJ
2~b
tan
fiE -"
1 - q~
2~b
(4.21)
and hence
1 1
tan/3oo = ~ (tan
fll +
tan 132) = a-;-,
zq~
(4.22)
Introducing these into Eqn (2.10) we thus have the alternative form for CL~ involving
the duty coefficients (th, q0:
(t){ }
CLoo
=
2 7 V'4~ 2 + 1 2th
(4.23)
Let us consider next the drag coefficient
CDoo as
defined by Eqn (2.8):
CDoo ----"
1 2 = ~'oo COS 13oo [2.8]
~pW~I
where the cascade loss coefficient was based on the vector mean velocity Woo,
namely
(Apo)lo
~'== 1 2 [2-91
~pWg
To apply this to our model compressor stage we need to convert to the form of loss
coefficients based on entry velocities, Eqns (4.9d) and (4.9e). From the cascade
analysis in Chapter 2 this would give
, O,lOSS
~'1 = 1 2 =~
~pW1
COSfll )2
= ~'= COS/3=
(4.24)
4.4 Lift and drag coefficients and diffusion factor
93
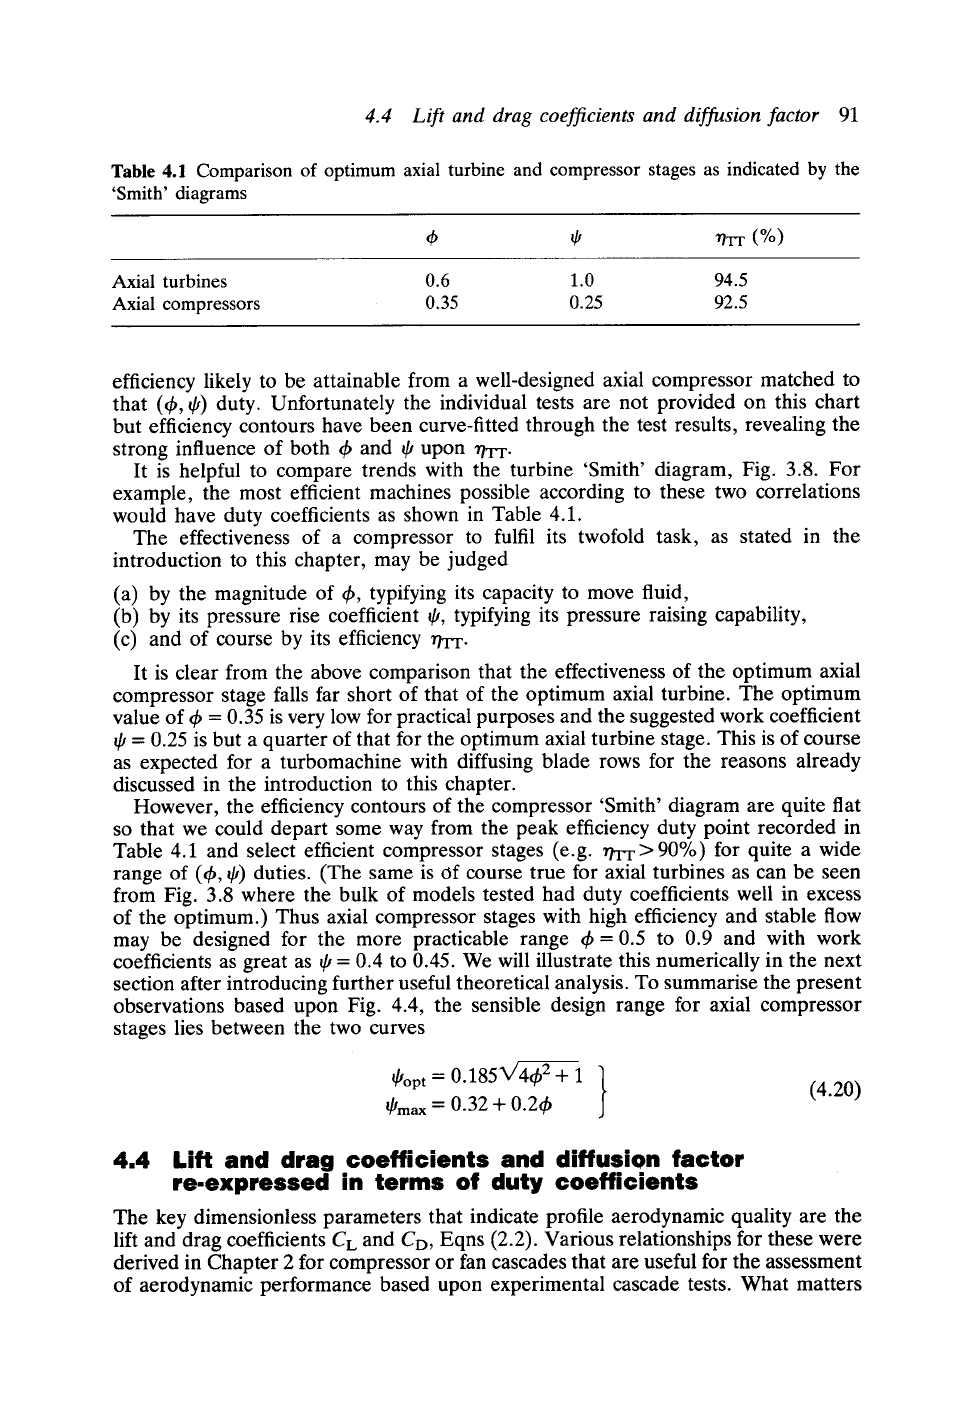
0.5 0.6 ~/~/
= . t/l = 0.9 1.6//
0.4 0.5 1.8"
2.0 /
0.2 0.3
0.1 0.2.
0.3 0.4 0.5 0.6 0.7 0.8 0.9 0.3 0.4 0.5 0.6 0.7 0.8 0.9
(a) ~ (b) r
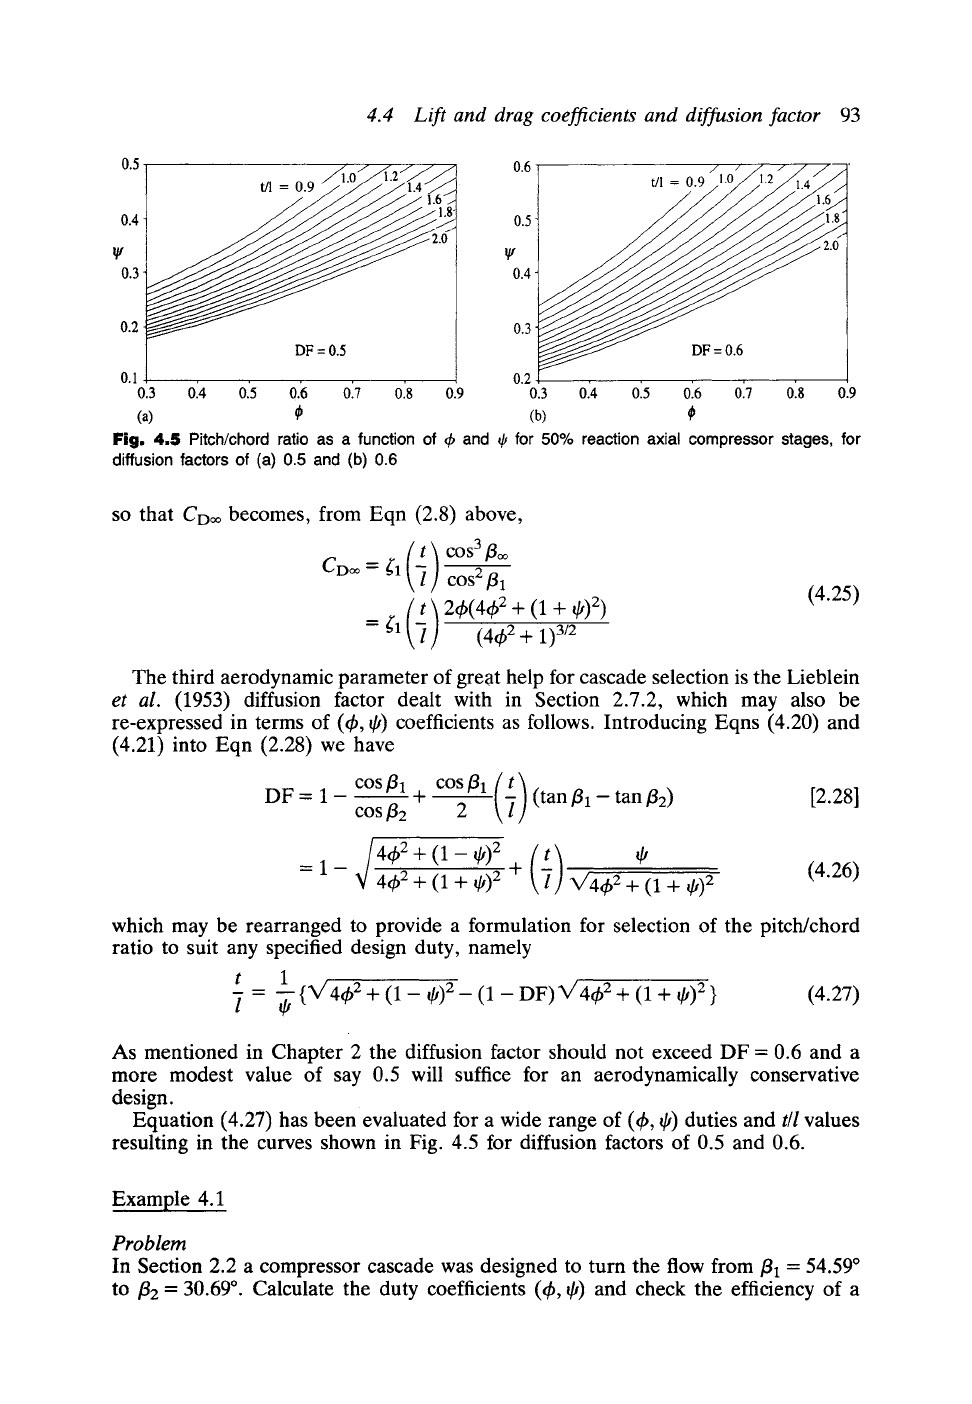
Fig. 4.5
Pitch/chord ratio as a function of 4) and r for 50% reaction axial compressor stages, for
diffusion factors of (a) 0.5 and (b) 0.6
so that CDo~ becomes, from Eqn (2.8) above,
cos3
CD~ = ~'1 COS2 fll
= ~'1 (4~2+ 1)3/2
(4.25)
The third aerodynamic parameter of great help for cascade selection is the Lieblein
et al.
(1953) diffusion factor dealt with in Section 2.7.2, which may also be
re-expressed in terms of (~b, qJ) coefficients as follows. Introducing Eqns (4.20) and
(4.21) into Eqn (2.28) we have
costa (;)
DF = 1
cosfll ~_
(tan
fll --
tan f12) [2.28]
COS fiE
2
: 1_ j40 + 1- + 4.26,
44) 2 + (1 + q~)2 V'44~ 2 + (1 + qO 2
which may be rearranged to provide a formulation for selection of the pitch/chord
ratio to suit any specified design duty, namely
t 1
= -~- { ~/44) 2 + (1 - qj)2 _ (1 - DF) V' 44) 2 + (1 + q0 2 } (4.27)
As mentioned in Chapter 2 the diffusion factor should not exceed DF = 0.6 and a
more modest value of say 0.5 will suffice for an aerodynamically conservative
design.
Equation (4.27) has been evaluated for a wide range of (th, q0 duties and
t/l
values
resulting in the curves shown in Fig. 4.5 for diffusion factors of 0.5 and 0.6.
Example 4.1
Problem
In Section 2.2 a compressor cascade was designed to turn the flow from
~1 --
54.59~
to/32 = 30.69 ~ Calculate the duty coefficients (~b, qJ) and check the efficiency of a