Kim Y.J. (Ed.) Advanced Environmental Monitoring
Подождите немного. Документ загружается.

22 Monitoring of Dissolved Organic Carbon 283
The concentration of dissolved organic carbon (DOC) in the raw water seems to
be the wanted control parameter. The problem is that the general DOC-analysis
setups are not able to monitor the process in a short-time interval and that they
require intensive service due to obligatory analysis gases and chemicals.
The UV–laser induced fluorescence method seems to be a suitable tool to
overcome these problems. The Laser-Laboratorium Göttingen (LLG) and others
(Lewitzka et al. 2004 and literature cited therein) have shown the potential of
this technique for the detection of organic substances like polycyclic aromatic
hydrocarbons (PAH), mineral oil contamination in water and in soil.
In a joint project of the Stadtwerke Düsseldorf AG and the LLG, the potential
of this technique is tested as an online method for the real-time regulation for the
oxidation step in the water purification process (Niederkrüger et al. 2004).
22.2 The LLG-Laserfluorimeter
Over the past few years several different, compact optical analyzing systems
have been developed at the LLG using laser-induced fluorescence (LIF). The
laserfluorimeters are able to acquire nanosecond time-resolved fluorescence
spectra of the organic aromatic substances directly in water after excitation with a
UV laser pulse. This information is used for qualitative and — after suitable
calibration — for quantitative determination of the present organic substances
without any purification or preparation step in-between.
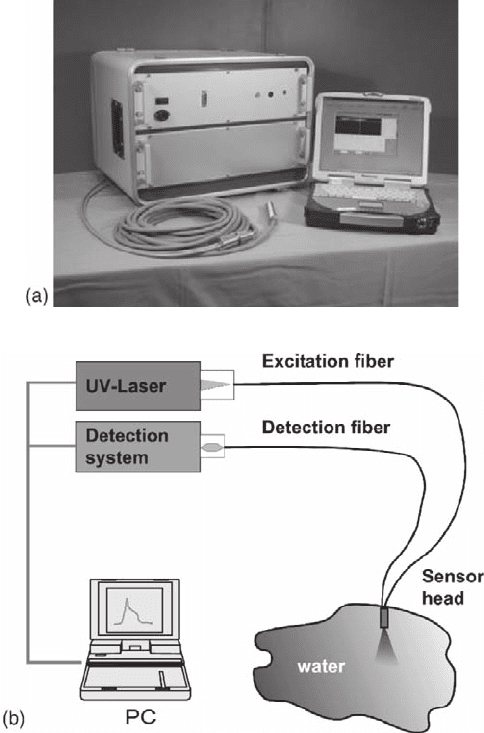
The laserfluorimeter used in this project and its schematic is shown in Fig.
22.1a and b respectively. The mobile system (40 × 40 × 55 cm
3
, weight 30 kg,
electric power supply 12 V/3.5 A) consists of a miniaturized frequency quadru-
pled Nd:YAG-laser emitting UV laser pulses at 266 nm (pulse energy <50 µJ,
pulse width 8 ns, repetition rate 50 Hz). The laser pulses are guided via a quartz
fiber (diameter 600 µm) to the sensor head at the measuring position. Here the
UV-pulses excite the aromatic substances and their fluorescence is collected by
four quartz fibers (diameter 400 µm each) that guide the light to the detection
unit. The geometry of the optical fibers inside the sensor head is optimized for
maximum fluorescence light collection and minimal stray light impact (Bünting
et al. 1999).
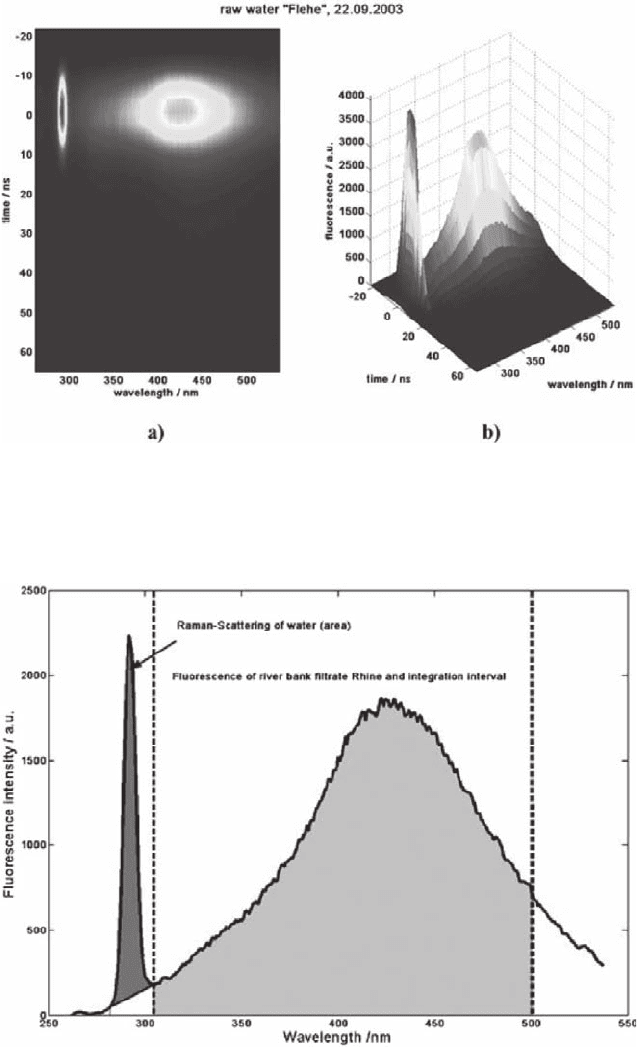
The detection unit is basically an optical multichannel analyzer consisting
of a polychromator, an intensified CCD camera and fast gating electronics
(the details are given in Marowsky et al. 2000 and literature cited therein). The
spectral bandwidth of the system ranges from 260 nm to 540 nm with a spectral
resolution of 7 nm. Single spectra are obtained from a sequence of single-laser
pulses and the software constructs a time-resolved 2D-LIF-spectrum by shifting
the detection gate with respect to the emission time of the laser pulse. Such a
2D-fluorescence spectrum taken from the raw water at the water plant in
Düsseldorf-Flehe is shown in Fig. 22.2.
284 U. Wachsmuth et al.
The device is controlled by proprietary spectrometer software, which addition-
ally allows the validation of the spectra by calibration routines, which can be
deposited in the data base. The result of the analysis can therefore be displayed
directly after the measurement.
22.3 DOC Evaluation by LIF in Bank Filtrates
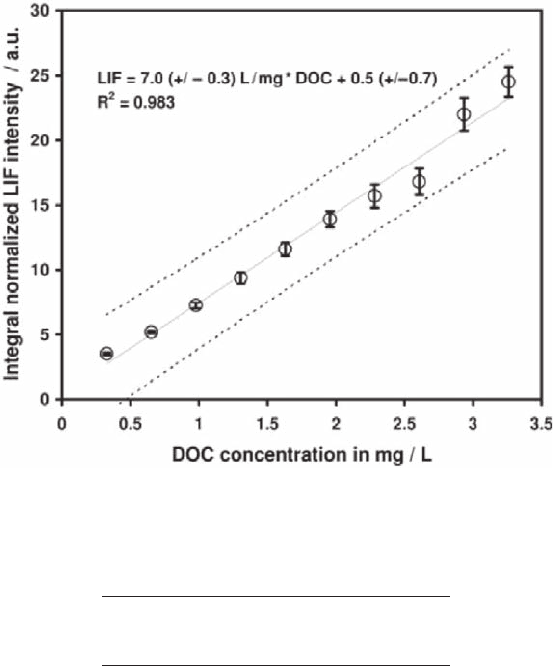
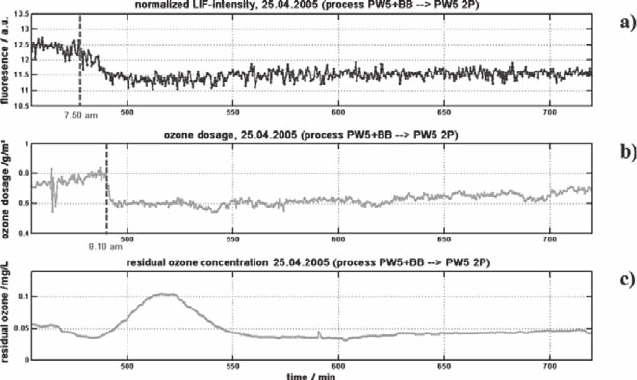
The spectrum shown in Fig. 22.3 is typical for natural water. There are two signals,
which are well distinguishable: The Raman stray light signal due to the OH-symmetric
stretch vibration of water, which shows up at 293 nm as a sharp peak and a relatively
Fig. 22.1 (a) LLG laserfluorimeter, (b) schematic diagram of LLG laserfluorimeter
22 Monitoring of Dissolved Organic Carbon 285
Fig. 22.2 (a) Contour plot and (b) 3D graph of time-resolved fluorescence spectra from a water
specimen from the water plant in Düsseldorf-Flehe
Fig. 22.3 UV-LIF spectra of bank filtrate of river Rhine
286 U. Wachsmuth et al.
broad unstructured fluorescence signal in the range between 300 and 530 nm.
The second signal can be attributed to a mixture of homo- and heterocyclic aromatic
substances, which are formed by the post mortal degradation of organic materials,
generally called humic substances. Humic substances are a mixture of different
fluorophores linked through carbon chains. The best description is probably a not
well-defined natural oligomer in which different fluorophores are incorporated.
Nevertheless, it is well established (e.g. Esteves and Duarte 2001; Baker 2002;
Peuravouri et al. 2002) that humic substances from different geological areas are
distinguishable by their fluorescence spectra.
Generally, not every organic molecule can be detected by fluorescence spectroscopy,
but as long as the origin of the natural organic matter is identical, it is justifiable to
assume that the humic substances are in equilibrium with their non-fluorescing
accompanying materials and a correlation between the fluorescence and the organic
matter content becomes possible.
A calibration on the local conditions should therefore be necessary for generating
good DOC results via fluorescence spectra. In the following the acquired fluo-
rescence spectra are generally called DOC-LIF-spectra. During the investigations
it was realized that all DOC-LIF spectra exhibit a short time profile, so that the time
resolution does not contain further valuable information. Neglecting the time
resolution has another advantage: The acquisition for a mean spectrum (out of 40
single spectra) and data evaluation takes less than 30 s. Figure 22.3 shows the spectral
regions applied for the data evaluation procedure of a typical DOC-LIF spectrum
of raw water. The integral fluorescence intensity is determined in the spectral
region between 300 and 500 nm and subsequently normalized by the area of the
underground corrected Raman-signal. It is obtained by integrating the signal
in the spectral range between 280 to 300 nm and subsequently subtracting the area
of the underlying fluorescence signal, which is estimated by a straight line between
the intensities at 280 and 300 nm. With this underground correction it was easier to
apply the Raman-area for normalization, but there is no difference when applying
the underground corrected peak intensity of the Raman signal for normalization.
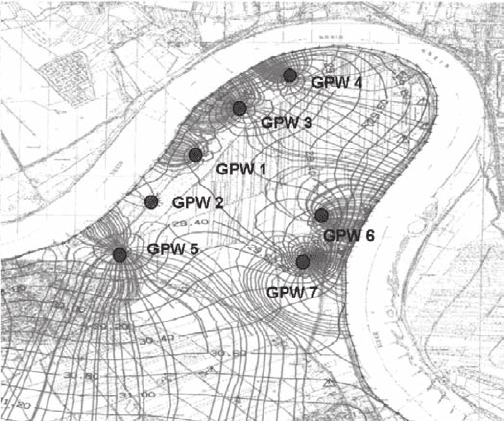
The normalized fluorescence intensity is than plotted versus the classically
determined DOC concentration to result in a calibration function for evaluation of
the fluorescence signals in the process (Fig. 22.4), which can be deposited in the
spectrometer software.
The calibration procedure is as follows: Assuming that the natural organic matter
(NOM) in the Rhine is a good approximation for the NOM in the bank filtrate,
Rhine water was taken and was filtrated over 0.45 µm mesh. The DOC-value for
the filtrated Rhine water was evaluated with the classical method (catalytic oxidation
and infrared detection of CO
2
). This solution served as stock solution. It was diluted
with pure water (after oxidation and filtration [0.45 µm mesh]) for the preparation
of ten equidistant concentration steps for the calibration procedure according to the
German norm DIN 32 645. The DIN standard dictates an unweighted procedure, so
that the error bars in Fig. 22.4 have only informative character. These error bars
have been calculated out of the standard deviation of ten single measurements for
22 Monitoring of Dissolved Organic Carbon 287
a 95% confidence interval assuming a normal distribution. The error of the used
classical DOC determination of the stock solution was estimated to be about 15%.
For clarity this error is not indicated in Fig. 22.4. The lower and upper boundaries
specify the 95% confidence interval evaluated by the calibration procedure according
to DIN 38 402.
As demonstrated in Fig. 22.4, the normalized LIF intensity shows good linearity
with the DOC-values. The slope has a value of seven, which indicates that this new
method is by a factor of seven more sensitive than the classically used one. The
intercept is slightly positive but zero is within the calculated error. Since the
correlation over the investigated region is linear, fluorescence quenching is not
observed. The evaluation of the calibration data according to DIN 32 645 is
summarized in Table 22.1. The decision, detection and determination limits are in
the same magnitude as for the classical methods.
Fig. 22.4 DOC-LIF-calibration for raw water treatment
Table 22.1 Limits according to DIN 32 645, linear
calibration method
Decision limit 0.49 mg/l
Detection limit 0.98 mg/l
Determination limit 1.48 mg/l
288 U. Wachsmuth et al.
22.4 Investigation of Bank Filtrates
The laserfluorimeter was used for two different types of investigations: (a) meas-
urements at seven pumping stations at the area of the sinuosity of the Rhine called
‘Grind’ (Fig. 22.5, position of pumping stations and lines for identical groundwater
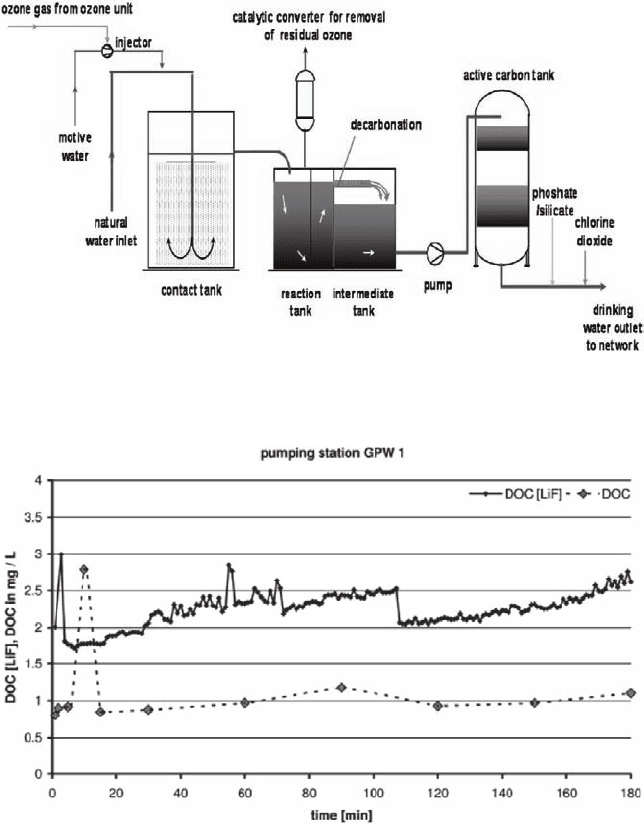
levels) were performed directly at the stations; (b) measurements in front of the
water tank, where the oxidation process (here oxidation by adding ozone) takes
place, were performed directly at the joint natural water inlet from several pumping
stations. Figure 22.6 shows a schematic drawing of the cleaning process used by
the Stadtwerke Düsseldorf AG.
Case (a) The LLG-laserfluorimeter was used as an online system at the pumping
stations as shown in Fig. 22.5 during the start and working phase of water with-
drawal after a stagnancy period for several days. This phase seems to be interesting,
because it is assumed that the quality of the pumped water varies until a steady state
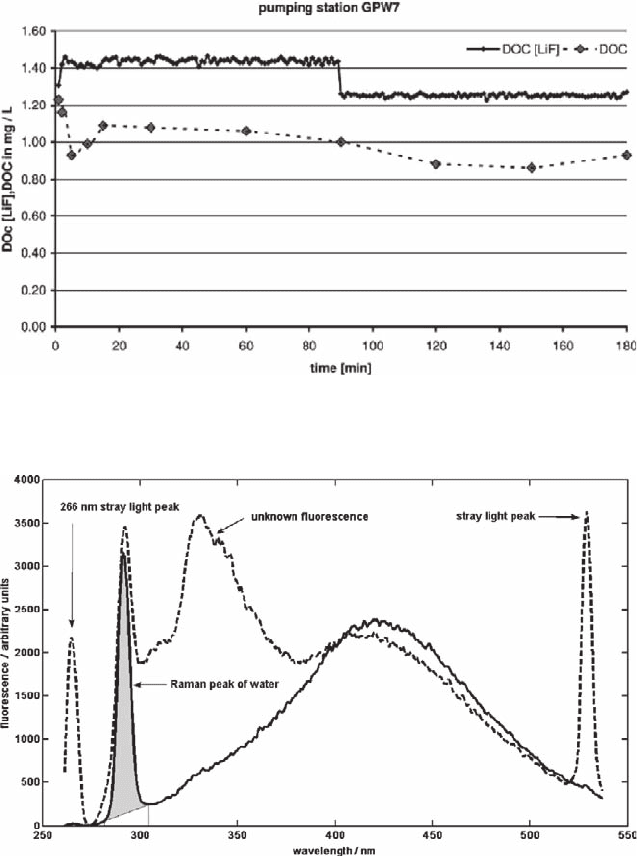
in the ground water of the pumping region is reached. Figures 22.7 and 22.8 show
typical DOC-profiles for the pumping stations at the ‘Grind’ (GPW): The dashed
line is connecting the discrete analyzing results for conventional DOC measurements
(grey diamonds) and the small black diamonds, which represent single values of
continuous online measurements, are the results obtained via LIF spectroscopy
directly. The whole range of measured DOC concentration is quite narrow, but the
change in water quality in three hours for the water of one pumping station is small.
This is the experience of the waterworks at Stadtwerke Düsseldorf AG. In all examples,
the LIF results have been higher in DOC value than the classical results. However,
the trend of the DOC measurements is well reflected in all examples and the
changes in water quality can be followed in real time.
Fig. 22.5 Pumping station on the Grind GPW1 to GPW 7
22 Monitoring of Dissolved Organic Carbon 289
The discrepancy between the two methods can be traced back to two possible
explanations: (a) The DOC determined from the LIF measurements rely on a
calibration of Rhine water humic acids, whereas in this case the humic acids in the
bank filtrate are detected. (b) The raw water was filtered with a mesh of 0.45 µm
pore size for the determination of the classical DOC. These removed small particles
may still contribute to the fluorescence as well, so that the error is systematic over
estimation of the determined DOC. This overestimation is true for all performed
measurements at the Grind. Both (a) and (b) are plausible, but the variation in the
Fig. 22.6 Water cleaning process of the Stadtwerke Düsseldorf AG
Fig. 22.7 Comparison of conventional DOC (solid line) with DOC values determined via
LIF-spectroscopy (dashed line) for pumping station 1 at the Grind
290 U. Wachsmuth et al.
observed spectra between the Rhine and raw waters are small, so this answer
(b) seems to be the more dominant effect.
During the measurements perturbations of the humic substance, spectra have
been noticed. These perturbations manifest themselves in a growing stray light
signal at 266 nm, which allows one to reason the appearance of particles or gas
bubbles in front of the sensor. Figure 22.9 shows such perturbed spectra. On the
Fig. 22.8 Comparison of conventional DOC (dashed line) with DOC values determined via
LIF-spectroscopy (solid line) for pumping station 7 at the Grind
Fig. 22.9 Perturbed fluorescence spectra (dashed), not qualified for DOC-data evaluation,
because of stray light interference and additional fluorescence peak in comparison with
DOC-fluorescence spectrum (solid black line)
22 Monitoring of Dissolved Organic Carbon 291
basis of the spectral information, these measurements can be identified as false and
can be ignored for the determination of the actual DOC-value. The spectral infor-
mation therefore is a valuable tool for the quality of the recorded spectra and for
the decision whether a true or a false spectrum is present.
Case (b) In this case the LLG-laserfluorimeter was placed in the water plant
in Düsseldorf-Flehe directly at the natural water inlet in front of the contact
tank. At this measurement position no perturbations as described before have
been observed. In the contact tank the oxidation process by ozone takes place
(Fig. 22.6). This water cleaning step is necessary to avoid growth of bacteria in
the water supply pipe system and for health reasons. Unfortunately hitherto
there is no parameter to control the oxidation process in advance. In the actual
practiced method, one measures the residual ozone concentration after the
oxidation has taken place. This value is then used for re-adjustment of the
ozone dosage.
The interest of the Stadtwerke Düsseldorf AG is therefore to use the LIF-signal
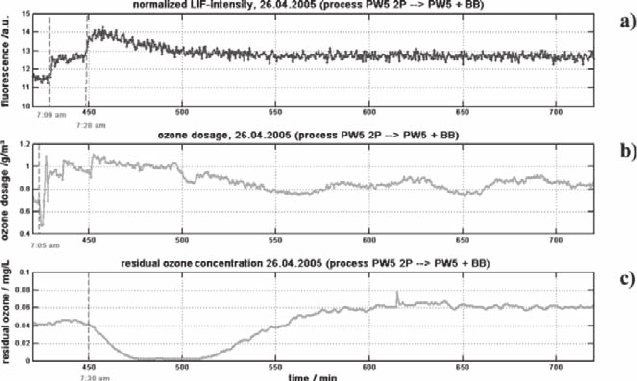
for the prediction of the ozone dosage. Figure 22.10 (a) shows the recorded LIF-signal
over the measurement time. At 7.50 a.m., the raw water from the pumping station
named ‘Brückerbach’ (BB) is replaced by water of pumping station ‘5’ by starting
a second pump (PW5 2P). Water with a higher ozone demand is replaced by water
with a lower ozone consumption, which is clearly seen in the LIF-trace in Fig. 22.10
(a). However, the ozone dosage is reduced by the technician in the control room for
about 20 min (vertical dashed line) after the time indicated by the LIF-signal since
the delay between ozone addition and measurement of the residual ozone concentration
is about 20–30 min due to the mean residence time of the water in the contact tank.
This time delay in adjustment induces a maximum in the residual ozone concentration
Fig. 22.10 Comparison of (a) the LIF-signal to (b) the ozone dosage and (c) the measurement of
residual ozone concentration in the water (25th April 2005)
292 U. Wachsmuth et al.
as seen in Fig. 22.10 (c). High residual ozone concentrations are undesirable because
they enhance the bromate concentration which is legally limited.
In Fig. 22.11, the process of switching the pumping lines back to their former state
is documented. Before 7.09 a.m., the water was delivered from pumping station
PW5 with two pumps. At 7.09 a.m. one pumping line was switched to the pumping
station ‘Brückerbach’ (BB) again. The LIF-signal shows a jump to a higher value,
which is constant for 19 min. The volume pumped during this time can be contributed
to stagnated water in the pipeline between the well and the cleaning facility. Then at
7.28 a.m., freshwater from the well is arriving and the LIF-trace shows a maximum,
which reduces slowly to the constant value registered before again.
In Fig. 22.11 (b) the ozone dosage is depicted. At 7.05 a.m., the ozone generator
is changed (two ozone generators are used for ozone production in an alternating
way). Since the technician in the control room knows by his experience that the
water from pumping station ‘Brückerbach’ has generally higher ozone consumption,
he sets the ozone dosage to a higher value, but in fact, this value was not high
enough and the residual ozone concentration (Fig. 22.11 c) drops to zero. Since the
technician has-up to now-no actual online information about the incoming water
quality, he is not able to recognize the additional maximum peak as it is registered
by the LIF-Signal. He can only adjust the ozone dosage with a time delay of 20–30 min
according to the residual ozone concentration at the exit of the water processing
when the oxidation already has taken place.
In the next step, we have correlated the LIF-signal directly with the ozone dosage
by a very simple two-point calibration. In Fig. 22.12, the results for another run at
the water plant in Düsseldorf-Flehe are depicted: Fig. 22.12 (a) shows again the
Fig. 22.11 Comparison of (a) the LIF-signal to (b) the ozone dosage and (c) the measurement of
residual ozone concentration in the water (26th April 2005)