Kim Y.J. (Ed.) Advanced Environmental Monitoring
Подождите немного. Документ загружается.

21 An Advanced Monitoring and Control System 273
21.2.2 Hydrogen Peroxide Analysis System
The hydrogen peroxide analyzing unit was based on a fluorometric detection
method using the reaction of p-hydroxyphenyl acetic acid and residual hydro-
gen peroxide in the presence of a peroxidase enzyme (Lazrus et al. 1985).
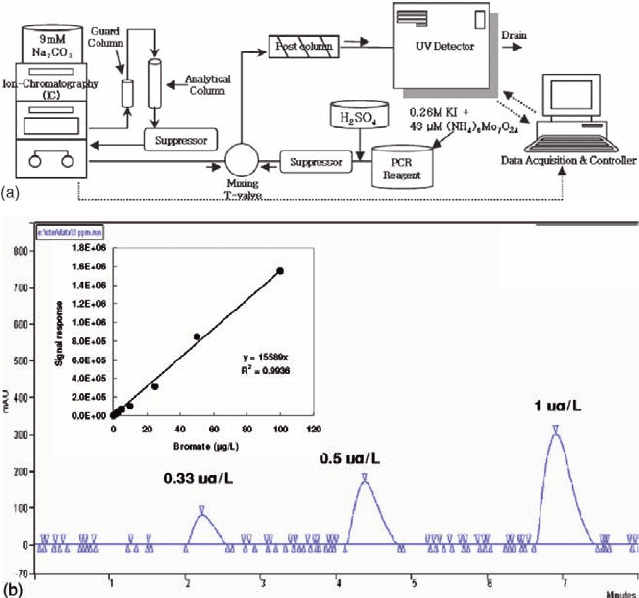
Figure 21.2(a) shows a scheme for the on-line residual peroxide detection sys-
tem, which was carefully devised to exclude interference from ozone. Three DC
drive pumps (Cole-Parmer Peristaltic pump, USA) continuously injected the
following reagents; fluorometric reagent (0.35 M potassium hydrogen phthalate
(KHP), 8.0×10
−3
M p-hydroxyphenyl acetic acid (POPHA), 2 purpurogallin
units of peroxidase/ml reagent), buffered solution (0.5 M NaOH) and the sample,
into the hydrogen peroxide analyzer, with tubing connected to both the inlet
and outlet of the instrument. The POPHA dimer formed in the reaction module
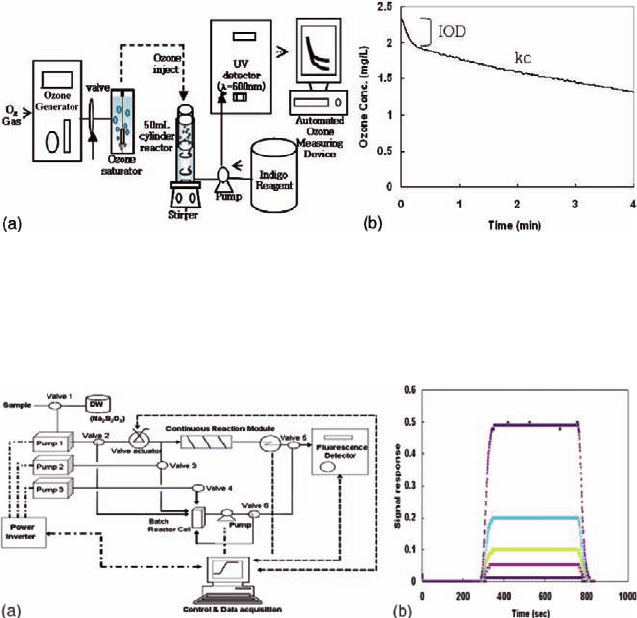
Fig. 21.1 (a) Schematic diagram of the ozone analysis system. (b) Typical ozone decomposition
pattern of ozone in raw water obtained from this setup.
Fig. 21.2 (a) Schematic diagram of the hydrogen peroxide analysis system. (b) Signal response.
274 J.-W. Kang et al.
was stabilized raising pH >10, and analyzed using fluorescence detection
(SOMA, Japan), with excitation and emission at 320 and 400 nm, respectively.
Data signals were converted into actual hydrogen peroxide concentration units
(µg/l), and recorded by a computer system via an interface card (Labview,
USA). Figure 21.2(b) shows the stability and sensitivity of data signal obtained
with this method, which enabled detection to the ∼ppt level (MDL < 1 µg/l)
acquiring two signals per second.
21.2.3 Bromate Analysis System
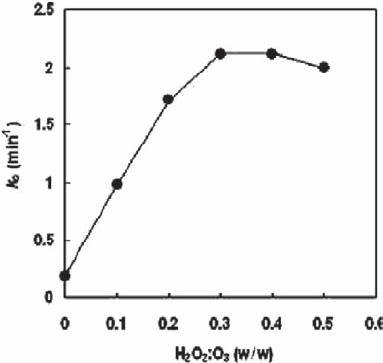
The bromate analysis was based on the EPA 326.0 method, using a suppressor
acidified post-column reagent (Salhi and Gunten 1999). As shown in Fig. 21.3, the
bromate analyzing system was composed of two main parts: ion chromatograph
Fig. 21.3 (a) Schematic diagram of the bromate analysis system. (b) Shapes of the bromate peaks
(MDL <0.3 µg/l)
21 An Advanced Monitoring and Control System 275
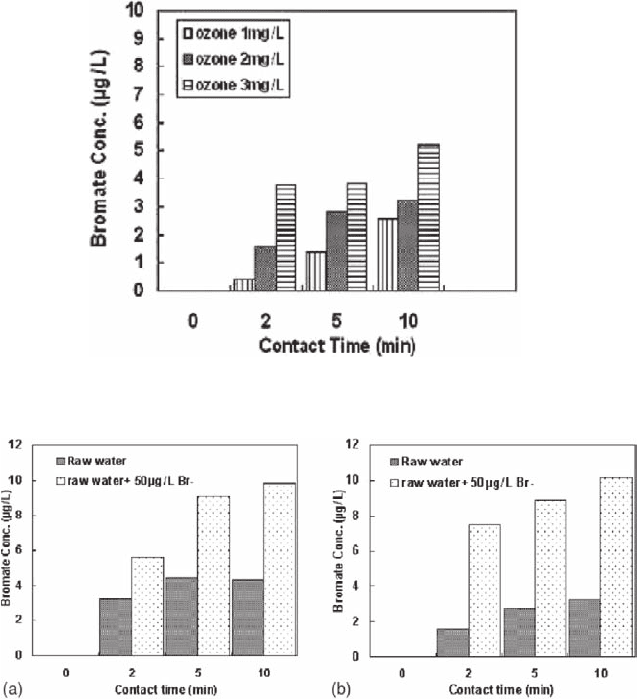
Fig. 21.4 Effect of hydrogen perox-
ide on Ibuprofen removal efficiency.
Initial Ibuprofen: 2 µM. Ozone dose:
2 mg/l, hydrogen peroxide:ozone
ratio = 0 ∼ 0.8 (w/w)
and post-column reaction (PCR). The ion chromatograph system (DX-500, Dionex)
was comprised of a guard column (AS9-HC, Dionex), an analytical column (AG9-
HC, Dionex), a suppressor devices (ASRS-I) and a conductivity detector. The
apparatus for the PCR were composed of a post- column reagent delivery system
(PC-10, Dionex), a heated post-column reaction coil (Dionex) and an ultraviolet/
visible (UV/Vis) detector (Prostar325, Varian). The effluent of bromate ions sepa-
rated by the ion chromatograph mixed with an acidic solution of potassium iodide
containing an ammonium molybdate and heated at 80 ˚C
to form tri-iodide ions,
which were measured by UV/Vis detection at 352 nm. With this setup, bromate
could be precisely detected at levels as low as 0.3 µg/l.
21.3 Results and Discussion
21.3.1 Peroxone Process for the Removal
of Pharmaceuticals
The peroxone process is one of the most effective ways of producing OH• for the
oxidation of micropollutants. The stoichiometric optimum for this reaction is a
hydrogen peroxide:ozone ratio of 0.5 (mole: mole) or 0.35 (weight: weight), but
since other ozone-consuming species are usually present in water, the required dose
ratio is usually less than this value. In fact, the actual ratio is to be directly
determined with experimental studies. Figure 21.4 shows the effect of hydrogen
peroxide on the percentage of the substrate removed; the optimum hydrogen perox-
ide:ozone ratio was 0.3 (w/w).
276 J.-W. Kang et al.
21.3.2 Bromate Formation Characteristics in Ozone Alone
For the future application of ozone, the characteristics of bromate formation during
ozonation were studied by testing water samples collected from six different water
treatment plants located in Korea. With ozone doses of 1 ∼ 2 mg/l, the formation of
bromate ranged between 2 and 12 µg/l, which in some cases exceeded the MCL
(= 10 µg/l). The level of bromide in the water samples tested were relatively low (11
∼ 42 µg/l), but the conversion rate of bromide to bromate appears to be high under
certain conditions. The key factors that could increase the production of bromate
are the ozone doses (Fig. 21.5), bromide level (Fig. 21.6), and pH. Increasing
the ozone dose from 1 to 3 mg/l and the contact time from 2 to 10 min, the level of
Fig. 21.5 Effect of ozone dose and contact time on the formation of bromate. pH: 7.2. Br
−
: 40 µg/l
Fig. 21.6 Effect of contact time and bromide level on the formation of bromate. (a) Ozone dose:
2 mg/l. pH: 7.0. Initial Br
−
: 40 µg/l. (b) Ozone dose: 2 mg/l. pH: 7.6. initial Br
−
: 14 µg/l
21 An Advanced Monitoring and Control System 277
bromate formation was found to increase from 0.4 to 5.2 µg/l (Fig. 21.5). Figure 21.6
compares the effect of the bromide level on the formation of bromate in the two
different raw water sources with that of raw waters collected from S and M water
treatment plants. In each raw water sample, 50 µg/l of bromide was intentionally
added and ozonated. In results, about twofold increase of bromate formation was
observed in the bromide spiked water as compared to the case in raw water. The
effect of pH was found to be the most significant factor affecting the formation of
bromate. Increasing the pH from 7 to 8.5, the conversion yield (%) of bromate was
increased from 6.8 to 58%, far exceeding the MCL guideline (data not shown).
21.3.3 Characteristics of Bromate Formation
in the Peroxone Process
The peroxone process has been proved to enhance the degradation of various
micropollutants by converting aqueous ozone into the more reactive OH•. However,
the formation of bromate cannot be avoided as OH• is also strongly involved in the
peroxone process, bromate could also be formed, as the amount of molecular ozone
would be small, but would still be involved in the bromate formation pathways. In
this process, less ozone would be utilized in the formation of bromate due to its
competitive reaction with the conjugate base of H
2
O
2
(O
3
+ HO
2
−
→ O
3
−•
+ HO
2
•
);
therefore, less bromate production would expected in the peroxone process.
However, the opposite was observed in our experiments. With regard to the effect
of hydrogen peroxide on the formation of bromate in the peroxone process, the
results reported in a reference survey were inconsistent (Gunten et al. 1988).
Furthermore, it is hard to assess the effect of hydrogen peroxide on the formation
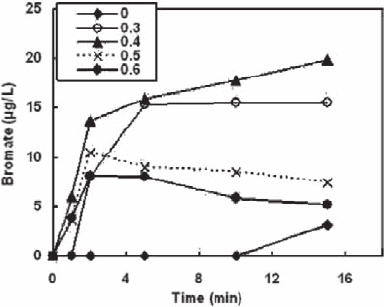
of bromate without performing experimentation. Figure 21.7 shows the bromate
formation profiles vs. contact time for a raw water initially spiked with bromide
(= 100 µg/l) by varying the hydrogen peroxide dose between 0 and 0.6 (w/w), with
Fig. 21.7 Effect of hydrogen perox-
ide on the rate of bromate formation.
Ozone: 2 mg/l. pH: 7.0. Br
−
: 100 µg/l
278 J.-W. Kang et al.
the ozone dose fixed at 2 mg/l. On the addition of hydrogen peroxide, the observed
level of bromate production compared to ozone alone was much higher. The highest
level of bromate production was observed with a hydrogen peroxide:ozone ratio
(w/w) of 0.4, but the rate of bromate production decreased with a ratio of 0.5, which
is the desired peroxide dose for the control of bromate.
21.3.4 Scheme for Oxidant Dosage Control in the Ozone
and Peroxone Processes for the Control of Bromate Formation
A real-time method for the effective control of ozone and hydrogen peroxide dosages
has been developed, based on a specifically devised analytical setup, as previously
shown (Fig. 21.1 and 2), and an optimum ozone dosage control method proposed
(Oh et al. 2003; Oh et al. 2005). This control method achieved both the required dis-
infection and oxidation objectives. For the purpose of disinfection, ozone was dosed
to the corresponding CT (C: residual disinfectant concentration (mg/l); T: contact
time [min]) criteria required to meet the target inactivation goal. With respect to the
oxidation objectives, which have recently increased in emphasis due to the contami-
nation of water by various toxic chemicals, ozone was dosed to take into account the
yield of the more reactive species, OH•, by measuring the ozone decay rate constant,
k
c
, and R
ct
value (ratio of the OH• to residual ozone). For this purpose, the kCT-control
method, which optimizes the ozone dosage on a real-time basis (Oh et al. 2003), is to
be further developed and utilized to achieve the target water treatment objectives, the
oxidation and/or disinfection goal. The kCT is defined as
kCT O dt=
∫
[]
3
where, kCT is the area under the curve for the time varied residual ozone concen-
tration (Fig. 21.1(b) to be precisely measured by the setup, as shown in Fig. 21.1
(a). The k
c
value varies according to variations in the water quality, but could be
continuously monitored by the automated real time monitoring/control system,
and the amount of ozone adjusted to the set kCT value. The recommended target
value, which was tested in a prior study on H river water, was 2 ∼ 3 mg/l-min
(Oh et al. 2003).
Since the oxidation of toxic micropollutants, such as pesticides and pharmaceuti-
cals, and taste and order causing compounds, has now become a more centered issue
in water treatment, several municipal drinking water treatment plants that used ozone
have now been converted to the peroxone process by the addition of a hydrogen per-
oxide feeding system. In this process, the control of the optimum hydrogen peroxide
dose is regarded as an important factor in the optimization of the process. The stoi-
chiometric optimum for the reaction between ozone and hydrogen peroxide is a
hydrogen peroxide:ozone ratio of 0.35 (w/w), but due to other demands on ozone or
reacted compounds usually present in water, the required dose ratio would usually be
less, but this can be determined experimentally. The kCT analytical devise enables
21 An Advanced Monitoring and Control System 279
calculation of the optimum hydrogen peroxide dosage based on the measured resid-
ual ozone, which is controlled by the set kCT value. Figure 21.8 shows the residual
ozone output obtained with the input kCT set at 2 mg/l-min vs. the calculated hydro-
gen peroxide dosage. The residual ozone output response to the set kCT was ∼0.35.
In a previous study, the recommended hydrogen peroxide dose was a hydrogen per-
oxide:ozone (w/w) ratio of 0.5, which corresponds to a hydrogen peroxide dose of
Fig. 21.8 Optimum oxidant dose control for the peroxone process using the kCT control method
Fig. 21.9 Optimum process control logic to meet bromate MCL in ozone and peroxone AOPs
280 J.-W. Kang et al.
0.16 ∼ 0.18 mg/l, as shown in Fig. 21.7. With this kCT based peroxide dose control,
the bromate production could be successfully suppressed below the MCL guide line
(10 µg/l). Figure 21.9 shows the flow chart of the kCT based control logic for the
determination of the dosages of ozone and hydrogen peroxide to meet the bromate
MCL guideline. The overall control system incorporated with the specifically-
conceived analytical devices and a control unit was able to attain the best water
treatment objectives for minimizing the formation of bromate.
21.4 Conclusion
The following conclusions were drawn from this study:
1) Online monitoring devices for the analyses of residual ozone and hydrogen
peroxide were devised, not only for real time monitoring, but also for optimum
dosage control.
2) The online monitoring device for the key ozone related by-product, bromate, was
also devised, and was able to detect bromate at a level as low as 0.3 µg/l.
3) For the future application of ozone and ozone related AOPs, the characteristics
of bromate formation have been studied. Even at low bromide levels, the conver-
sion rate of bromide to bromate could be high, but this will depend on fluctua-
tion in the water quality.
4) In the peroxone process, the formation of bromate was sensitive to the change in
the hydrogen peroxide:ozone ratio. At a ratio of 0.5 (w/w), the minimum
bromate formation was attained.
5) The overall control system, incorporated with the specifically conceived analyti-
cal devices and control logic, could attain the best water treatment objectives,
with the suppression of the formation of the harmful by-product, bromate.
Acknowdegements This subject was supported by Ministry of Environment as “The Eco-technopia
21 project,” and also by “The Brain Korea 21 project (BK21)” of Ministry of Education & Human
Resource Development.
References
Amtsblatt der Euopäischen Gemeinschaften L 330: Richtlinie 98/83/EG, 1998.
Buffle M-O., Galli S., and von Gunten U. (2004), Enhanced bromate control during ozonation:
The chlorine-ammonia process, Environ. Sci. Technol., 38, 5187–5195.
Duguet J.P., Brodard E., Dussert B., and Mallevialle J. (1985), Improvement in the effectiveness
of ozonation of drinking water through the use of hydrogen peroxide, Ozone Sci. Eng.,
7, 241–258.
Hoigné J. and Bader H. (1981), Determination of ozone in water by the indigo method, Water Res.,
15, 449–456.
21 An Advanced Monitoring and Control System 281
Lazrus A.L., Kok G.L., Gitlin S.N., Lind J.A., and Mclaren S.E. (1985), Automated fluorometric
method for hydrogen peroxide in atmospheric precipitation, Anal. Chem., 57, 917–922.
Oh B.S., Kim K.S., Kang M.G., Oh H.J., and Kang J.W. (2005), Kinetic study and optimum con-
trol of the ozone/UV process measuring hydrogen peroxide formed in-situ, Ozone Sci. Eng.,
27, 421–430.
Oh H.J., Kim W.J., Choi J.S. Gee C.S. Hwang T.M., Kang J.G. and Kang J.W. (2003), Optimization
and control of ozonation plant using raw water characterization method, Ozone Sci. Eng.,
25, 383–392.
Park H.S. Hwang T.M., Kang J.W., Choi H.C., and Oh H.J. (2000), Characterization of raw water
for the ozone application measuring ozone consumption rate, Water Res., 35, 2607–2614.
Staehelin J. and Hoigné J. (1982), Decomposition of ozone in water: Rate of initiation by
hydroxide ions and hydrogen peroxide, Environ. Sci. Technol., 16, 676–681.
Salhi E. and von Gunten U. (1999), Simultaneous determination of bromide, bromate and nitrate
in low µgl
−1
levels by ion chromatography without sample pretreatment, Water Res.,
33, 3239–3244.
USEPA, Fed. Resist. (1994) National primary drinking water regulations; disinfectants and disin-
fection byproducts; proposed rule59:145:38668.
von Gunten U., Bruchet A., and Costentin E. (1988), Bromate formation in conventional and
advanced oxidation processes (O
3
/H
2
O
2
): Theoretical and empirical evaluation of full-scale
experiments, J. Am. Water Works Assoc., 88, 53–65.

Chapter 22
Monitoring of Dissolved Organic Carbon
(DOC) in a Water Treatment Process
by UV-Laser Induced Fluorescence
Uwe Wachsmuth
1
, Matthias Niederkrüger
2
, Gerd Marowsky
2
,
Norbert Konradt
3
, and Hans-Peter Rohns
3
Abstract Results of online investigations of water quality during a water treatment
process by ultraviolet-laser-induced fl uorescence (UV-LIF) are presented. In the
fi rst part the integrated fl uorescence intensity is correlated to the classically deter-
mined concentration of dissolved organic carbon (DOC). Decision, detection and
determination limits are evaluated for this procedure and online DOC measure-
ments conducted with the presented LIF system are compared to reference analysis.
In the second part the ozone demand in the water treatment process is derived from
the LIF-signal directly. The calibration was done by correlating LIF-signals with
the ozone doses for different conditions and a defi nite residual ozone concentration
in the processed water.
Keywords: Dissolved organic carbon (DOC), drinking water, laser induced
fluorescence, online process control, real-time measurements
22.1 Introduction
Large cities situated at big streams often fulfill their demand of drinking water from
these streams. Often the water is not obtained from the river directly, but after natu-
ral filtering from the river banks. This raw water is still enriched with aromatic
organic substances which have to be removed to avoid the growth of bacteria in the
water supply pipe systems and for health reasons. In water treatment processes, this
is often realized by oxidation of the aromatic components and by additional
filtering of the hydrophilic reaction derivates on active carbon. The amount of the
oxidant added to the raw water is controlled by the residual concentration of this
substance after the process.
1
Laser-Laboratorium Göttingen GmbH, Hans-Adolf-Krebs-Weg 1, 37077 Göttingen, Germany
2
Laser-Laboratorium Göttingen e.V., Hans-Adolf-Krebs-Weg 1, 37077 Göttingen, Germany
3
Stadtwerke Düsseldorf AG, Qualitätsüberwachung Wasser (OE 423), Postfach 101136, 40002
Düsseldorf, Germany
282
Y.J. Kim and U. Platt (eds.), Advanced Environmental Monitoring,
282–294.
© Springer 2008