Jackson S.L. Research Methods and Statistics: A Critical Thinking Approach
Подождите немного. Документ загружается.

232
■ ■
CHAPTER 9
0
5
10
15
20
25
MassedSpaced
Type of Study
Items Answered Correctly
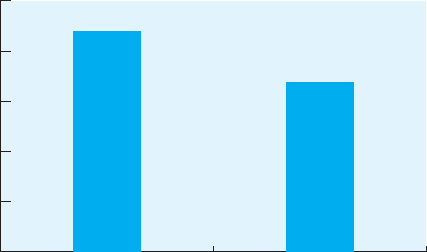
FIGURE 9.2
Mean number of
items answered
correctly under
spaced and massed
study conditions
estimate of the effect of the independent variable, regardless of sample size.
The larger the effect size, the more consistent is the influence of the inde-
pendent variable. In other words, the greater the effect size, the more that
knowing the conditions of the independent variable improves our accuracy
in predicting participants’ scores on the dependent variable. For the t test,
one formula for effect size, know as Cohen’s d, is
d
X
1
X
2
_________
______
s
1
2
__
2
s
2
2
__
2
Let’s begin by working on the denominator, using the data from the spaced
versus massed study experiment:
______
s
1
2
__
2
s
2
2
__
2
___________
4.44
____
2
6.32
____
2
__________
2.22 3.16
____
5.38 2.32
We can now put this denominator into the formula for Cohen’s d:
d
22 16.9
_________
2.32
5.1
____
2.32
2.198
According to Cohen (1988, 1992), a small effect size is one of at least 0.20,
a medium effect size is at least 0.50, and a large effect size is at least 0.80.
Obviously, our effect size of 2.198 is far greater than 0.80, indicating a very
large effect size (most likely a result of using fabricated data). Using APA
style, we report that the effect size estimated with Cohen’s d is 2.198, or you
can report Cohen’s d with the t-score in the following manner:
t(18) 4.92, p .05 (one-tailed), d 2.198
In addition to Cohen’s d, we can also measure effect size for the
independent-groups t test using r
2
. You might remember using r
2
in Chap-
ter 6 as the coefficient of determination for the Pearson product-moment cor-
relation coefficient. Just as in Chapter 6, r
2
tells us how much of the variance in
one variable can be determined from its relationship with the other variable.
Cohen’s d An inferential sta-
tistic for measuring effect size.
Cohen’s d An inferential sta-
tistic for measuring effect size.
10017_09_ch9_p225-255.indd 232 2/1/08 1:28:48 PM
Inferential Statistics: Two-Group Designs
■ ■
233
However, unlike using r
2
with correlation coefficents (which measure two
dependent variables), when we use it with the t test (based on experimental
designs with one dependent and one independent variable), we are measur-
ing the proportion of variance accounted for in the dependent variable based
on knowing which treatment group the participants were assigned to for the
independent variable. To calculate r
2,
use the following formula:
r
2
t
2
______
t
2
df
Thus, in our example this would be
r
2
4.92
2
_________
4.92
2
18
24.21
__________
24.21 18
24.21
_____
42.21
.57
According to Cohen (1988), if r
2
is .01, the effect size is small; if it is .09,
it is medium; and if it is .25, it is large. Thus, our effect size based on r
2
is
large—just as it was when we used Cohen’s d.
The preceding example illustrates a t test for independent groups with
equal n values (sample sizes). In situations where the n values are unequal,
a modified version of the previous formula is used. If you need this formula,
you can find it in more advanced undergraduate statistics texts.
Confidence Intervals. As with the single-sample z test and t test discussed
in Chapter 7, we can also compute confidence intervals for the indpendent-
groups t test. We use the same basic formula we did for computing confi-
dence intervals for the single-sample t test in Chapter 7, except that rather
than using the sample mean and the standard error of the mean, we use
the difference between the means and the standard error of the difference
between means. The formula for the 95% confidence interval would be
CI
.95
X
1
X
2
± t
cv
s
X
1
–
X
2
We have already calculated the means for the two study conditions
(
X
1
and
X
2
) and the standard error of the difference between means ( s
X
1
X
2
)
as part of the previous t test problem. Thus, we simply need to determine
t
cv
to complete the confidence interval, which should contain the difference
between the means for the two conditions. Because we are determining a
95% confidence interval, we use t
cv
at the .05 level, and just as in Chapter 7,
we always use the t
cv
for a two-tailed test because we are determining a
confidence interval that contains values both above and below the differ-
ence between the means. Consulting Table A.3 in Appendix A for the t
cv
for
18 degrees of freedom and a two-tailed test, we find that it is 2.101. We can
now determine the 95% confidence interval for this problem.
CI
.95
22 16.9 ± 2.101(1.037)
5.1 ± 2.18
2.92 7.28
Thus, the 95% confidence interval that should contain the difference in mean
test scores between the spaced and the massed groups is 2.92 7.28. This
10017_09_ch9_p225-255.indd 233 2/1/08 1:28:49 PM
234
■ ■
CHAPTER 9
means that if someone asked us how big a difference study type makes on
test performance, we could answer that we are 95% confident that the differ-
ence in performance on the 30-item test between the spaced versus massed
study groups would be between 2.92 and 7.28 correct answers.
Assumptions of the Independent-Groups t Test. The assumptions of the
independent-groups t test are similar to those of the single-sample t test.
They are as follows:
• The data are interval-ratio scale.
• The underlying distributions are bell-shaped.
• The observations are independent.
• If we could compute the true variance of the population represented
by each sample, the variances in each population would be the same,
which is called homogeneity of variance.
If any of these assumptions is violated, it is appropriate to use another
statistic. For example, if the scale of measurement is not interval-ratio or if
the underlying distribution is not bell-shaped, then it may be more appro-
priate to use a nonparametric statistic (described later in this chapter). If the
observations are not independent, then it is appropriate to use a statistic for
within- or matched-participants designs (described next).
t Test for Correlated Groups: What It Is and What It Does
The correlated-groups t test, like the previously discussed t test, compares the
means of participants in two groups. In this case, however, the same people
are used in each group (a within-participants design) or different partici-
pants are matched between groups (a matched-participants design). The test
indicates whether there is a difference in the sample means and whether this
difference is greater than would be expected based on chance. In a correlated-
groups design, the sample includes two scores for each person, instead of
just one. To conduct the t test for correlated groups (also called the t test for
dependent groups or samples), we must convert the two scores for each per-
son into one score. That is, we compute a difference score for each person by
subtracting one score from the other for that person (or for the two individu-
als in a matched pair). Although this may sound confusing, the dependent-
groups t test is actually easier to compute than the independent-groups t test.
The two samples are related, so the analysis becomes easier because we work
with pairs of scores. The null hypothesis is that there is no difference between
the two scores; that is, a person’s score in one condition is the same as that (or
a matched) person’s score in the second condition. The alternative hypothesis
is that there is a difference between the paired scores—that the individuals (or
matched pairs) performed differently in each condition.
To illustrate the use of the correlated-groups t test, imagine that we
conduct a study in which participants are asked to learn two lists of words.
One list is composed of 20 concrete words (for example, desk, lamp, bus);
the other is 20 abstract words (for example, love, hate, deity). Each partici-
pant is tested twice, once in each condition. (Think back to the discussion
correlated-groups t test
A parametric inferential test
used to compare the means of
two related (within- or matched-
participants) samples.
correlated-groups t test
A parametric inferential test
used to compare the means of
two related (within- or matched-
participants) samples.
10017_09_ch9_p225-255.indd 234 2/1/08 1:28:49 PM

Inferential Statistics: Two-Group Designs
■ ■
235
of weaknesses in within-participants designs from the previous chapter,
and identify how you would control for practice and fatigue effects in this
study.)
Because each participant provides one pair of scores, a correlated-groups
t test is the appropriate way to compare the means of the two conditions. We
expect to find that recall performance is better for the concrete words. Thus,
the null hypothesis is
H
0
:
1
2
0
and the alternative hypothesis is
H
a
:
1
2
0
representing a one-tailed test of the null hypothesis.
To better understand the correlated-groups t test, consider the sampling
distribution for the test. This is a sampling distribution of the differences
between pairs of sample means. Imagine the population of people who must
recall abstract words versus the population of people who must recall con-
crete words. Further, imagine that samples of eight participants are chosen
(the eight participants in each individual sample come from one popula-
tion), and each sample’s mean score in the abstract condition is subtracted
from the mean score in the concrete condition. We do this repeatedly until
the entire population has been sampled. If the null hypothesis is true, the
differences between the sample means should be zero, or very close to zero.
If, as the researcher suspects, participants remember more concrete words
than abstract words, the difference between the sample means should be
significantly greater than zero.
The data representing each participant’s performance are presented
in Table 9.2. Notice that we have two sets of scores, one for the concrete
word list and one for the abstract list. The calculations for the correlated-
groups t test involve transforming the two sets of scores into one set by
determining difference scores. Difference scores represent the difference
difference scores Scores
representing the difference
between participants’ perform-
ance in one condition and
their performance in a second
condition.
difference scores Scores
representing the difference
between participants’ perform-
ance in one condition and
their performance in a second
condition.
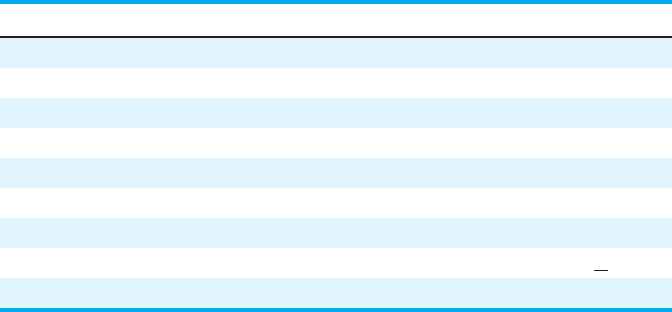
TABLE 9.2 Numbers of Abstract and Concrete Words Recalled by Each
Participant Using a Correlated-Groups (Within-Participants) Design
PARTICIPANT CONCRETE ABSTRACT
1 13 10
2 11 9
3 19 13
4 13 12
5 15 11
6 10 8
7 12 10
8 13 13
10017_09_ch9_p225-255.indd 235 2/1/08 1:28:49 PM
236
■ ■
CHAPTER 9
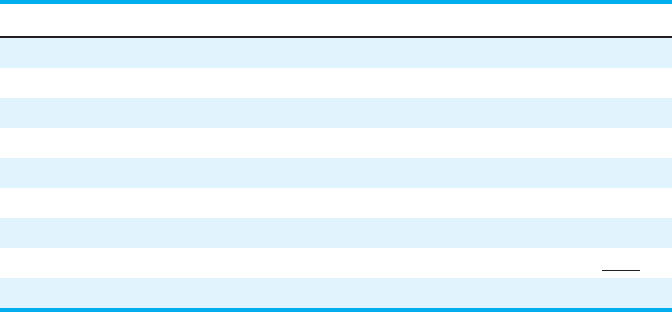
TABLE 9.3 Numbers of Concrete and Abstract Words Recalled by Each
Participant, with Difference Scores
PARTICIPANT CONCRETE ABSTRACT D (DIFFERENCE SCORE)
1 13 10 3
2 11 9 2
3 19 13 6
4 13 12 1
5 15 11 4
6 10 8 2
7 12 10 2
8 13 13 0
20
between participants’ performance in one condition and their perform-
ance in the other condition. The difference scores for our study are shown
in Table 9.3.
Calculations for the Correlated-Groups t Test. After calculating the dif-
ference scores, we have one set of scores representing the performance of
participants in both conditions. We can now compare the mean of the differ-
ence scores with zero (based on the null hypothesis stated previously). The
computations from this point on for the dependent-groups t test are similar
to those for the single-sample t test in Chapter 7:
t
D 0
______
s
D
where
D mean of the difference scores
s
D
standard error of the difference scores
The standard error of the difference scores ( s
D
) is the standard deviation of
the sampling distribution of mean differences between dependent samples
in an experiment with two conditions. It is calculated in a similar manner
to the estimated standard error of the mean ( s
X
) that you learned how to
calculate in Chapter 7:
s
D
s
D
____
__
N
where s
D
is the unbiased estimator of the standard deviation of the difference
scores. The standard deviation of the difference scores is calculated in the
same manner as the standard deviation for any set of scores:
s
D
__________
(D
D )
2
__________
N 1
standard error of the differ-
ence scores The standard
deviation of the sampling
distribution of mean differences
between dependent samples in
a two-group experiment.
standard error of the differ-
ence scores The standard
deviation of the sampling
distribution of mean differences
between dependent samples in
a two-group experiment.
10017_09_ch9_p225-255.indd 236 2/1/08 1:28:50 PM
Inferential Statistics: Two-Group Designs
■ ■
237
Or if you prefer, you may use the computational formula for the standard
deviation:
s
D
____________
D
2
(D)
2
______
N
____________
N 1
Let’s use the definitional formula to determine s
D
, s
D
, and the final
t-score. We begin by determining the mean of the difference scores (
D ),
which is 20/8 2.5, and then use this to determine the difference scores, the
squared difference scores, and the sum of the squared difference scores as
shown in Table 9.4. We then use this sum (24) to determine s
D
:
s
D
___
24
___
7
_____
3.429 1.85
Next, we use the standard deviation (s
D
1.85) to calculate the standard
error of the difference scores ( s
D
):
s
D
s
D
____
__
N
1.85
____
__
8
1.85
____
2.83
0.65
Finally, we use the standard error of the difference scores ( s
D
0.65) and the
mean of the difference scores (2.5) in the t-test formula:
t
D 0
______
s
D
2.5 0
_______
0.65
2.5
____
0.65
3.85
Interpreting the Correlated-Groups t Test and Graphing the Means. The
degrees of freedom for a correlated-groups t test are equal to N 1—in this
case, 8 1 7. We can use Table A.3 in Appendix A to determine t
cv
for a
one-tailed test with .05 and 7 df. We find that t
cv
1.895. Our t
obt
3.85
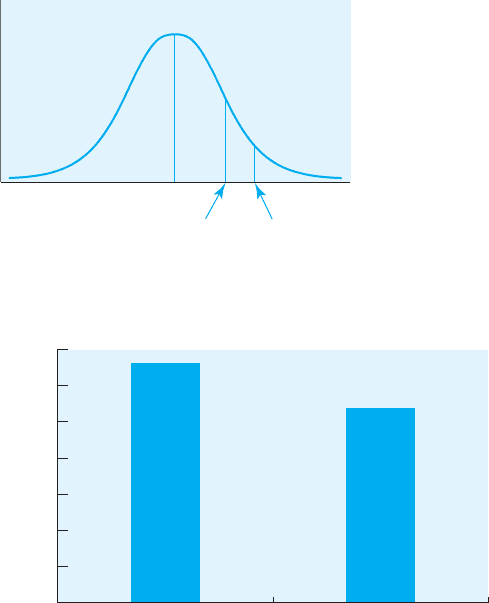
and therefore falls in the region of rejection. Figure 9.3 shows this t
obt
in rela-
tion to t
cv
. In APA style, this is reported as t(7) = 3.85, p .05 (one-tailed),
TABLE 9.4 Difference Scores and Squared Difference Scores for Numbers
of Concrete and Abstract Words Recalled
D (DIFFERENCE SCORE) D
D (D
D )
2
3 0.5 0.25
2 0.5 0.25
6 3.5 12.25
1 1.5 2.25
4 1.5 2.25
2 0.5 0.25
2 0.5 0.25
0 2.5 6.25
24
10017_09_ch9_p225-255.indd 237 2/1/08 1:28:50 PM
238
■ ■
CHAPTER 9
indicating that there is a significant difference in the number of words
recalled in the two conditions.
This difference is illustrated in Figure 9.4, in which the mean numbers of
concrete and abstract words recalled by the participants have been graphed.
Thus, we can conclude that participants performed significantly better
in the concrete word condition, which supports the alternative (research)
hypothesis.
Effect Size: Cohen’s d and r
2
. As with the independent-groups t test, we
should also compute Cohen’s d (the proportion of variance in the dependent
variable that is accounted for by the manipulation of the independent vari-
able) for the correlated-groups t test. Remember, effect size indicates how big
a role the conditions of the independent variable play in determining scores
on the dependent variable. For the correlated-groups t test, the formula for
Cohen’s d is
d
D
__
s
D
FIGURE 9.3
The obtained t-scor
e
in relation to the
t critical value
+3.85+1.895
t
obt
t
cv
FIGURE 9.4
Mean number of
words recalled
c orrectly under
concrete and
abstract word
conditions
0
2
4
6
8
10
12
14
AbstractConcrete
Word Type
Number of Words Recalled
10017_09_ch9_p225-255.indd 238 2/1/08 1:28:51 PM
Inferential Statistics: Two-Group Designs
■ ■
239
where
D is the mean of the difference scores, and s
D
is the standard deviation
of the difference scores. We have already calculated each of these as part of
the t test. Thus,
d
2.5
____
1.85
1.35
Cohen’s d for a correlated-groups design is interpreted in the same manner
as d for an independent-groups design. That is, a small effect size is one of
at least 0.20, a medium effect size is at least 0.50, and a large effect size is at
least 0.80. Obviously, our effect size of 1.35 is far greater than 0.80, indicating
a very large effect size.
We can also compute r
2
for the correlated-groups t test just as we did for
the independent-groups t test using the same formula we did earlier.
r
2
t
2
______
t
2
df
3.85
2
________
3.85
2
7
14.82
_________
14.82 7
14.82
_____
21.82
.68
Using the guidelines established by Cohen (1988) and noted earlier in the
chapter, this is a large effect size.
Confidence Intervals. Just as with the independent-groups t test, we can
calculate confidence intervals based on a correlated-groups t test. In this
case, we use a formula very similar to that used for the single-sample t test
from Chapter 7
CI
.95
D ± t
cv
( s
D
)
We have already calculated
D and s
D
as part of the previous t-test
problem. Thus, we only need to determine t
cv
to calculate the 95% con-
fidence interval. Once again, we consult Table A.3 in Appendix A for a
two-tailed test (remember, we are determining values both above and
below the mean, so we use the t
cv
for a two-tailed test) with 7 degrees of
freedom. We find that the t
cv
is 2.365. Using this, we calculate the confi-
dence interval as follows
CI
.95
2.5 ± 2.365 (0.65)
2.5 ± 1.54
0.96 4.04
Thus, the 95% confidence interval that should contain the difference in
mean test scores between the concrete and the abstract words is 0.96 4.04.
This means that if someone asked us how big a difference word type makes
on memory performance, we could answer that we are 95% confident that
the difference in performance on the 20-item memory test between the
two word type conditions would be between 0.96 and 4.04 words recalled
correctly.
Assumptions of the Correlated-Groups t Test. The assumptions for the
correlated-groups t test are the same as those for the independent-groups
t test, except for the assumption that the observations are independent. In
this case, the observations are not independent—they are correlated.
10017_09_ch9_p225-255.indd 239 2/1/08 1:28:51 PM

240
■ ■
CHAPTER 9
Nonparametric Tests
Statistics used to analyze ordinal and nominal data are referred to a non-
parametric tests. You may remember from Chapter 7 that a nonparametric
test does not involve the use of any population parameters. In other words,
and are not needed, and the underlying distribution does not have to
be normal. In this section, we will look at three nonparametric tests: the
Wilcoxon rank-sum test, the Wilcoxon matched-pairs signed-ranks T test
(both used with ordinal data), and the chi-square test of independence, used
with nominal data.
Wilcoxon Rank-Sum Test: What It Is and What It Does
The Wilcoxon rank-sum test is similar to the independent-groups t test;
however, it uses ordinal data rather than interval-ratio data and compares
medians rather than means. Imagine that a teacher of fifth-grade students
wants to compare the numbers of books read per term by female versus male
students in her class. Rather than reporting the data as the actual number
of books read (interval-ratio data), she ranks the female and male students,
giving the student who read the fewest books a rank of 1 and the student
Wilcoxon rank-sum test
A nonparametric inferential test
for comparing sample medians
of two independent groups of
scores.
Wilcoxon rank-sum test
A nonparametric inferential test
for comparing sample medians
of two independent groups of
scores.
IN REVIEW Independent-Groups and Correlated-Groups t Tests
TYPE OF TEST
INDEPENDENT-GROUPS t TEST CORRELATED-GROUPS t TEST
What It Is A parametric test for a two-group between- A parametric test for a two-group
participants design within-participants or matched-
participants design
What It Does Compares performance of the two groups to Analyzes whether each individual
determine whether they represent the same performed in a similar or different
population or different populations manner across conditions
Assumptions Interval-ratio data Interval-ratio data
Bell-shaped distribution Bell-shaped distribution
Homogeneity of variance Homogeneity of variance
Independent observations Dependent or related observations
CRITICAL
THINKING
CHECK
9.1
1. How is effect size different from significance level? In other words,
how is it possible to have a significant result yet a small effect size?
2. How does increasing the sample size affect a t test? Why does it
affect a t test in this manner?
3. How does decreasing variability affect a t test? Why does it affect a
t test in this manner?
10017_09_ch9_p225-255.indd 240 2/1/08 1:28:52 PM

Inferential Statistics: Two-Group Designs
■ ■
241
who read the most books the highest rank. She does this because the dis-
tribution representing numbers of books read is skewed (not normal). She
predicts that the girls will read more books than the boys. Thus, H
0
is that
the median number of books read does not differ between girls and boys
(Md
girls
Md
boys
, or Md
girls
Md
boys
), and H
a
is that the median number of
books read is greater for girls than for boys (Md
girls
Md
boys
). The numbers
of books read by each group and the corresponding rankings are presented
in Table 9.5. In our example, none of the students read the same number of
books, thus each student receives a different rank. However, if two students
had read the same number of books (for example, if two students each read
10 books), these scores would take positions 1 and 2 in the ranking, each
would be given a rank of 1.5 (halfway between the ranks of 1 and 2), and the
next rank assigned would be 3.
Calculations for the Wilcoxon Rank-Sum Test. As a check to confirm that
the ranking has been done correctly, the highest rank should be equal to
n
1
n
2
; in our example, n
1
n
2
12, and the highest rank is also 12. In
addition, the sum of the ranks should equal N(N + 1)/2, where N is the total
number of people in the study. In our example, 12(12 + 1)/2 78. If we add
the ranks (1 2 3 4 5 6 7 8 9 10 11 12), they also sum
to 78. Thus, the ranking was done correctly.
The Wilcoxon test is completed by first summing the ranks for the group
expected to have the smaller total. Because the teacher expects the boys to
read less, she sums their ranks. This sum, as seen in the Table 9.5, is 24.
Interpreting the Wilcoxon Rank-Sum Test. Using Table A.6 in Appendix A,
we see that for a one-tailed test at the .05 level, if n
1
6 and n
2
6, the
maximum sum of the ranks in the group expected to be lower is 28. If the
sum of the ranks of the group expected to be lower (the boys in this situa-
tion) exceeds 28, then the result is not significant. Note that this is the only
test statistic that we have discussed so far where the obtained value needs to
be equal to or less than the critical value to be statistically significant. When
we use this table, n
1
is always the smaller of the two groups; if the values
TABLE 9.5 Numbers of Books Read and Corresponding Ranks for Female and
Male Students
GIRLS BOYS
X RANK X RANK
20 4 10 1
24 8 17 2
29 9 23 7
33 10 19 3
57 12 22 6
35 11 21 5
24
10017_09_ch9_p225-255.indd 241 2/1/08 1:28:52 PM