IEA Statistics. Oil Information 2011
Подождите немного. Документ загружается.

III.138 - OIL INFORMATION (2011 Edition)
CHILE
* Excluding electricity trade.
** Includes hydro, geothermal, solar, wind, combustible renewables and waste, etc.
Source: Annual Energy Balances.
0
10
20
30
40
50
60
70
Coal Oil Gas Nuclear Other **
Percentage
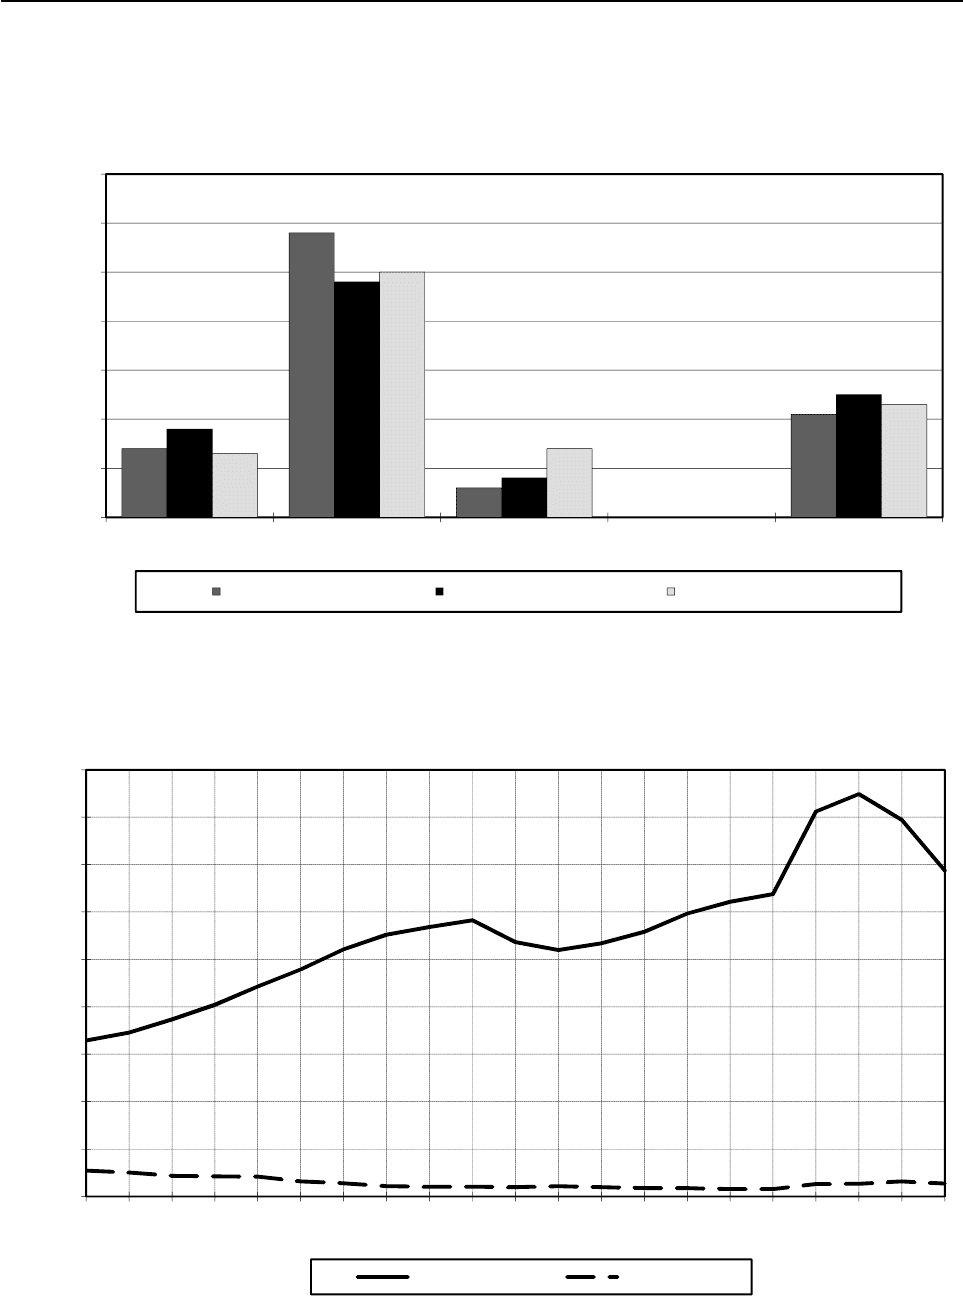
Figure 1. Fuel shares of TPES *
1973 TPES = 9 Mtoe 1990 TPES = 14 Mtoe 2010e TPES = 31 Mtoe
18
Figure 2. Oil production and consumption
*** Includes refinery fuel and international marine bunkers.
Source: Annual Oil Statistics.
0
2
4
6
8
10
12
14
16
18
1990
1991
1992
1993
1994
1995
1996
1997
1998
1999
2000
2001
2002
2003
2004
2005
2006
2007
2008
2009
2010e
Million Metric Tons
Fi
gure
2
.
Oil
pro
d
uc
ti
on an
d
consump
ti
on
Consumption *** Production
INTERNATIONAL ENERGY AGENCY

OIL INFORMATION (2011 Edition) - III.139
CHILE
Table 1: Oil supply and consumption - summary table
000 metric tons
1973 1978 1980 1990 2007 2008 2009 2010e
Indigenous production
1
1 748 1 017 1 786 1 102 527 536 644 546
Crude oil - 703 1 501 847 123 127 178 203
NGL - 314 285 255 404 409 466 343
Othe
r
- - ---- - -
+ Net imports 3 416 3 708 3 311 5 700 16 525 16 506 15 358 14 931
Crude oil, NGL, othe
r
3 141 3 686 3 249 5 393 10 754 10 019 9 849 8 452
Oil products 275 22 62 307 5 771 6 487 5 509 6 479
- Intl. marine bunkers 189 86 88 185 1 220 1 181 848 417
+ Stock changes 1 170 101 - 216 - 809 66 304 390
TOTAL SUPPLY 4 976 4 809 5 110 6 401 15 023 15 927 15 458 15 450
Refinery intake 4 761 4 863 4 864 6 090 10 433 10 126 11 504 9 653
Refinery output 4 628 4 669 4 860 6 090 10 433 9 991 10 023 8 576
LPG + ethane 169 251 259 177 377 262 269 324
Naphtha 59 53 59 41 221 126 116 76
Kerosenes 590 480 390 424 630 588 670 641
Gasolines 1 258 1 024 998 1 453 2 357 2 234 2 451 2 073
Gas/diesel oil 748 1 016 1 182 2 010 3 623 3 811 3 442 2 901
Fuel oil 1 638 1 598 1 733 1 562 2 445 1 906 1 802 1 379
Other products 166 247 239 423 780 1 064 1 273 1 182
- Refinery losse
s
133 194 4 - - 135 1 481 1 077
+ Returns - - ---- - 24
- Statistical differences - - 238 - 8 - - 1 -1 056 1 061
TOTAL CONSUMPTION 4 843 4 853 5 106 6 393 15 023 15 793 15 033 13 336
Transformation and energy 1 023 1 037 1 053 939 3 912 4 187 3 354 ..
Crude oil - - ---- - ..
LPG + ethane 20 18 26 1 126 188 188 ..
Gas/diesel oil 106 134 98 197 2 340 2 431 1 876 ..
Fuel oil 687 609 653 462 338 358 278 ..
Petroleum coke - - - - 578 406 352 ..
Othe
r
210 276 276 279 530 804 660 ..
Transport 1 717 1 795 2 090 3 052 6 676 6 996 6 941 ..
Motor gasolin
e
1 197 1 009 1 080 1 374 2 224 2 297 2 493 ..
Gas/diesel oil 390 617 838 1 374 3 410 3 550 3 534 ..
Subtotal 1 587 1 626 1 918 2 748 5 634 5 847 6 027 ..
Aviation fuels 123 165 172 284 742 860 704 ..
Othe
r
7 4 - 20 300 289 210 ..
Industry 1 231 1 312 1 279 1 524 3 254 3 358 3 431 ..
Naphtha 8 4 5 1 - 2 - ..
LPG + ethane 24 24 28 51 278 284 267 ..
Gas/diesel oil 270 269 272 518 1 961 1 984 1 961 ..
Fuel oil 857 904 915 723 796 864 636 ..
Othe
r
72 111 59 231 219 224 567 ..
Other 872 709 684 878 1 181 e 1 252 e 1 307 ..
Gas/diesel oil 27 30 38 152 140 233 196 ..
Fuel oil 39 35 25 84 99 119 128 ..
Othe
r
806 644 621 642 942 e 900 e 983 ..
Memo: Non-energy use 10 17 9 183 164 144 257 ..
Chem/petchem. feedst. - - - - - - - ..
Other 10 17 9 183 164 144 257 ..
1. Includes inputs from other sources.
Source: Annual Oil Statistics.
INTERNATIONAL ENERGY AGENCY

III.140 - OIL INFORMATION (2011 Edition)
CHILE
Table 2: Supply of crude oil, NGL, feedstocks and other hydrocarbons
000 metric tons
1973 1978 1980 1990 2007 2008 2009 2010e
CRUDE OIL
Indigenous productio
n
- 703 1 501 847 123 127 178 203
+ Imports - 3 686 3 249 5 393 10 754 10 019 9 849 8 335
- Exports - - ---- - -
- Direct use - - ---- - -
+ Stock change - 177 60 - 150 - 444 - 20 62 287
- Statistical differences - - 240 - - - - 40 524
Refinery intake - 4 806 4 810 6 090 10 433 10 126 10 049 8 301
Closing stock level - - - - - - 812 525
NATURAL GAS LIQUIDS
Indigenous productio
n
- 314 285 255 404 409 466 343
+ Imports - - ---- - -
- Exports - - ---- - -
- Direct use - 257 231 255 404 409 466 343
+ Stock change - - ---- - -
- Statistical differences - - - - - - - -
Refinery intake - 57 54 - - - - -
Closing stock level - - - - - - - -
REFINERY FEEDSTOCKS
Backflows - - ---- - 24
+ Transfers - - ---- 1 454 1 225
+ Imports - - ---- - -
- Exports - - ---- - -
+ Stock change - - ---- 1 -
- Statistical differences - - - - - - - -
Refinery intake - - - - - - 1 455 1 249
Closing stock level - - - - - - - -
OTHER HYDROCARBONS
Indigenous productio
n
- - ---- - -
+ Imports - - ---- - 117
- Exports - - ---- - -
- Direct use - - ---- - -
+ Stock change - - ---- - - 9
- Statistical differences - - - - - - - 5
Refinery intake - - - - - - - 103
Closing stock level - - - - - - - 9
CRUDE OIL, NGL, FEEDSTOCKS AND OTHER
Indigenous productio
n
1 748 1 017 1 786 1 102 527 536 644 546
+ Backflows - - ---- - 24
+ Transfers - - ---- 1 454 1 225
+ Imports 3 141 3 686 3 249 5 393 10 754 10 019 9 849 8 452
- Exports - - ---- - -
- Direct use 253 257 231 255 404 409 466 343
+ Stock change 125 177 60 - 150 - 444 - 20 63 278
- Statistical differences - - 240 - - - - 40 529
Refinery intake 4 761 4 863 4 864 6 090 10 433 10 126 11 504 9 653
Closing stock level - - - - - - 812 534
Source: Annual Oil Statistics.
INTERNATIONAL ENERGY AGENCY

OIL INFORMATION (2011 Edition) - III.141
CHILE
Table 3: Motor gasoline - supply
000 metric tons
1973 1978 1980 1990 2007 2008 2009 2010e
MOTOR GASOLINE
Refinery output 1 238 1 010 981 1 439 2 349 2 230 2 445 2 073
+ Imports 42 1 17 40 692 429 558 737
- Exports 22 - - 138 589 603 462 221
+ Transfers - - ---- - 138 - 76
+ Stock change - 61 - 2 82 33 - 228 241 - 102 110
- Statistical differences - - - - - - - 192 69
Total consumption 1 197 1 009 1 080 1 374 2 224 2 297 2 493 2 554
Closing stock level - - - - - - 260 150
Table 4: Aviation fuels - supply
000 metric tons
1973 1978 1980 1990 2007 2008 2009 2010e
AVIATION GASOLINE
Refinery output 20 14 17 14 8 4 6 -
+ Imports 4 - ---- - 12
- Exports - - - 10 - - - -
+ Transfers - - ---- - 2 -
+ Stock change - 3 - 4 - 10 2 - 4 - 4 - 1 -
- Statistical differences - - - - - - 4 - 2 3
Total consumption 21 10 7 6 4 4 5 9
Closing stock level - - - - - - 1 1
GASOLINE TYPE JET FUEL
Refinery output - - - - - - - -
+ Imports - - ---- - -
- Exports - - ---- - -
+ Transfers - - ---- - -
+ Stock change - - ---- - -
- Statistical differences - - - - - - - -
Total consumption - - - - - - - -
Closing stock level - - - - - - - -
KEROSENE TYPE JET FUEL
Refinery output 92 165 158 248 537 511 610 585
+ Imports 11 2 - 54 249 344 174 286
- Exports - - ---- - -
+ Transfers - - ---- - 6 -
+ Stock change - 1 - 12 7 - 23 - 49 - 32 - 9
- Statistical differences - - - 1 - 1 - 1 111 134
Total consumption 102 155 165 278 738 856 699 728
Closing stock level - - - - - - 54 63
Source: Annual Oil Statistics.
INTERNATIONAL ENERGY AGENCY

III.142 - OIL INFORMATION (2011 Edition)
CHILE
Table 5A: Gas/diesel oil - supply and consumption
000 metric tons
1973 1978 1980 1990 2007 2008 2009 2010e
Refinery output 748 1 016 1 182 2 010 3 623 3 811 3 442 2 901
+ Recycled products - - - - - - - -
+ Imports 68 48 88 266 4 540 5 028 4 185 4 550
- Exports - - - - 287 537 474 330
- Intl. marine bunkers - - - 23 40 40 37 20
+ Transfers - - - - - - - 603 - 167
+ Stock changes - 22 - 14 - 26 - 10 15 - 65 212 - 59
- Statistical differences 1 - - 2 2 - - 1 - 842 298
Total consumption 793 1 050 1 246 2 241 7 851 8 198 7 567 6 577
Transformation 98 128 90 182 2 318 2 404 1 874 ..
Main activity producer electricity 29 29 43 141 2 300 2 370 1 806 ..
Autoproducer electricity 69 99 47 41 18 34 38 ..
Main activity producer CHP - - - - - - - ..
Autoproducer CHP - - - - - - 30 ..
Main activity producer heat - - - - - - - ..
Autoproducer heat - - - - - - - ..
Petrochemical industry - - - - - - - ..
Other transformation - - - - - - - ..
Energy industry own use 8 6 8 15 22 27 2 ..
Refinery fuel 8 6 8 15 22 27 2 ..
Other energy industry - - - - - - - ..
Final consumption 687 916 1 148 2 044 5 511 5 767 5 691 ..
Transport
390 617 838 1 374 3 410 3 550 3 534 ..
Aviation - - - - 1 1 1 ..
Road 293 465 717 1 108 3 099 3 212 3 216 ..
Rail 37 29 16 18 19 45 43 ..
Domestic navigation 60 123 105 248 291 292 274 ..
Non-specified - - - - - - - ..
Industry
270 269 272 518 1 961 1 984 1 961 ..
Iron and steel 20 16 12 1 3 2 1 ..
Chemical (incl. pet.-chem.) - - - - - - - ..
Non-ferrous metals 78 77 95 - - - - ..
Non-metallic minerals - 1 - 3 7 10 9 ..
Transport equipment - - - - - - - ..
Machinery - - - - - - - ..
Mining and quarrying 8 11 8 248 1 170 1 186 1 333 ..
Food and tobacco 1 1 1 - - - - ..
Pulp, paper and printing - 2 2 2 23 10 10 ..
Wood and wood products - - - - - - - ..
Construction - - - - - - - ..
Textiles and leather - - - - - - - ..
Non-specified 163 161 154 264 758 776 608 ..
Other
27 30 38 152 140 233 196 ..
Commerce and public - - - 20 93 162 130 ..
Residential - - - 123 13 5 6 ..
Agriculture (incl. fishing) - - - 9 34 66 60 ..
Non-specified 27 30 38 - - - - ..
Memo: Non-energy use - - - - - - - ..
Chem/petchem. feedst. - - - - - - - ..
Other - - - - - - - ..
Closing stock level - - - - - - 218 277
Source: Annual Oil Statistics.
INTERNATIONAL ENERGY AGENCY

OIL INFORMATION (2011 Edition) - III.143
CHILE
Table 5B: Fuel oil (residual) - supply and consumption
000 metric tons
1973 1978 1980 1990 2007 2008 2009 2010e
Refinery output 1 638 1 598 1 733 1 562 2 445 1 906 1 802 1 379
+ Recycled products - - - - - - - -
+ Imports 115 35 14 4 104 586 473 427
- Exports - - 57 55 90 - 81 -
- Intl. marine bunkers 189 86 88 162 1 180 1 141 811 397
+ Transfers - - - - - - - 402 - 137
+ Stock changes 23 1 - 8 - 58 250 275 86 81
- Statistical differences - 1 - 2 1 2 - - 1 - 179 121
Total consumption 1 588 1 550 1 593 1 289 1 529 1 627 1 246 1 232
Transformation 533 470 520 300 295 321 238 ..
Main activity producer electricity 79 24 44 120 183 182 131 ..
Autoproducer electricity 454 446 476 180 96 113 82 ..
Main activity producer CHP - - - - - - - ..
Autoproducer CHP - - - - - - 19 ..
Main activity producer heat - - - - - - - ..
Autoproducer heat - - - - - - - ..
Petrochemical industry - - - - - - - ..
Other transformation - - - - 16 26 6 ..
Energy industry own use 154 139 133 162 43 37 40 ..
Refinery fuel 154 139 133 162 42 37 40 ..
Other energy industry - - - - 1 - - ..
Final consumption 901 941 940 827 1 191 1 269 968 ..
Transport
5 2 - 20 296 286 204 ..
Aviation - - - - - - - ..
Road - - - - - - - ..
Rail 5 2 - - - - - ..
Domestic navigation - - - 20 296 286 204 ..
Non-specified - - - - - - - ..
Industry
857 904 915 723 796 864 636 ..
Iron and steel 122 130 121 35 18 43 32 ..
Chemical (incl. pet.-chem.) 9 6 5 - 1 1 - ..
Non-ferrous metals - - - - - - - ..
Non-metallic minerals 54 44 39 4 33 16 12 ..
Transport equipment - - - - - - - ..
Machinery - - - - - - - ..
Mining and quarrying 299 353 354 483 212 214 212 ..
Food and tobacco 17 3 3 - - - - ..
Pulp, paper and printing 144 140 104 65 222 215 244 ..
Wood and wood products - - - - - - - ..
Construction - - - - - - - ..
Textiles and leather - - - - - - - ..
Non-specified 212 228 289 136 310 375 136 ..
Other
39 35 25 84 99 119 128 ..
Commerce and public - - - 2 25 60 46 ..
Residential - - - 13 - - - ..
Agriculture (incl. fishing) - - - 69 74 59 82 ..
Non-specified 39 35 25 - - - - ..
Memo: Non-energy use - - - - - - - ..
Chem/petchem. feedst. - - - - - - - ..
Other - - - - - - - ..
Closing stock level - - - - - - 179 98
Source: Annual Oil Statistics.
INTERNATIONAL ENERGY AGENCY

III.144 - OIL INFORMATION (2011 Edition)
CHILE
Table 5C: Total products - supply and consumption
000 metric tons
1973 1978 1980 1990 2007 2008 2009 2010e
Refinery output 4 628 4 669 4 860 6 090 10 433 9 991 10 023 8 576
+ Recycled products - - - - - - - -
+ Imports 325 86 119 510 6 919 7 705 6 583 7 108
- Exports 50 64 57 203 1 148 1 218 1 074 629
- Intl. marine bunkers 189 86 88 185 1 220 1 181 848 417
+ Transfers 253 257 231 255 404 409 - 988 - 882
+ Stock changes - 124 - 7 41 - 66 - 365 86 241 112
- Statistical differences - 2 - 8 - - 1 -1 096 532
Total consumption 4 843 4 853 5 106 6 393 15 023 15 793 15 033 13 336
Transformation 699 661 667 523 3 242 3 210 2 542 ..
Main activity producer electricity 108 53 87 261 3 061 2 958 2 299 ..
Autoproducer electricity 523 545 523 221 114 147 121 ..
Main activity producer CHP - - - - - - - ..
Autoproducer CHP - - - - - - 49 ..
Main activity producer heat - - - - - - - ..
Autoproducer heat - - - - - - - ..
Petrochemical industry - - - - - - - ..
Other transformation 68 63 57 41 67 105 73 ..
Energy industry own use 324 376 386 416 670 977 812 ..
Refinery fuel 320 374 384 416 668 976 811 ..
Other energy industry 4 2 2 - 2 1 1 ..
Final consumption 3 820 3 816 4 053 5 454 11 111 11 606 11 679 ..
Transport
1 717 1 795 2 090 3 052 6 676 6 996 6 941 ..
Aviation 123 165 172 284 743 861 705 ..
Road 1 492 1 476 1 797 2 482 5 327 e 5 512 e 5 715 ..
Rail 42 31 16 18 19 45 43 ..
Domestic navigation 60 123 105 268 587 578 478 ..
Non-specified - - - - - - - ..
Industry
1 231 1 312 1 279 1 524 3 254 3 358 3 431 ..
Iron and steel 142 146 133 36 21 45 e 33 ..
Chemical (incl. pet.-chem.) 9 6 5 - 3 6 e 8 ..
Non-ferrous metals 78 77 95 - - - - ..
Non-metallic minerals 54 45 39 7 67 81 295 ..
Transport equipment - - - - - - - ..
Machinery - - - - - - - ..
Mining and quarrying 317 395 380 762 1 400 1 421 1 564 ..
Food and tobacco 18 4 5 - - - - ..
Pulp, paper and printing 144 142 106 71 259 241 266 ..
Wood and wood products - - - - - - - ..
Construction - - - - - - - ..
Textiles and leather - - - - - - - ..
Non-specified 469 497 516 648 1 504 1 564 1 265 ..
Other
872 709 684 878 1 181 e 1 252 e 1 307 ..
Commerce and public - - - 112 227 e 328 e 307 ..
Residential 806 644 621 688 842 797 853 ..
Agriculture (incl. fishing) - - - 78 112 127 147 ..
Non-specified 66 65 63 - - - - ..
Memo: Non-energy use 10 17 9 183 164 144 257 ..
Chem/petchem. feedst. - - - - - - - ..
Other 10 17 9 183 164 144 257 ..
Closing stock level - - - - - - 1 007 895
Source: Annual Oil Statistics.
INTERNATIONAL ENERGY AGENCY

OIL INFORMATION (2011 Edition) - III.145
CHILE
Table 6A: Supply and consumption
000 metric tons
1990 2008 2009 2010e 1990 2008 2009 2010e
LPG AND ETHANE REFINERY GAS
Refinery output 177 262 269 324 240 706 571 224
+ Recycled products - - - - - - - -
+ Imports 146 901 770 802 - - - -
- Exports - 50 32 13 - - - -
- Intl. marine bunkers - - - - - - - -
+ Transfers 255 409 466 - 75 - - - -
+ Stock change - 11 - 196 3 - 6 - - - -
- Statistical difference 2 4 117 24 - - - -
Total consumption 565 1 322 1 359 1 008 240 706 571 224
of which: ethane - - - - - - - -
Transformation 1 79 78 .. - - - ..
Energy industry own use - 109 110 .. 239 706 571 ..
Transport - 3 6 .. - - - ..
Industry 51 284 267 .. 1 - - ..
Other 513 847 898 .. - - - ..
Memo: Non-energy use - - - .. - - - ..
Closing stock level - - 80 86 - - - -
NAPHTHA OTHER KEROSENE
Refinery output 41 126 116 76 176 77 60 56
+ Recycled products - - - - - - - -
+ Imports - - 3 - - - - -
- Exports - 28 25 - - - - -
- Intl. marine bunkers - - - - - - - -
+ Transfers - - - - 77 - - - 6 -
+ Stock change - 2 - 5 14 1 2 12 9
- Statistical difference - - - - 18 1 1 - 56 - 68
Total consumption 41 100 89 31 176 78 122 133
Transformation 40 - - .. - - - ..
Energy industry own use - 98 89 .. - - - ..
Transport - - - .. - - - ..
Industry 1 2 - .. 47 25 37 ..
Other - - - .. 129 53 e 85 ..
Memo: Non-energy use - - - .. - - - ..
Closing stock level - - 28 14 - - 14 5
WHITE SPIRIT + SBP LUBRICANTS
Refinery output - - - .. - - - ..
+ Recycled products - - - .. - - - ..
+ Imports - - - .. - - - ..
- Exports - - - .. - - - ..
- Intl. marine bunkers - - - .. - - - ..
+ Transfers - - - .. - - - ..
+ Stock change - - - .. - - - ..
- Statistical difference - - - .. - - - ..
Total consumption - - - .. - - - ..
Transformation - - - .. - - - ..
Energy industry own use - - - .. - - - ..
Transport - - - .. - - - ..
Industry - - - .. - - - ..
Other - - - .. - - - ..
Memo: Non-energy use - - - .. - - - ..
Closing stock level - - - .. - - - ..
Source: Annual Oil Statistics.
INTERNATIONAL ENERGY AGENCY

III.146 - OIL INFORMATION (2011 Edition)
CHILE
Table 6B: Supply and consumption
000 metric tons
1990 2008 2009 2010e 1990 2008 2009 2010e
BITUMEN PARAFFIN WAXES
Refinery output - - - .. - - - ..
+ Recycled products - - - .. - - - ..
+ Imports - - - .. - - - ..
- Exports - - - .. - - - ..
- Intl. marine bunkers - - - .. - - - ..
+ Transfers - - - .. - - - ..
+ Stock change - - - .. - - - ..
- Statistical difference - - - .. - - - ..
Total consumption - - - .. - - - ..
Transformation - - - .. - - - ..
Energy industry own use - - - .. - - - ..
Transport - - - .. - - - ..
Industry - - - .. - - - ..
Other - - - .. - - - ..
Memo: Non-energy use - - - .. - - - ..
Closing stock level - - - .. - - - ..
PETROLEUM COKE OTHER PRODUCTS
Refinery output - 214 180 185 183 144 522 773
+ Recycled products - - - - - - - -
+ Imports - 417 420 294 - - - -
- Exports - - - 65 - - - -
- Intl. marine bunkers - - - - - - - -
+ Transfers - - - - - - - 297 - 350
+ Stock change - - 169 - 28 - 134 - - 32 106
- Statistical difference - 1 - 53 - 193 - - - 162
Total Consumption - 461 625 473 183 144 257 367
Transformation - 406 352 .. - - - ..
Energy industry own use - - - .. - - - ..
Transport - - - .. - - - ..
Industry - 55 273 .. 183 144 257 ..
Other - - - .. - - - ..
Memo: Non-energy use - - - .. 183 144 257 ..
Closing stock level - - 43 177 - - 130 24
Source: Annual Oil Statistics.
INTERNATIONAL ENERGY AGENCY

OIL INFORMATION (2011 Edition) - III.147
CHILE
Table 7A: Imports by country of origin
000 metric tons
2008 2009 2010e 2008 2009 2010e 2008 2009 2010e
Crude oil Natural gas liquids Feedstocks and other
Australia - - - - - - - - -
Bel
g
ium - - - - - - - - -
Canada - - - - - - - - -
Czech Re
p
ubli
c
- - - - - - - - -
Denmark - - - - - - - - -
Finland - - - - - - - - -
France - - - - - - - - -
German
y
- - - - - - - - -
Greece - - - - - - - - -
Hun
g
ar
y
- - - - - - - - -
Ireland - - - - - - - - -
Ital
y
- - - - - - - - -
Ja
p
an - - - - - - - - -
Korea - - - - - - - - -
Mexic
o
- - - - - - - - -
Netherlands - - - - - - - - -
New Zealand - - - - - - - - -
Norwa
y
- 486 - - - - - - -
Poland - - - - - - - - -
S
p
ain - - - - - - - - -
Sweden - - - - - - - - -
Turke
y
840 - - - - - - - -
United Kin
g
dom - 1 002 1 010 - - - - - -
United States - - - - - - - - 85
Othe
r
- - - - - - - - 32
OECD 840 1 488 1 010 - - - - - 117
Ar
g
entina - 2 594 1 896 - - - - - -
Brazil 2 534 1 828 2 819 - - - - - -
Colombia 1 656 1 671 1 302 - - - - - -
Ecuado
r
2 281 1 607 1 160 - - - - - -
Netherlands Antilles - - - - - - - - -
Peru 281 229 148 - - - - - -
Trinidad and Toba
go
- - - - - - - - -
Venezuela - - - - - - - - -
Othe
r
- - - - - - - - -
Latin America 6 752 7 929 7 325 - - - - - -
Kazakhstan - - - - - - - - -
Russian Federation - - - - - - - - -
Other - - - - - - - - -
Non-OECD Europe/Eurasia
- - - - - - - - -
Iran - - - - - - - - -
Ira
q
- - - - - - - - -
Kuwai
t
- - - - - - - - -
Oman - - - - - - - - -
Qata
r
- - - - - - - - -
Saudi Arabia - - - - - - - - -
United Arab Emirates - - - - - - - - -
Othe
r
- - - - - - - - -
Middle East - - - - - - - - -
India - - - - - - - - -
Indonesi
a
- 75 - - - - - - -
Sin
g
a
p
ore - - - - - - - - -
Othe
r
- 232 - - - - - - -
Asia - 307 - - - - - - -
China - - - - - - - - -
Al
g
eria - - - - - - - - -
An
g
ola 2 029 125 - - - - - - -
Cameroon - - - - - - - - -
E
gypt
- - - - - - - - -
Gabon - - - - - - - - -
Lib
y
an Arab Jamahiri
y
a - - - - - - - - -
Ni
g
eria - - - - - - - - -
Tunisia - - - - - - - - -
Othe
r
- - - - - - - - -
Africa 2 029 125 - - - - - - -
Non-spec./other 398 - - - - - - - -
Total imports 10 019 9 849 8 335 - - - - - 117
Memo: Total OPEC 4 310 1 732 1 160 - - - - - -
Source: Annual Oil Statistics.
INTERNATIONAL ENERGY AGENCY