IEA Statistics. Oil Information 2011
Подождите немного. Документ загружается.


III.118 - OIL INFORMATION (2011 Edition)
BELGIUM
Table 7B: Imports by country of origin
000 metric tons
2008 2009 2010e 2008 2009 2010e 2008 2009 2010e
Total products Liquefied petroleum gases Naphtha
Australia - - - - - - - - -
Bel
g
ium - - - - - - - - -
Canada 85 - - - - - - - -
Czech Re
p
ubli
c
- - - - - - - - -
Denmark 32 71 - 6 3 - - - -
Finland 84 89 - - - - - - -
France 1 129 700 647 - - 32 138 67 -
German
y
442 205 203 12 3 3 135 98 53
Greece - - - - - - - - -
Hun
g
ar
y
- - - - - - - - -
Ireland - - - - - - - - -
Ital
y
- 62 44 - - - - 39 28
Ja
p
an - - - - - - - - -
Korea 204 3 - - - - - - -
Mexic
o
15 - 113 - - - - - -
Netherlands 12 183 11 721 10 886 250 243 155 281 369 167
New Zealand - - - - - - - - -
Norwa
y
448 444 212 320 248 207 12 30 -
Poland 27 1 39 - - - - - 12
S
p
ain 462 213 398 - - 2 451 186 329
Sweden 229 178 265 1 23 2 - 6 28
Turke
y
- - - - - - - - -
United Kin
g
dom 1 565 1 207 671 379 310 131 143 67 13
United States 401 199 47 1 38 - - - -
Othe
r
341 175 90 5 3 23 - - -
OECD 17 647 15 268 13 615 974 871 555 1 160 862 630
Ar
g
entina 42 - - - - - - - -
Brazil 42 - - - - - - - -
Colombia 48 - - - - - - - -
Ecuado
r
- - - - - - - - -
Netherlands Antilles - 18 - - - - - - -
Peru - - - - - - - - -
Trinidad and Toba
go
- - - - - - - - -
Venezuela 32 - - - - - - - -
Othe
r
- - - - - - - - -
Latin America 164 18 - - - - - - -
Kazakhstan 12 - - - - - - - -
Russian Federation 2 230 2 452 1 560 - - - 1 120 1 570 1 034
Other 212 74 - 34 - - - - -
Non-OECD Europe/Eurasia
2 454 2 526 1 560 34 - - 1 120 1 570 1 034
Iran - - - - - - - - -
Ira
q
- - - - - - - - -
Kuwai
t
- - - - - - - - -
Oman - - - - - - - - -
Qata
r
90 - - 90 - - - - -
Saudi Arabia - - 135 - - 27 - - 108
United Arab Emirates - - - - - - - - -
Othe
r
28 - - - - - 28 - -
Middle East 118 - 135 90 - 27 28 - 108
India 141 - - - - - 51 - -
Indonesi
a
- - - - - - - - -
Sin
g
a
p
ore - - - - - - - - -
Othe
r
19 - - - - - - - -
Asia 160 - - - - - 51 - -
China - - - - - - - - -
Al
g
eria 302 558 611 33 143 55 269 415 556
An
g
ola 29 77 123 - - - 29 77 123
Cameroon - - - - - - - - -
E
gypt
407 104 - - - - 407 104 -
Gabon - 3 1 - - 1 - - -
Lib
y
an Arab Jamahiri
y
a 5 117 60 5 - - - 117 60
Ni
g
eria 41 - 8 41 - 8 - - -
Tunisia 17 44 - - - - - 44 -
Othe
r
92 35 83 - 11 - 38 24 83
Africa 893 938 886 79 154 64 743 781 822
Non-spec./Other 1 241 e 1 473 928 - - - 1 15 -
Total imports 22 677 e 20 223 17 124 1 177 1 025 646 3 103 3 228 2 594
Memo: Total OPEC 499 752 937 169 143 90 298 609 847
Source: Annual Oil Statistics.
INTERNATIONAL ENERGY AGENCY

OIL INFORMATION (2011 Edition) - III.119
BELGIUM
Table 7C: Imports by country of origin
000 metric tons
2008 2009 2010e 2008 2009 2010e 2008 2009 2010e
Total gasoline Total kerosene Gas/diesel
Australia - - - - - - - - -
Bel
g
ium - - - - - - - - -
Canada - - - - - - 84 - -
Czech Re
p
ubli
c
- - - - - - - - -
Denmark - - - - - - - - -
Finland - - - - 38 - - - -
France 55 3 3 80 80 55 165 35 78
German
y
58 14 30 12 9 11 63 1 1
Greece - - - - - - - - -
Hun
g
ar
y
- - - - - - - - -
Ireland - - - - - - - - -
Ital
y
- - - - - - - - -
Ja
p
an - - - - - - - - -
Korea - - - - - - 199 - -
Mexic
o
- - 8 - - - 15 - 105
Netherlands 536 275 184 165 343 341 5 381 6 365 6 048
New Zealand - - - - - - - - -
Norwa
y
20 - - - - - 67 22 -
Poland - - - - - - 22 - -
S
p
ain 5 - - - - - - - -
Sweden - - - - - - 55 33 -
Turke
y
- - - - - - - - -
United Kin
g
dom 96 50 106 - 8 - 591 561 346
United States - - - - - - 238 78 -
Othe
r
9 4 - 1 - - 103 8 -
OECD 779 346 331 258 478 407 6 983 7 103 6 578
Ar
g
entina - - - - - - - - -
Brazil - - - - - - - - -
Colombia - - - - - - - - -
Ecuado
r
- - - - - - - - -
Netherlands Antilles - - - - - - - - -
Peru - - - - - - - - -
Trinidad and Toba
go
- - - - - - - - -
Venezuela - - - - - - 32 - -
Othe
r
- - - - - - - - -
Latin America - - - - - - 32 - -
Kazakhstan - - - - - - - - -
Russian Federation 35 - - - - - 418 58 -
Other - - - - - - 163 30 -
Non-OECD Europe/Eurasia
35 - - - - - 581 88 -
Iran - - - - - - - - -
Ira
q
- - - - - - - - -
Kuwai
t
- - - - - - - - -
Oman - - - - - - - - -
Qata
r
- - - - - - - - -
Saudi Arabia - - - - - - - - -
United Arab Emirates - - - - - - - - -
Othe
r
- - - - - - - - -
Middle East - - - - - - - - -
India - - - - - - 90 - -
Indonesi
a
- - - - - - - - -
Sin
g
a
p
ore - - - - - - - - -
Othe
r
- - - - - - 19 - -
Asia - - - - - - 109 - -
China - - - - - - - - -
Al
g
eria - - - - - - - - -
An
g
ola - - - - - - - - -
Cameroon - - - - - - - - -
E
gypt
- - - - - - - - -
Gabon - - - - - - - - -
Lib
y
an Arab Jamahiri
y
a - - - - - - - - -
Ni
g
eria - - - - - - - - -
Tunisia - - - - - - - - -
Othe
r
- - - - - - - - -
Africa - - - - - - - - -
Non-spec./other - - - 1 240 e 1 283 825 - 138 -
Total imports 814 346 331 1 498 e 1 761 1 232 7 705 7 329 6 578
Memo: Total OPEC - - - - - - 32 - -
Source: Annual Oil Statistics.
INTERNATIONAL ENERGY AGENCY

III.120 - OIL INFORMATION (2011 Edition)
BELGIUM
Table 7D: Imports by country of origin
000 metric tons
2008 2009 2010e 2008 2009 2010e 2008 2009 2010e
Fuel oil (residual) Petroleum coke Other products
Australia - - - - - - - - -
Bel
g
ium - - - - - - - - -
Canada - - - - - - 1 - -
Czech Re
p
ubli
c
- - - - - - - - -
Denmark 26 68 - - - - - - -
Finland 69 51 - - - - 15 - -
France 379 281 215 - - - 312 234 264
German
y
140 55 76 - - - 22 25 29
Greece - - - - - - - - -
Hun
g
ar
y
- - - - - - - - -
Ireland - - - - - - - - -
Ital
y
- - - - - - - 23 16
Ja
p
an - - - - - - - - -
Korea - - - - - - 5 3 -
Mexic
o
- - - - - - - - -
Netherlands 5 316 3 884 3 756 11 13 16 243 e 229 219
New Zealand - - - - - - - - -
Norwa
y
29 144 5 - - - - - -
Poland - - - - - - 5 1 27
S
p
ain 5 27 67 - - - 1 - -
Sweden 170 105 191 - - - 3 11 44
Turke
y
- - - - - - - - -
United Kin
g
dom 339 187 27 - - - 17 24 48
United States 66 36 34 80 15 13 16 32 -
Othe
r
215 160 67 - - - 8 - -
OECD 6 754 4 998 4 438 91 28 29 648 e 582 647
Ar
g
entina 42 - - - - - - - -
Brazil 42 - - - - - - - -
Colombia 48 - - - - - - - -
Ecuado
r
- - - - - - - - -
Netherlands Antilles - 18 - - - - - - -
Peru - - - - - - - - -
Trinidad and Toba
go
- - - - - - - - -
Venezuela - - - - - - - - -
Othe
r
- - - - - - - - -
Latin America 132 18 - - - - - - -
Kazakhstan 12 - - - - - - - -
Russian Federation 657 812 526 - - - - 12 -
Other 15 44 - - - - - - -
Non-OECD Europe/Eurasia
684 856 526 - - - - 12 -
Iran - - - - - - - - -
Ira
q
- - - - - - - - -
Kuwai
t
- - - - - - - - -
Oman - - - - - - - - -
Qata
r
- - - - - - - - -
Saudi Arabia - - - - - - - - -
United Arab Emirates - - - - - - - - -
Othe
r
- - - - - - - - -
Middle East - - - - - - - - -
India - - - - - - - - -
Indonesi
a
- - - - - - - - -
Sin
g
a
p
ore - - - - - - - - -
Othe
r
- - - - - - - - -
Asia - - - - - - - - -
China - - - - - - - - -
Al
g
eria - - - - - - - - -
An
g
ola - - - - - - - - -
Cameroon - - - - - - - - -
E
gypt
- - - - - - - - -
Gabon - - - - - - - 3 -
Lib
y
an Arab Jamahiri
y
a - - - - - - - - -
Ni
g
eria - - - - - - - - -
Tunisia 17 - - - - - - - -
Othe
r
54 - - - - - - - -
Africa 71 - - - - - - 3 -
Non-spec./other - 32 - - - - - 5 103
Total imports 7 641 5 904 4 964 91 28 29 648 e 602 750
Memo: Total OPEC - - - - - - - - -
Source: Annual Oil Statistics.
INTERNATIONAL ENERGY AGENCY

OIL INFORMATION (2011 Edition) - III.121
BELGIUM
Table 8A: Exports by country of destination
000 metric tons
2008 2009 2010e 2008 2009 2010e 2008 2009 2010e
Crude oil Natural gas liquids Feedstocks and other
Australia - - - - - - - - -
Austria - - - - - - - - -
Bel
g
ium - - - - - - - - -
Canada - - - - - - - - -
Denmark - - - - - - 5 - -
Finland - - - - - - 8 - -
France - - - - - - 164 134 109
German
y
- - - - - - 279 455 381
Greece - - - - - - - - -
Ireland - - - - - - - - -
Ital
y
- - - - - - - - -
Ja
p
an - - - - - - - - -
Luxembour
g
- - - - - - - - -
Mexic
o
- - - - - - - - -
Netherlands - - - - - - 1 882 2 305 2 133
Norwa
y
- - - - - - 2 18 4
Portu
g
al - - - - - - - - -
S
p
ain - - - - - - - - -
Sweden - - - - - - 15 - -
Switzerland - - - - - - 25 - -
Turke
y
- - - - - - - - -
United Kin
g
dom - - - - - - 52 126 -
United States - - - - - - 1 919 1 879 2 429
Other OECD - - - - - - - 14 -
OECD - - - - - - 4 351 4 931 5 056
Africa - - - - - - 30 - -
Latin America - - - - - - - - -
Asia - - - - - - - - -
China - - - - - - - - -
Non-OECD Euro
p
e/Eurasi
a
- - - - - - - - -
Russian Federation - - - - - - - - -
Middle Eas
t
- - - - - - - 40 -
Non-s
p
ecified/Othe
r
- - - - - - - - -
Non-OECD - - - - - - 30 40 -
Total exports - - - - - - 4 381 4 971 5 056
Total products Liquefied petroleum gas Naphtha
Australia - - - - - - - - -
Austria 74 105 111 12 5 - - - -
Bel
g
ium - - - - - - - - -
Canada 364 323 91 - - - - - -
Denmark 20 36 13 - 1 - - - -
Finland 33 4 63 - - - - - -
France 1 460 1 403 1 348 56 42 58 3 16 8
German
y
4 708 3 442 4 108 573 508 461 35 42 135
Greece 39 31 - - 1 - - - -
Ireland 108 16 1 12 2 - - - -
Ital
y
28 87 33 - - - - - -
Ja
p
an 2 3 - - - - - - -
Luxembour
g
2 522 2 458 2 007 36 20 17 - - -
Mexic
o
4 117 - - - - - - -
Netherlands 5 729 6 141 6 751 180 181 175 213 160 13
Norwa
y
393 25 7 - 1 - - - -
Portu
g
al 84 33 - 13 2 - - - -
S
p
ain 177 145 62 5 2 - - - -
Sweden 191 112 351 3 - - - - -
Switzerland 1 157 820 770 6 4 - - - -
Turke
y
2 - - - - - - - -
United Kin
g
dom 726 771 959 26 14 41 - - -
United States 1 724 960 807 1 - - - - -
Other OECD 150 79 198 29 3 - - - -
OECD 19 695 17 111 17 680 952 786 752 251 218 156
Africa 617 537 - 2 - - - - -
Latin America 84 5 6 - - - - - -
Asia 32 11 - 4 2 - - - -
China 4 2 - - - - - - -
Non-OECD Euro
p
e/Eurasi
a
65 243 104 8 - - - - -
Russian Federation 18 76 103 - - - - - -
Middle Eas
t
63 21 1 - - - - - -
Non-s
p
ecified/othe
r
4 104 95 - - - - - -
Non-OECD 887 999 309 14 2 - - - -
Total exports 20 582 18 110 17 989 966 788 752 251 218 156
Source: Annual Oil Statistics.
INTERNATIONAL ENERGY AGENCY

III.122 - OIL INFORMATION (2011 Edition)
BELGIUM
Table 8B: Exports by country of destination
000 metric tons
2008 2009 2010e 2008 2009 2010e 2008 2009 2010e
Total gasoline Total kerosene Gas/diesel oil
Australia - - - - - - - - -
Austria - 2 - - - - 50 83 83
Bel
g
ium -- - --- - - -
Canada 364 291 91 - - - - - -
Denmark - - - - - - - 15 -
Finland - - 1 - - - - - 62
France 8 43 67 34 35 24 704 603 506
German
y
171 133 221 1 033 980 762 2 198 1 199 1 952
Greece - - - - - - 33 26 -
Ireland 39 - - - 12 1 7 - -
Ital
y
- 26 - - - - - - -
Ja
p
an -- - --- - - -
Luxembour
g
438 399 369 259 247 162 1 748 1 729 1 424
Mexic
o
4 - - - - - - 33 -
Netherlands 1 162 1 074 1 157 49 186 179 1 501 2 680 3 013
Norwa
y
375 12 - - - - - - -
Portu
g
al - 10 - - - - 10 - -
S
p
ain - 18 16 - - - - - -
Sweden - - - - - - 56 56 114
Switzerland 30 22 64 7 53 78 1 075 701 574
Turke
y
-- - --- - - -
United Kin
g
dom 191 196 63 - 47 71 258 219 450
United States 892 471 189 1 2 - 37 2 -
Other OECD - 16 12 - - - 78 18 137
OECD 3 674 2 713 2 250 1 383 1 562 1 277 7 755 7 364 8 315
Africa 32 - - 2 - - 560 489 -
Latin America - - - - - - 56 - -
Asia - - - - - - - - -
China - - - - - - - - -
Non-OECD Euro
p
e/Eurasi
a
- - 1 - - - 18 189 14
Russian Federation - - - - - - - - -
Middle Eas
t
11 - - - - - 33 - -
Non-s
p
ecified/Othe
r
-- - --- 1 89 -
Non-OECD 43 - 1 2 - - 668 767 14
Total exports 3 717 2 713 2 251 1 385 1 562 1 277 8 423 8 131 8 329
Fuel oil (residual) Petroleum coke Other products
Australia - - - - - - - - -
Austria - - - - - - 12 15 28
Bel
g
ium -- - --- - - -
Canada - 32 - - - - - - -
Denmark - - - - - - 20 20 13
Finland 28 - - - - - 5 4 -
France 320 313 209 - - - 335 351 476
German
y
350 235 152 1 1 - 347 344 425
Greece - - - - - - 6 4 -
Ireland 26 - - - - - 24 2 -
Ital
y
4 34 - - - - 24 27 33
Ja
p
an -- - --- 2 3 -
Luxembour
g
26 43 - - - - 15 20 35
Mexic
o
- 84 - - - - - - -
Netherlands 2 299 1 555 1 868 - - - 325 305 346
Norwa
y
2 - - - - - 16 12 7
Portu
g
al 57 18 - - - - 4 3 -
S
p
ain 114 89 - - - - 58 36 46
Sweden 116 40 175 - - - 16 16 62
Switzerland - 1 - - - - 39 39 54
Turke
y
-- - --- 2 - -
United Kin
g
dom 168 193 217 - - - 83 102 117
United States 782 477 594 - - - 11 8 24
Other OECD - - - - - - 43 42 49
OECD 4 292 3 114 3 215 1 1 - 1 387 1 353 1 715
Africa - 14 - - - - 21 34 -
Latin America 21 - - - - - 7 5 6
Asia 2 - - - - - 26 9 -
China - - - - - - 4 2 -
Non-OECD Euro
p
e/Eurasi
a
6 27 - - - - 33 27 89
Russian Federation - 55 - - - - 18 21 103
Middle Eas
t
- - - - - - 19 21 1
Non-s
p
ecified/othe
r
- 5 - - - - 3 10 95
Non-OECD 29 101 - - - - 131 129 294
Total exports 4 321 3 215 3 215 1 1 - 1 518 1 482 2 009
Source: Annual Oil Statistics.
INTERNATIONAL ENERGY AGENCY
OIL INFORMATION (2011 Edition) - III.123
CANAD
A
* Excluding electricity trade.
** Includes hydro, geothermal, solar, wind, combustible renewables and waste, etc.
Source: Annual Energy Balances.
0
10
20
30
40
50
60
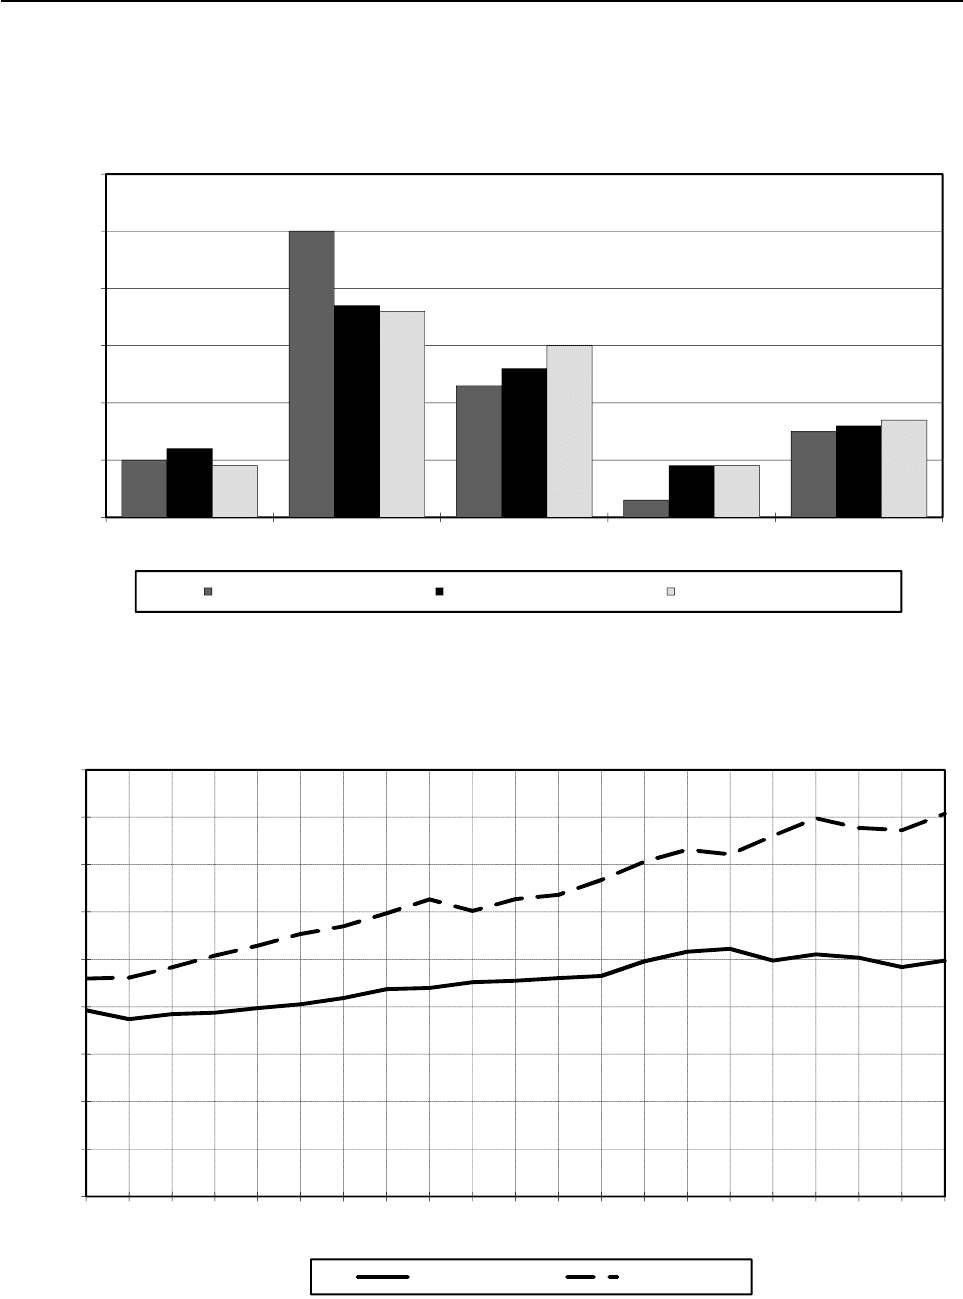
Coal Oil Gas Nuclear Other **
Percentage
Figure 1. Fuel shares of TPES *
1973 TPES = 159 Mtoe 1990 TPES = 209 Mtoe 2010e TPES = 255 Mtoe
180
Figure 2. Oil production and consumption
*** Includes refinery fuel and international marine bunkers.
Source: Annual Oil Statistics.
0
20
40
60
80
100
120
140
160
180
1990
1991
1992
1993
1994
1995
1996
1997
1998
1999
2000
2001
2002
2003
2004
2005
2006
2007
2008
2009
2010e
Million Metric Tons
Fi
gure
2
.
Oil
pro
d
uc
ti
on an
d
consump
ti
on
Consumption *** Production
INTERNATIONAL ENERGY AGENCY

III.124 - OIL INFORMATION (2011 Edition)
CANADA
Table 1: Oil supply and consumption - summary table
000 metric tons
1973 1978 1980 1990 2007 2008 2009 2010e
Indigenous production
1
94 128 75 080 81 389 91 951 159 555 155 507 154 438 161 445
Crude oil - 70 194 64 128 68 490 101 731 100 641 95 247 96 019
NGL - 4 886 10 487 12 845 21 952 20 893 19 703 20 166
Othe
r
- - 6 774 10 616 35 872 33 973 39 488 45 260
+ Net imports -13 907 10 779 8 767 -13 714 -61 077 -60 831 -66 280 -67 985
Crude oil, NGL, othe
r
-13 560 14 404 12 369 -10 080 -53 293 -55 207 -57 887 -60 076
Oil products - 347 -3 625 -3 602 -3 634 -7 784 -5 624 -8 393 -7 909
- Intl. marine bunkers 1 183 e 1 800 1 526 928 657 543 490 545
+ Stock changes - 981 3 083 -1 528 - 932 1 079 138 819 - 172
TOTAL SUPPLY 78 057
e
87 142 87 102 76 377 98 900 94 271 88 487 92 743
Refinery intake 82 996 88 804 92 908 84 116 100 367 96 226 93 503 94 752
Refinery output 82 322 88 487 92 595 84 186 102 987 99 203 96 299 98 537
LPG + ethane 1 325 1 641 1 932 1 716 1 878 1 821 1 739 1 844
Naphtha 1 497 3 107 3 424 3 797 3 767 3 489 2 307 4 014
Kerosenes 5 139 6 516 5 441 5 491 5 568 5 525 5 160 4 429
Gasolines 23 998 27 171 29 890 27 015 32 721 30 200 30 680 30 768
Gas/diesel oil 22 731 22 961 24 962 22 670 31 223 30 873 30 426 31 409
Fuel oil 19 887 18 256 17 159 8 223 8 407 7 870 6 366 6 713
Other products 7 745 8 835 9 787 15 274 19 423 19 425 19 621 19 360
- Refinery losse
s
674 317 313 - 70 -2 620 -2 977 -2 796 -3 785
+ Returns 344 185 468 1 203 2 993 2 819 2 764 3 378
- Statistical differences -4 979 e - 489 - 818 61 3 003 - 78 -2 270 946
TOTAL CONSUMPTION 82 706 87 499 88 075 77 589 101 510 100 145 96 317 98 960
Transformation and energy 8 341 10 112 9 940 10 604 12 710 12 303 12 742 ..
Crude oil 120 8 20 5 .. .. .. ..
LPG + ethane 65 95 275 68 23 29 26 ..
Gas/diesel oil 389 484 460 283 155 121 99 ..
Fuel oil 4 761 4 883 4 604 4 220 2 067 1 859 1 704 ..
Petroleum coke 64 882 895 2 175 4 658 4 804 4 994 ..
Othe
r
2 942 3 760 3 686 3 853 5 807 5 490 5 919 ..
Transport 31 841 37 794 40 622 38 904 51 557 51 612 50 796 ..
Motor gasolin
e
23 545 27 219 28 279 24 948 31 014 30 698 31 105 ..
Gas/diesel oil 4 359 6 535 7 583 8 199 13 601 13 980 13 681 ..
Subtotal 27 904 33 754 35 862 33 147 44 615 44 678 44 786 ..
Aviation fuels 2 784 3 340 3 728 4 120 5 567 5 560 4 809 ..
Othe
r
1 153 700 1 032 1 637 1 375 1 374 1 201 ..
Industry 21 261 20 982 20 603 16 909 21 573 20 568 17 998 ..
Naphtha 1 710 2 883 2 895 2 813 3 534 3 465 2 218 ..
LPG + ethane 390 665 858 3 245 7 653 7 202 7 457 ..
Gas/diesel oil 4 472 3 637 3 990 2 474 3 589 3 454 2 339 ..
Fuel oil 9 383 8 160 7 323 3 677 1 843 1 370 1 026 ..
Othe
r
5 306 5 637 5 537 4 700 4 954 5 077 4 958 ..
Other 21 263 18 611 16 910 11 172 15 670 15 662 14 781 ..
Gas/diesel oil 13 700 13 610 12 616 8 836 10 296 9 990 9 169 ..
Fuel oil 3 893 2 094 1 808 307 1 188 1 225 1 296 ..
Othe
r
3 670 2 907 2 486 2 029 4 186 4 447 4 316 ..
Memo: Non-energy use 7 446 9 248 9 296 10 985 18 369 18 054 16 973 ..
Chem/petchem. feedst. 1 901 3 433 3 502 5 628 10 397 9 806 8 876 ..
Other 5 545 5 815 5 794 5 357 7 972 8 248 8 097 ..
1. Includes inputs from other sources.
Source: Annual Oil Statistics.
INTERNATIONAL ENERGY AGENCY

OIL INFORMATION (2011 Edition) - III.125
CANADA
Table 2: Supply of crude oil, NGL, feedstocks and other hydrocarbons
000 metric tons
1973 1978 1980 1990 2007 2008 2009 2010e
CRUDE OIL
Indigenous productio
n
- 70 194 64 128 68 490 101 731 100 641 95 247 96 019
+ Imports - 31 057 27 308 26 510 42 006 41 449 39 554 38 133
- Exports - 13 373 10 156 27 061 65 306 68 489 67 768 62 998
- Direct use - 8 20 5 - - - -
+ Stock change - 964 - 688 - 518 1 751 75 - 72 - 41
- Statistical differences - 624 327 - 327 3 484 - 132 -1 084 665
Refinery intake - 88 210 80 245 67 743 76 698 73 808 68 045 70 448
Closing stock level - 4 193 5 228 4 799 7 155 7 080 7 152 7 193
NATURAL GAS LIQUIDS
Indigenous productio
n
- 4 886 10 487 12 845 21 952 20 893 19 703 20 166
+ Imports - - - 37 285 187 344 553
- Exports - 3 280 4 783 7 350 10 616 10 454 10 314 9 983
- Direct use - 550 607 3 557 7 759 7 397 7 365 7 192
+ Stock change - - 291 - 328 - 132 - 26 257 247 - 330
- Statistical differences - 171 -1 120 - 566 513 453 672 859
Refinery intake - 594 5 889 2 409 3 323 3 033 1 943 2 355
Closing stock level - 1 112 1 156 990 2 040 1 783 1 536 1 866
REFINERY FEEDSTOCKS
Backflows - - ---- - -
+ Transfers - - - 5 882 5 740 4 975 5 546 4 578
+ Imports - - ---- - -
- Exports - - ---- - -
+ Stock change - - ---- - -
- Statistical differences - - - - - - - -
Refinery intake - - - 5 882 5 740 4 975 5 546 4 578
Closing stock level - - - - - - - -
OTHER HYDROCARBONS
Indigenous productio
n
- - 6 774 10 616 35 872 33 973 39 488 45 260
+ Imports - - ---- - -
- Exports - - - 2 216 19 662 17 900 19 703 25 781
- Direct use - - - - 1 034 1 089 1 227 1 497
+ Stock change - - ---- - -
- Statistical differences - - - 318 570 574 589 611
Refinery intake - - 6 774 8 082 14 606 14 410 17 969 17 371
Closing stock level - - - - - - - -
CRUDE OIL, NGL, FEEDSTOCKS AND OTHER
Indigenous productio
n
94 128 75 080 81 389 91 951 159 555 155 507 154 438 161 445
+ Backflows - - ---- - -
+ Transfers - - - 5 882 5 740 4 975 5 546 4 578
+ Imports 42 429 31 057 27 308 26 547 42 291 41 636 39 898 38 686
- Exports 55 989 16 653 14 939 36 627 95 584 96 843 97 785 98 762
- Direct use 311 558 627 3 562 8 793 8 486 8 592 8 689
+ Stock change 6 673 -1 016 - 650 1 725 332 175 - 371
- Statistical differences -2 733 795 - 793 - 575 4 567 895 177 2 135
Refinery intake 82 996 88 804 92 908 84 116 100 367 96 226 93 503 94 752
Closing stock level 5 192 5 305 6 384 5 789 9 195 8 863 8 688 9 059
Source: Annual Oil Statistics.
INTERNATIONAL ENERGY AGENCY

III.126 - OIL INFORMATION (2011 Edition)
CANADA
Table 3: Motor gasoline - supply
000 metric tons
1973 1978 1980 1990 2007 2008 2009 2010e
MOTOR GASOLINE
Refinery output 23 838 27 006 28 293 26 179 32 630 30 090 30 609 30 664
+ Imports 16 1 129 720 3 073 4 011 3 918 3 744
- Exports 388 639 494 2 841 6 284 5 525 5 815 6 377
+ Transfers - 926 943 858 1 727 1 956 2 363 2 915
+ Stock change 170 274 - 366 277 - 61 162 - 148 - 231
- Statistical differences 66 332 215 243 70 - 5 - 179 -1 615
Total consumption 23 570 27 236 28 290 24 950 31 015 30 699 31 106 32 330
Closing stock level - 3 216 3 776 2 724 1 826 1 664 1 812 2 043
Table 4: Aviation fuels - supply
000 metric tons
1973 1978 1980 1990 2007 2008 2009 2010e
AVIATION GASOLINE
Refinery output 160 165 166 94 77 71 61 56
+ Imports 13 - - 15 12 - 2 12
- Exports - - - 1 5 3 4 2
+ Transfers - 7 9 - 2 - 17 - 2 - 2 - 16
+ Stock change - 2 9 - 3 11 - 1 - 1 2 -
- Statistical differences 3 6 3 1 1 1 - 2 - 4
Total consumption 168 175 169 116 65 64 61 54
Closing stock level - 54 61 27 14 15 13 13
GASOLINE TYPE JET FUEL
Refinery output - - 1 431 742 14 39 10 48
+ Imports - - - - 34 317 42 -
- Exports - - 34 150 - - - 43
+ Transfers - - 25 - 49 - 1 - - - 1
+ Stock change - - - 16 15 1 - 1 - 1 1
- Statistical differences - - 74 2 - 1 - 1 - 6
Total consumption - - 1 332 556 48 354 52 11
Closing stock level - - 239 161 2 3 4 3
KEROSENE TYPE JET FUEL
Refinery output 2 608 3 443 2 287 3 592 4 024 4 075 3 874 3 824
+ Imports 275 24 86 633 2 274 1 800 1 310 1 415
- Exports 211 315 116 651 365 332 318 389
+ Transfers - - - 83 - 50 - 381 - 308 - 155 - 401
+ Stock change - 33 40 - 25 - 103 - 20 13 - 21 133
- Statistical differences 20 25 - 78 - 27 77 106 - 6 - 284
Total consumption 2 619 3 167 2 227 3 448 5 455 5 142 4 696 4 866
Closing stock level - 251 306 409 385 372 393 260
Source: Annual Oil Statistics.
INTERNATIONAL ENERGY AGENCY

OIL INFORMATION (2011 Edition) - III.127
CANADA
Table 5A: Gas/diesel oil - supply and consumption
000 metric tons
1973 1978 1980 1990 2007 2008 2009 2010e
Refinery output 22 731 22 961 24 962 22 670 31 223 30 873 30 426 31 409
+ Recycled products - - - - - - - -
+ Imports 695 72 83 676 1 528 3 315 1 587 738
- Exports 240 1 245 1 788 3 955 7 047 7 766 7 657 6 805
- Intl. marine bunkers 173 e 270 223 222 40 32 17 23
+ Transfers - 1 435 1 666 1 176 1 369 244 265 478
+ Stock changes - 925 1 209 - 226 - 652 - 8 - 158 169 130
- Statistical differences - 832 - 104 - 175 - 99 - 616 -1 069 - 515 -1 240
Total consumption 22 920 24 266 24 649 19 792 27 641 27 545 25 288 27 167
Transformation 309 352 372 256 125 107 83 ..
Main activity producer electricity 309 232 289 230 69 48 28 ..
Autoproducer electricity - 120 83 26 56 59 55 ..
Main activity producer CHP - - - - - - - ..
Autoproducer CHP - - - - - - - ..
Main activity producer heat - - - - - - - ..
Autoproducer heat - - - - - - - ..
Petrochemical industry - - - - - - - ..
Other transformation - - - - - - - ..
Energy industry own use 80 132 88 27 30 14 16 ..
Refinery fuel 80 132 88 27 30 14 16 ..
Other energy industry - - - - - - - ..
Final consumption 22 531 23 782 24 189 19 509 27 486 27 424 25 189 ..
Transport
4 359 6 535 7 583 8 199 13 601 13 980 13 681 ..
Aviation - - - - - - - ..
Road 1 642 3 677 4 608 5 388 10 824 11 197 11 056 ..
Rail 1 957 1 984 2 095 1 989 1 922 2 021 1 955 ..
Domestic navigation 760 e 867 854 809 840 746 650 ..
Non-specified - 7 26 13 15 16 20 ..
Industry
4 472 3 637 3 990 2 474 3 589 3 454 2 339 ..
Iron and steel 63 24 37 29 - - - ..
Chemical (incl. pet.-chem.) 59 13 32 8 - - - ..
Non-ferrous metals 84 18 11 12 5 4 5 ..
Non-metallic minerals 128 29 54 12 - - - ..
Transport equipment 105 - 56 - - - - ..
Machinery 22 - 26 - - - - ..
Mining and quarrying 439 741 1 118 846 1 227 1 235 1 142 ..
Food and tobacco 223 - 242 - - - - ..
Pulp, paper and printing 112 - 344 234 93 85 79 ..
Wood and wood products 128 597 640 165 414 379 273 ..
Construction - 1 080 1 047 857 897 866 691 ..
Textiles and leather - - 24 - - - - ..
Non-specified 3 109 1 135 359 311 953 885 149 ..
Other
13 700 13 610 12 616 8 836 10 296 9 990 9 169 ..
Commerce and public 2 742 3 489 2 788 3 276 6 233 6 182 6 019 ..
Residential 10 012 8 905 8 530 3 731 1 842 1 574 1 334 ..
Agriculture (incl. fishing) 946 1 216 1 298 1 829 2 221 2 234 1 816 ..
Non-specified - - - - - - - ..
Memo: Non-energy use - - - - - - - ..
Chem/petchem. feedst. - - - - - - - ..
Other - - - - - - - ..
Closing stock level - 4 902 5 543 3 152 2 177 2 335 2 166 2 036
Source: Annual Oil Statistics.
INTERNATIONAL ENERGY AGENCY