IEA Statistics. Oil Information 2011
Подождите немного. Документ загружается.

III.168 - OIL INFORMATION (2011 Edition)
DENMAR
K
* Excluding electricity trade.
** Includes hydro, geothermal, solar, wind, combustible renewables and waste, etc.
Source: Annual Energy Balances.
0
10
20
30
40
50
60
70
80
90
100
Coal Oil Gas Nuclear Other **
Percentage
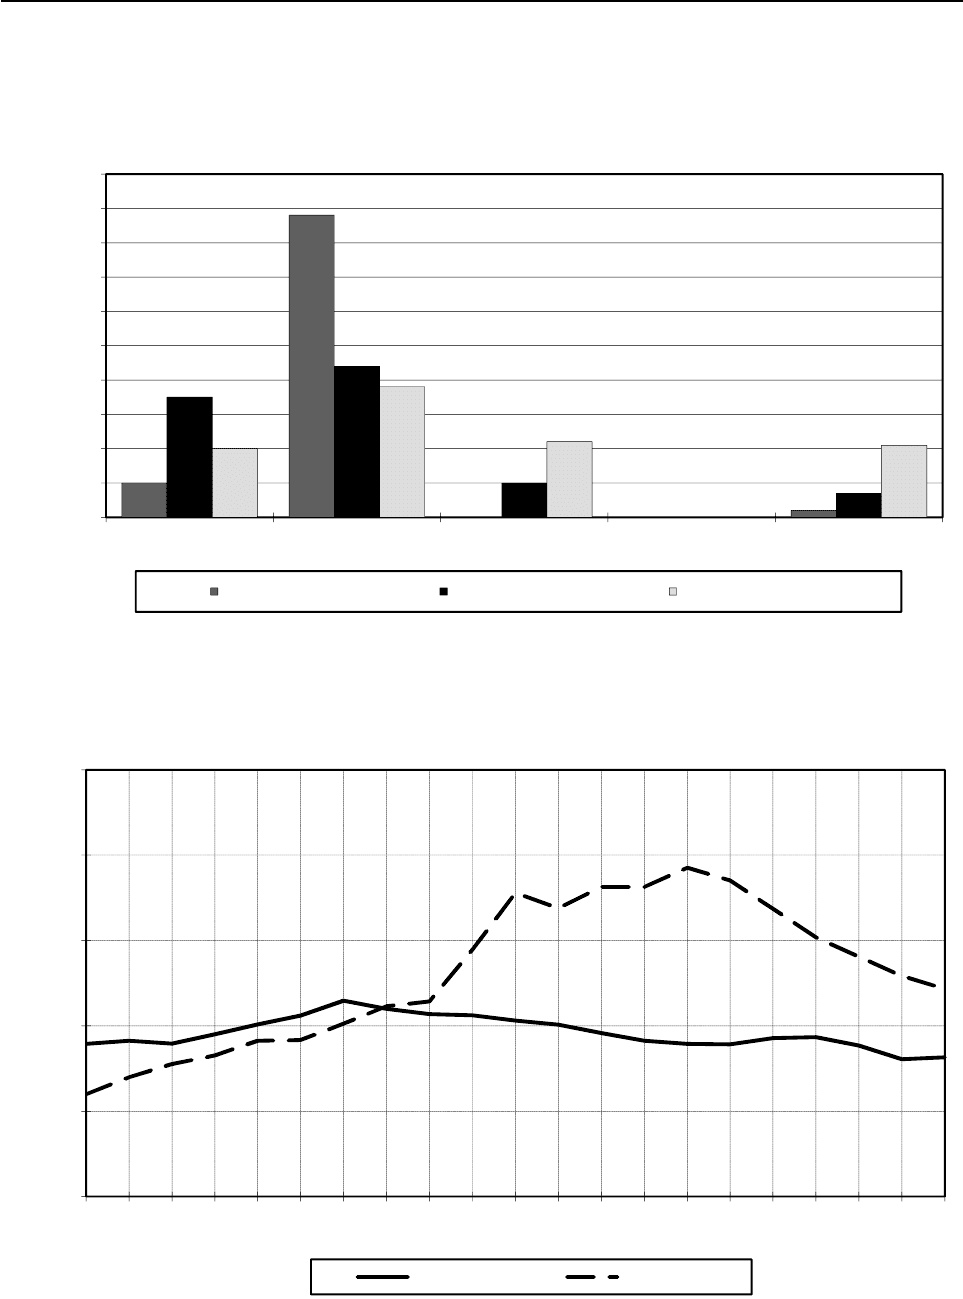
Figure 1. Fuel shares of TPES *
1973 TPES = 19 Mtoe 1990 TPES = 17 Mtoe 2010e TPES = 20 Mtoe
25
Figure 2. Oil production and consumption
*** Includes refinery fuel and international marine bunkers.
Source: Annual Oil Statistics.
0
5
10
15
20
25
1990
1991
1992
1993
1994
1995
1996
1997
1998
1999
2000
2001
2002
2003
2004
2005
2006
2007
2008
2009
2010e
Million Metric Tons
Fi
gure
2
.
Oil
pro
d
uc
ti
on an
d
consump
ti
on
Consumption *** Production
INTERNATIONAL ENERGY AGENCY

OIL INFORMATION (2011 Edition) - III.169
DENMARK
Table 1: Oil supply and consumption - summary table
000 metric tons
1973 1978 1980 1990 2007 2008 2009 2010e
Indigenous production
1
68 432 298 5 994 15 178 14 043 12 915 12 164
Crude oil - 432 298 5 994 15 169 14 035 12 903 12 147
NGL - - ---- - -
Othe
r
- - - - 9 8 12 17
+ Net imports 18 453 16 281 13 158 2 699 -6 006 -4 335 -4 433 -3 434
Crude oil, NGL, othe
r
9 760 7 681 6 355 2 008 -7 461 -6 653 -5 328 -5 065
Oil products 8 693 8 600 6 803 691 1 455 2 318 895 1 631
- Intl. marine bunkers 702 499 430 981 1 083 933 519 599
+ Stock changes - 514 - 26 127 330 152 - 700 - 308 14
TOTAL SUPPLY 17 305 16 188 13 153 8 042 8 241 8 075 7 655 8 145
Refinery intake 10 107 8 605 6 649 7 939 7 798 e 7 782 e 7 805 7 245
Refinery output 9 760 8 020 6 616 7 846 7 622 7 326 7 523 6 899
LPG + ethane 227 129 107 143 159 114 140 150
Naphtha 178 85 107 251 40 27 12 41
Kerosenes 141 94 36 325 542 500 409 407
Gasolines 1 544 1 416 1 106 1 318 1 962 1 924 2 092 1 813
Gas/diesel oil 3 551 3 304 2 789 3 290 3 198 3 098 3 308 3 044
Fuel oil 3 717 2 476 2 116 2 220 1 415 1 379 1 265 1 188
Other products 402 516 355 299 306 284 297 256
- Refinery losse
s
347 585 33 93 176 e 456 282 346
+ Returns - - - 18 4 3 2 2
- Statistical differences - 88 - 120 - 339 5 - 181 e - 297 - 145 254
TOTAL CONSUMPTION 17 046 15 723 13 459 7 962 8 250 7 919 7 520 7 547
Transformation and energy 3 060 2 686 1 650 636 639 566 630 ..
Crude oil - - ---- - ..
LPG + ethane 30 16 18 4 - - - ..
Gas/diesel oil 12 9 39 52 35 52 96 ..
Fuel oil 2 919 2 335 1 333 294 297 229 238 ..
Petroleum coke - - ---- - ..
Othe
r
99 326 260 286 307 285 296 ..
Transport 3 314 3 614 3 434 3 914 5 441 5 368 5 035 ..
Motor gasolin
e
1 526 1 726 1 505 1 545 1 797 1 710 1 623 ..
Gas/diesel oil 978 995 1 100 1 566 2 644 2 677 2 523 ..
Subtotal 2 504 2 721 2 605 3 111 4 441 4 387 4 146 ..
Aviation fuels 719 805 723 665 936 916 814 ..
Othe
r
91 88 106 138 64 65 75 ..
Industry 3 437 2 743 2 583 1 221 1 091 927 816 ..
Naphtha 186 - ---- - ..
LPG + ethane 130 93 100 56 30 29 24 ..
Gas/diesel oil 837 887 704 371 342 322 284 ..
Fuel oil 1 692 1 270 1 303 421 156 128 99 ..
Othe
r
592 493 476 373 563 448 409 ..
Other 7 235 6 680 5 792 2 191 1 079 1 058 1 039 ..
Gas/diesel oil 4 646 4 463 3 744 1 888 980 971 964 ..
Fuel oil 2 222 2 027 1 873 68 22 18 16 ..
Othe
r
367 190 175 235 77 69 59 ..
Memo: Non-energy use 727 478 432 318 322 274 262 ..
Chem/petchem. feedst. 183 - - - - - - ..
Other 544 478 432 318 322 274 262 ..
1. Includes inputs from other sources.
Source: Annual Oil Statistics.
INTERNATIONAL ENERGY AGENCY

III.170 - OIL INFORMATION (2011 Edition)
DENMARK
Table 2: Supply of crude oil, NGL, feedstocks and other hydrocarbons
000 metric tons
1973 1978 1980 1990 2007 2008 2009 2010e
CRUDE OIL
Indigenous productio
n
- 432 298 5 994 15 169 14 035 12 903 12 147
+ Imports - 7 783 5 728 4 112 2 032 2 364 3 511 2 712
- Exports - 102 36 2 769 9 402 8 656 8 557 7 686
- Direct use - - ---- - -
+ Stock change - - 86 37 - 25 - 40 8 - 88 81
- Statistical differences - - 578 - 373 32 - 39 - 31 - 36 9
Refinery intake - 8 605 6 400 7 280 7 798 7 782 7 805 7 245
Closing stock level - 603 345 440 515 507 595 514
NATURAL GAS LIQUIDS
Indigenous productio
n
- - ---- - -
+ Imports - - ---- - -
- Exports - - ---- - -
- Direct use - - ---- - -
+ Stock change - - ---- - -
- Statistical differences - - - - - - - -
Refinery intake - - - - - - - -
Closing stock level - - - - - - - -
REFINERY FEEDSTOCKS
Backflows - - ---- - -
+ Transfers - - ---- - -
+ Imports - - 1 057 674 22 120 5 7
- Exports - - 394 9 113 481 287 98
+ Stock change - - 83 6 - 12 - 45 58 - 16
- Statistical differences - - 497 12 - 103 e - 406 - 224 - 107
Refinery intake - - 249 659 - - - -
Closing stock level - - 80 115 189 234 176 192
OTHER HYDROCARBONS
Indigenous productio
n
- - - - 9 8 12 17
+ Imports - - ---- - -
- Exports - - ---- - -
- Direct use - - - - 9 8 12 17
+ Stock change - - ---- - -
- Statistical differences - - - - - - - -
Refinery intake - - - - - - - -
Closing stock level - - - - - - - -
CRUDE OIL, NGL, FEEDSTOCKS AND OTHER
Indigenous productio
n
68 432 298 5 994 15 178 14 043 12 915 12 164
+ Backflows - - ---- - -
+ Transfers - - ---- - -
+ Imports 9 799 7 783 6 785 4 786 2 054 2 484 3 516 2 719
- Exports 39 102 430 2 778 9 515 9 137 8 844 7 784
- Direct use - - - - 9 8 12 17
+ Stock change - 87 - 86 120 - 19 - 52 - 37 - 30 65
- Statistical differences - 366 - 578 124 44 - 142 - 437 - 260 - 98
Refinery intake 10 107 8 605 6 649 7 939 7 798 e 7 782 e 7 805 7 245
Closing stock level 526 603 425 555 704 741 771 706
Source: Annual Oil Statistics.
INTERNATIONAL ENERGY AGENCY

OIL INFORMATION (2011 Edition) - III.171
DENMARK
Table 3: Motor gasoline - supply
000 metric tons
1973 1978 1980 1990 2007 2008 2009 2010e
MOTOR GASOLINE
Refinery output 1 544 1 416 1 106 1 318 1 962 1 924 2 092 1 813
+ Imports 720 784 735 678 977 828 552 525
- Exports 533 495 346 459 1 121 1 062 1 144 952
+ Transfers - - - - 9 9 4 9 13
+ Stock change - 91 28 64 21 40 - 27 - 6
- Statistical differences 96 29 - 11 11 22 - 4 - 168 - 184
Total consumption 1 635 1 767 1 534 1 581 1 826 1 738 1 650 1 577
Closing stock level - 459 444 478 385 345 372 378
Table 4: Aviation fuels - supply
000 metric tons
1973 1978 1980 1990 2007 2008 2009 2010e
AVIATION GASOLINE
Refinery output - - - - - - - -
+ Imports 19 7 4 4 1 2 2 3
- Exports - - ---- - -
+ Transfers - - ---- - -
+ Stock change 3 - 1 1 - 1 1 - - -
- Statistical differences 5 1 - - - - - 3
Total consumption 17 5 5 3 2 2 2 -
Closing stock level - 3 2 2 1 1 1 1
GASOLINE TYPE JET FUEL
Refinery output - - - - - - - -
+ Imports - 143 179 - - - - -
- Exports - - ---- - -
+ Transfers - - ---- - -
+ Stock change - - ---- - -
- Statistical differences - - 18 22 - - - - -
Total consumption - 161 157 - - - - -
Closing stock level - - - - - - - -
KEROSENE TYPE JET FUEL
Refinery output 13 10 10 249 542 500 409 407
+ Imports 719 619 584 516 684 983 830 798
- Exports - - - 8 467 357 353 423
+ Transfers - - - - 48 - 1 - 3 - 5 -
+ Stock change - 6 - 10 - 28 - 38 124 - 323 - 63 94
- Statistical differences 24 - 20 5 9 - 52 - 114 6 34
Total consumption 702 639 561 662 934 914 812 842
Closing stock level - 54 72 67 108 431 494 400
Source: Annual Oil Statistics.
INTERNATIONAL ENERGY AGENCY

III.172 - OIL INFORMATION (2011 Edition)
DENMARK
Table 5A: Gas/diesel oil - supply and consumption
000 metric tons
1973 1978 1980 1990 2007 2008 2009 2010e
Refinery output 3 551 3 304 2 789 3 290 3 198 3 098 3 308 3 044
+ Recycled products - - - - - - - -
+ Imports 4 336 4 119 3 265 1 646 2 146 2 712 2 375 2 554
- Exports 852 1 032 436 868 1 103 1 016 1 188 1 010
- Intl. marine bunkers 181 186 164 272 214 263 244 216
+ Transfers - - - 2 - 6 96 - 21 4
+ Stock changes - 62 302 - 114 57 29 - 366 - 117 83
- Statistical differences 319 153 - 247 - 22 49 239 246 482
Total consumption 6 473 6 354 5 587 3 877 4 001 4 022 3 867 3 977
Transformation 12 9 39 52 35 52 96 ..
Main activity producer electricity - - - 1 9 21 21 ..
Autoproducer electricity - - - - - - - ..
Main activity producer CHP 11 8 39 6 5 7 40 ..
Autoproducer CHP - - - - 1 1 1 ..
Main activity producer heat - - - 45 19 23 33 ..
Autoproducer heat - - - - 1 - 1 ..
Petrochemical industry - - - - - - - ..
Other transformation 1 1 - - - - - ..
Energy industry own use - - - - - - - ..
Refinery fuel - - - - - - - ..
Other energy industry - - - - - - - ..
Final consumption 6 461 6 345 5 548 3 825 3 966 3 970 3 771 ..
Transport
978 995 1 100 1 566 2 644 2 677 2 523 ..
Aviation - - - - - - - ..
Road 434 578 684 1 404 2 433 2 424 2 272 ..
Rail 104 97 106 94 72 75 73 ..
Domestic navigation 440 320 310 65 123 163 152 ..
Non-specified - - - 3 16 15 26 ..
Industry
837 887 704 371 342 322 284 ..
Iron and steel 59 69 42 4 2 2 2 ..
Chemical (incl. pet.-chem.) 67 69 61 15 7 6 6 ..
Non-ferrous metals - - - 3 1 1 1 ..
Non-metallic minerals 151 145 85 37 19 17 15 ..
Transport equipment 42 38 30 12 7 7 6 ..
Machinery 201 138 139 67 44 40 36 ..
Mining and quarrying 25 15 6 15 25 22 20 ..
Food and tobacco 167 199 165 76 53 48 43 ..
Pulp, paper and printing 25 15 18 11 8 7 7 ..
Wood and wood products 42 31 24 6 6 5 5 ..
Construction - 122 98 83 150 148 127 ..
Textiles and leather 50 38 30 10 3 3 2 ..
Non-specified 8 8 6 32 17 16 14 ..
Other
4 646 4 463 3 744 1 888 980 971 964 ..
Commerce and public - 316 307 276 62 67 66 ..
Residential 3 890 3 221 2 634 1 088 455 426 408 ..
Agriculture (incl. fishing) 730 821 743 524 463 478 490 ..
Non-specified 26 105 60 - - - - ..
Memo: Non-energy use - - - - - - - ..
Chem/petchem. feedst. - - - - - - - ..
Other - - - - - - - ..
Closing stock level - 1 997 2 092 1 697 738 1 104 1 221 1 138
Source: Annual Oil Statistics.
INTERNATIONAL ENERGY AGENCY

OIL INFORMATION (2011 Edition) - III.173
DENMARK
Table 5B: Fuel oil (residual) - supply and consumption
000 metric tons
1973 1978 1980 1990 2007 2008 2009 2010e
Refinery output 3 717 2 476 2 116 2 220 1 415 1 379 1 265 1 188
+ Recycled products - - - - - - - -
+ Imports 4 959 4 228 2 481 324 1 491 1 983 1 178 2 253
- Exports 1 088 180 178 1 256 1 657 2 243 1 672 2 377
- Intl. marine bunkers 521 307 261 707 867 668 273 383
+ Transfers - - - 35 4 - 71 45 -
+ Stock changes - 379 - 375 156 233 58 38 - 110 - 277
- Statistical differences - 185 164 - 240 - 22 - 58 14 40 28
Total consumption 6 873 5 678 4 554 871 502 404 393 376
Transformation 2 919 2 246 1 244 262 277 226 236 ..
Main activity producer electricity - - - 44 15 - 1 ..
Autoproducer electricity - - - - - - - ..
Main activity producer CHP 2 919 2 198 1 196 154 228 199 206 ..
Autoproducer CHP - 48 48 31 19 18 18 ..
Main activity producer heat - - - 32 10 6 9 ..
Autoproducer heat - - - 1 5 3 2 ..
Petrochemical industry - - - - - - - ..
Other transformation - - - - - - - ..
Energy industry own use - 89 89 32 20 3 2 ..
Refinery fuel - 89 89 32 20 3 2 ..
Other energy industry - - - - - - - ..
Final consumption 3 954 3 343 3 221 577 205 175 155 ..
Transport
40 46 45 88 27 29 40 ..
Aviation - - - - - - - ..
Road - - - - - - - ..
Rail - - - - - - - ..
Domestic navigation 40 46 45 88 27 29 40 ..
Non-specified - - - - - - - ..
Industry
1 692 1 270 1 303 421 156 128 99 ..
Iron and steel 102 88 77 1 - - - ..
Chemical (incl. pet.-chem.) 169 126 142 59 10 9 7 ..
Non-ferrous metals - - - 1 1 1 1 ..
Non-metallic minerals 508 290 270 67 33 28 22 ..
Transport equipment 34 25 26 4 - - - ..
Machinery 85 76 64 19 7 6 4 ..
Mining and quarrying 17 25 26 9 7 6 4 ..
Food and tobacco 557 504 553 183 90 70 55 ..
Pulp, paper and printing 118 63 52 25 4 4 3 ..
Wood and wood products 34 25 26 11 3 3 2 ..
Construction - 10 15 25 - - - ..
Textiles and leather 68 38 52 11 - - - ..
Non-specified - - - 6 1 1 1 ..
Other
2 222 2 027 1 873 68 22 18 16 ..
Commerce and public - 196 193 26 6 2 1 ..
Residential 1 939 1 596 1 430 5 - - - ..
Agriculture (incl. fishing) 276 226 242 37 16 16 15 ..
Non-specified 7 9 8 - - - - ..
Memo: Non-energy use - - - - - - - ..
Chem/petchem. feedst. - - - - - - - ..
Other - - - - - - - ..
Closing stock level - 3 202 2 697 1 409 518 480 590 867
Source: Annual Oil Statistics.
INTERNATIONAL ENERGY AGENCY

III.174 - OIL INFORMATION (2011 Edition)
DENMARK
Table 5C: Total products - supply and consumption
000 metric tons
1973 1978 1980 1990 2007 2008 2009 2010e
Refinery output 9 760 8 020 6 616 7 846 7 622 7 326 7 523 6 899
+ Recycled products - - - 18 4 3 2 2
+ Imports 11 514 10 576 7 935 3 682 5 971 7 097 5 378 6 553
- Exports 2 821 1 976 1 132 2 991 4 516 4 779 4 483 4 922
- Intl. marine bunkers 702 499 430 981 1 083 933 519 599
+ Transfers - - - - 9 8 12 17
+ Stock changes - 427 60 7 349 204 - 663 - 278 - 51
- Statistical differences 278 458 - 463 - 39 - 39 140 115 352
Total consumption 17 046 15 723 13 459 7 962 8 250 7 919 7 520 7 547
Transformation 3 060 2 377 1 360 335 313 279 332 ..
Main activity producer electricity - - - 45 24 21 22 ..
Autoproducer electricity - - - - - - - ..
Main activity producer CHP 2 930 2 206 1 235 160 233 206 246 ..
Autoproducer CHP - 48 48 31 20 19 19 ..
Main activity producer heat - - - 94 30 30 42 ..
Autoproducer heat - - - 1 6 3 3 ..
Petrochemical industry - - - - - - - ..
Other transformation 130 123 77 4 - - - ..
Energy industry own use - 309 290 301 326 287 298 ..
Refinery fuel - 309 290 301 326 287 298 ..
Other energy industry - - - - - - - ..
Final consumption 13 986 13 037 11 809 7 326 7 611 7 353 6 890 ..
Transport
3 314 3 614 3 434 3 914 5 441 5 368 5 035 ..
Aviation 719 805 723 631 897 897 789 ..
Road 2 010 2 345 2 250 2 994 4 257 4 160 3 920 ..
Rail 104 97 106 97 75 78 76 ..
Domestic navigation 481 367 355 155 157 199 199 ..
Non-specified - - - 37 55 34 51 ..
Industry
3 437 2 743 2 583 1 221 1 091 927 816 ..
Iron and steel 174 165 130 11 4 4 4 ..
Chemical (incl. pet.-chem.) 459 204 211 79 18 16 14 ..
Non-ferrous metals - - - 8 3 3 3 ..
Non-metallic minerals 710 477 432 212 350 270 231 ..
Transport equipment 81 66 59 19 7 7 7 ..
Machinery 313 231 225 109 65 60 53 ..
Mining and quarrying 42 40 32 36 35 31 27 ..
Food and tobacco 756 719 729 280 153 128 107 ..
Pulp, paper and printing 146 81 74 39 14 13 13 ..
Wood and wood products 81 57 52 23 10 9 8 ..
Construction 373 474 424 339 410 364 330 ..
Textiles and leather 120 80 85 25 3 4 3 ..
Non-specified 182 149 130 41 19 18 16 ..
Other
7 235 6 680 5 792 2 191 1 079 1 058 1 039 ..
Commerce and public - 516 507 319 75 77 73 ..
Residential 6 068 4 950 4 184 1 249 504 473 450 ..
Agriculture (incl. fishing) 1 134 1 097 1 030 623 500 508 516 ..
Non-specified 33 117 71 - - - - ..
Memo: Non-energy use 727 478 432 318 322 274 262 ..
Chem/petchem. feedst. 183 - - - - - - ..
Other 544 478 432 318 322 274 262 ..
Closing stock level - 5 843 5 496 3 839 1 876 2 539 2 817 2 868
Source: Annual Oil Statistics.
INTERNATIONAL ENERGY AGENCY

OIL INFORMATION (2011 Edition) - III.175
DENMARK
Table 6A: Supply and consumption
000 metric tons
1990 2008 2009 2010e 1990 2008 2009 2010e
LPG AND ETHANE REFINERY GAS
Refinery output 143 114 140 150 272 284 297 256
+ Recycled products - - - - - - - -
+ Imports 16 15 5 7 - - - -
- Exports 66 69 96 110 - - - -
- Intl. marine bunkers - - - - - - - -
+ Transfers - - - - - - - -
+ Stock change 4 - 3 1 - - - -
- Statistical difference - 2 2 1 - 4 - 1 - 1 - 9
Total consumption 99 58 51 52 273 284 296 265
of which: ethane - - - - - - - -
Transformation 4 - - .. - - - ..
Energy industry own use - - - .. 269 284 296 ..
Transport 10 4 3 .. - - - ..
Industry 56 29 24 .. 4 - - ..
Other 29 25 24 .. - - - ..
Memo: Non-energy use - - - .. - - - ..
Closing stock level 9 8 5 4 - - - -
NAPHTHA OTHER KEROSENE
Refinery output 251 27 12 41 76 - - -
+ Recycled products - - - - - - - -
+ Imports - - - - 45 - - -
- Exports 251 5 11 38 23 - - -
- Intl. marine bunkers - - - - - - - -
+ Transfers - 1 - 21 - 20 - 24 3 4 -
+ Stock change 1 - 2 - 1 - 2 1 - - -
- Statistical difference - - 1 - 20 1 7 1 2 -
Total consumption - - - - 116 2 2 -
Transformation - - - .. - - - ..
Energy industry own use - - - .. - - - ..
Transport - - - .. 10 - - ..
Industry - - - .. - - - ..
Other - - - .. 106 2 2 ..
Memo: Non-energy use - - - .. - - - ..
Closing stock level 1 4 5 7 34 - - -
WHITE SPIRIT + SBP LUBRICANTS
Refinery output - - - .. - - - ..
+ Recycled products - - - .. - - - ..
+ Imports 24 11 12 .. 89 59 55 ..
- Exports - 2 1 .. 11 2 2 ..
- Intl. marine bunkers - - - .. 2 2 2 ..
+ Transfers - 1 - - .. - - - ..
+ Stock change 1 - - .. - 3 - - ..
- Statistical difference 2 - - .. - 7 - - ..
Total consumption 22 9 11 .. 80 55 51 ..
Transformation - - - .. - - - ..
Energy industry own use - - - .. - - - ..
Transport - - - .. 30 32 32 ..
Industry 22 9 11 .. 35 12 12 ..
Other - - - .. 15 11 7 ..
Memo: Non-energy use 22 9 11 .. 80 55 51 ..
Closing stock level 3 - - .. 32 4 4 ..
Source: Annual Oil Statistics.
INTERNATIONAL ENERGY AGENCY

III.176 - OIL INFORMATION (2011 Edition)
DENMARK
Table 6B: Supply and consumption
000 metric tons
1990 2008 2009 2010e 1990 2008 2009 2010e
BITUMEN PARAFFIN WAXES
Refinery output 27 - - .. - - - ..
+ Recycled products - - - .. - - - ..
+ Imports 199 209 206 .. - - - ..
- Exports 10 8 4 .. - - - ..
- Intl. marine bunkers - - - .. - - - ..
+ Transfers - - - .. - - - ..
+ Stock change - 1 8 4 .. - - - ..
- Statistical difference - 1 - 1 6 .. - - - ..
Total consumption 216 210 200 .. - - - ..
Transformation - - - .. - - - ..
Energy industry own use - - - .. - - - ..
Transport - - - .. - - - ..
Industry 216 210 200 .. - - - ..
Other - - - .. - - - ..
Memo: Non-energy use 216 210 200 .. - - - ..
Closing stock level 34 19 15 .. - - - ..
PETROLEUM COKE OTHER PRODUCTS
Refinery output - - - - - - - -
+ Recycled products - - - - 18 3 2 2
+ Imports 141 295 163 120 - - - 293
- Exports 39 15 12 12 - - - -
- Intl. marine bunkers - - - - - - - -
+ Transfers - 2 - - - - - - -
+ Stock change 31 - 58 33 58 - - - - 2
- Statistical difference - 14 2 - 1 1 1 2 2 -
Total Consumption 145 220 185 165 17 1 - 293
Transformation - - - .. 17 1 - ..
Energy industry own use - - - .. - - - ..
Transport - - - .. - - - ..
Industry 92 216 185 .. - - - ..
Other 53 4 - .. - - - ..
Memo: Non-energy use - - - .. - - - ..
Closing stock level 73 143 110 52 - - - 21
Source: Annual Oil Statistics.
INTERNATIONAL ENERGY AGENCY

OIL INFORMATION (2011 Edition) - III.177
DENMARK
Table 7A: Imports by country of origin
000 metric tons
2008 2009 2010e 2008 2009 2010e 2008 2009 2010e
Crude oil Natural gas liquids Feedstocks and other
Australia - - - - - - - - -
Bel
g
ium - - - - - - - - -
Canada - - - - - - - - -
Czech Re
p
ubli
c
- - - - - - - - -
Denmark - - - - - - - - -
Finland - - - - - - - - -
France - - - - - - - - -
German
y
- - - - - - - - -
Greece - - - - - - - - -
Hun
g
ar
y
- - - - - - - - -
Ireland - - - - - - - - -
Ital
y
- - - - - - - - -
Ja
p
an - - - - - - - - -
Korea - - - - - - - - -
Mexic
o
- - - - - - - - -
Netherlands - - 78 - - - 2 - -
New Zealand - - - - - - - - -
Norwa
y
2 352 3 021 1 631 - - - - - -
Poland - - - - - - - - -
S
p
ain - - - - - - - - -
Sweden - - - - - - 45 3 7
Turke
y
- - - - - - - - -
United Kin
g
dom 12 490 737 - - - 73 2 -
United States - - - - - - - - -
Othe
r
- - - - - - - - -
OECD 2 364 3 511 2 446 - - - 120 5 7
Ar
g
entina - - - - - - - - -
Brazil - - - - - - - - -
Colombia - - - - - - - - -
Ecuado
r
- - - - - - - - -
Netherlands Antilles - - - - - - - - -
Peru - - - - - - - - -
Trinidad and Toba
go
- - - - - - - - -
Venezuela - - - - - - - - -
Othe
r
- - - - - - - - -
Latin America - - - - - - - - -
Kazakhstan - - - - - - - - -
Russian Federation - - 36 - - - - - -
Other - - - - - - - - -
Non-OECD Europe/Eurasia
- - 36 - - - - - -
Iran - - - - - - - - -
Ira
q
- - - - - - - - -
Kuwai
t
- - - - - - - - -
Oman - - - - - - - - -
Qata
r
- - - - - - - - -
Saudi Arabia - - - - - - - - -
United Arab Emirates - - - - - - - - -
Othe
r
- - - - - - - - -
Middle East - - - - - - - - -
India - - - - - - - - -
Indonesi
a
- - - - - - - - -
Sin
g
a
p
ore - - - - - - - - -
Othe
r
- - - - - - - - -
Asia - - - - - - - - -
China - - - - - - - - -
Al
g
eria - - 170 - - - - - -
An
g
ola - - - - - - - - -
Cameroon - - - - - - - - -
E
gypt
- - - - - - - - -
Gabon - - - - - - - - -
Lib
y
an Arab Jamahiri
y
a - - - - - - - - -
Ni
g
eria - - - - - - - - -
Tunisia - - - - - - - - -
Othe
r
- - - - - - - - -
Africa - - 170 - - - - - -
Non-spec./other - - 60 - - - - - -
Total imports 2 364 3 511 2 712 - - - 120 5 7
Memo: Total OPEC - - 170 - - - - - -
Source: Annual Oil Statistics.
INTERNATIONAL ENERGY AGENCY