Hooke R.L. Principles of glacier mechanics
Подождите немного. Документ загружается.

The steady-state temperature profile 121
is θ
s
. (Note that in this case, rather than solve Equation (6.19)asan
indefinite integral and then evaluate a constant of integration by applying
a boundary condition, it is more convenient to express the integrals as
definite integrals. Thus the boundary condition, θ = θ
s
on z = H,is
incorporated into the limits of integration. Further discussion of this
boundary condition is deferred for the moment.)
The integral on the right-hand side of Equation (6.20) does not have
a solution in closed form. However, it occurs frequently, and thus has
been tabulated. In addition, many computer statistical packages have
solutions. The challenge is to express it in the terms used in these tables.
We first express the integral on the right-hand side as the difference
between integrals over the range 0 → H and 0 → h, thus:
θ
s
− θ (h) = β
o
H
0
e
−ζ
2
z
2
dz −
h
0
e
−ζ
2
z
2
dz
(6.21)
and then make the substitution: ζ z = t,whence dz = dt/ζ , and t = ζ h
on z = h.Wealso multiply and divide by
√
π/2, thus:
θ
s
− θ (h) =
√
π
2
β
o
ζ
2
√
π
ζ H
0
e
−t
2
dt −
2
√
π
ζ h
0
e
−t
2
dt
(6.22)
By definition:
erf (x ) =
2
√
π
x
0
e
−t
2
dt (6.23a)
where erf (x)iscalled the error function of x. Thus, our final solution for
the temperature, θ(h), at depth h is:
θ(h) = θ
s
−
√
π
2
β
o
ζ
[
erf (ζ H ) − erf (ζ h)
]
(6.24)
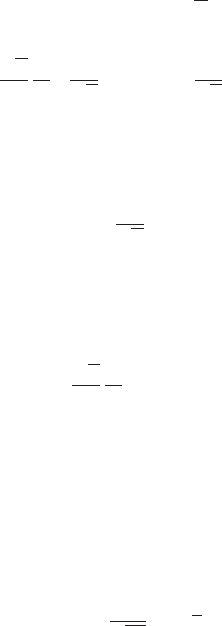
As noted, erf (x) has been tabulated, so values of it can be looked
up, much as can values of a sine or cosine. Caution is required, how-
ever, as some tables define erf (x) slightly differently than we have in
Equation (6.23a), and thus require a different set of substitutions in
Equation (6.21). A common alternative definition is:
erf (x ) =
1
√
2π
x
0
e
−
t
2
2
dt (6.23b)
122 Temperature distribution in polar ice sheets
1.5
1.0
0
.5
0
1234 5
x
erf
(x)
E
(x)
0
Figure 6.5. Values of the
error function, erf (x), as
defined by Equation (6.23c),
and of Dawson’s integral, E(x),
for a typical range of values
of x = ζH. (Modified from
Budd, 1969, Figure 4.10.
Reproduced with permission
of the Australian Antarctic
Division.)
which requires the substitution: ζ z = t/
√
2. This leads to other changes
in Equations (6.22) and (6.24). Budd (1969) uses a less common defini-
tion, namely:
erf (x ) =
x
0
e
−t
2
dt (6.23c)
and has plotted this (Figure 6.5) along with another function that arises
in calculations of temperature distributions in ice sheets. With this defi-
nition, Equation (6.22) can be written:
θ(h) = θ
s
−
β
o
ζ
[
erf (ζ H ) − erf (ζ h)
]
(6.25)
In applying Equation (6.24)or(6.25), note that β
o
is negative in the
coordinate system of Figure 6.4.
The boundary condition at the surface
As noted, the boundary condition at the surface, z = H,isthe ice tem-
perature, θ
s
, and this must be known in order to calculate a temperature
profile from Equations (6.24)or(6.25). Below, we will show that the
temperature at a depth of about 10 m in a glacier is very close to the
mean annual atmospheric temperature, θ
a
,soitisnormally assumed
that θ
s
= θ
a
.However, it may be well to note some situations in which
this approximation is not very good.
Temperatures in the ablation zones of some glaciers may be some-
what warmer than the mean annual temperature. This is because snow
insulates the ice during the winter, preventing cooling. In addition, per-
colating meltwater reaches the snow/ice interface soon after melting
starts in the spring, thus warming the ice faster than would be the case
with conduction alone. On Barnes Ice Cap, these two effects result in

The steady-state temperature profile 123
near-surface ice temperatures that are about 2
◦
C above the mean annual
temperature (Hooke et al., 1983).
Somewhat higher on a glacier, near and above the equilibrium line,
percolating meltwater can penetrate into the firn of prior years. When
this water refreezes the heat of fusion is released at a significant depth
in the glacier, not just at the snow/ice interface. The warming effect is
thus much enhanced, and ice temperatures in this zone may be several
degrees warmer than the mean annual temperature.
At high latitudes and altitudes on polar ice sheets, the ice temperature
may be slightly below the mean annual temperature because radiative
cooling during the clear winter night is more effective than heating during
the summer day.
Further discussion of these effects and additional references may be
found in Hooke et al.(1983).
Melting and freezing at the bed
In our analysis so far, we have tacitly assumed that the temperature at the
base of the glacier is below the melting point. However, this assumption
has not been incorporated into Equation (6.24)or(6.25). To be specific,
if the bed is at the pressure melting point and melting is occurring there,
some of the geothermal heat is clearly being used for that purpose and
is not being conducted upward into the ice. Thus, our estimate of β
o
is
likely to be too high. If we inadvertently insert such a value of β
o
into
Equation (6.24)or(6.25), the calculated temperature at the bed, θ
o
, will
turn out to be greater than the pressure melting temperature which is
clearly impossible.
To obtain a correct solution for the temperature profile in this case, β
o
must be adjusted downward. The procedure is straightforward. Because
erf (0) = 0 and θ (0) = θ
pmp
, then at the pressure melting point temper-
ature, Equation (6.24) can be solved for β
o
, thus:
β
o
=
2ζ
√
π
(θ
s
− θ
pmp
)
erf (ζ H )
(6.26)
The melting point is depressed approximately 0.098 K MPa
−1
(if the
water produced is saturated with air) so, for example, θ
pmp
under 500 m
of ice would be ∼−0.4
◦
C. Inserting the value of β
o
obtained from
Equation (6.26) into Equation (6.24) and solving for temperatures at
other depths in the glacier will give the desired temperature profile.
(Note that this approach is equivalent to solving Equation (6.17) with a
temperature boundary condition at the bed.)
The basal melt rate, dm/dt, can also be calculated. The heat available
for melting is the difference between the geothermal heat flux and the

124 Temperature distribution in polar ice sheets
heat flux into the ice, or K (β
G
− β
o
), where β
G
is the gradient that
would be required to conduct the geothermal flux upward into the ice.
Thus, we obtain:
dm
dt
= K
(β
G
− β
o
)
L
∼
=
220(β
G
− β
o
)mma
−1
(6.27)
where L is the latent heat of fusion, and the result is in mm a
−1
if the
gradients are in K m
−1
.
It is also possible that water formed by basal melting at some dis-
tant locality has moved along the bed to the site at which the tempera-
ture profile is to be calculated. Until all such water is refrozen, perhaps
incorporating sediment into the ice in the process, it will keep the basal
temperature at the pressure melting point. Again, Equation (6.24) does
not know about this water, so the intelligent scientist must intervene.
Presumably, he or she has calculated basal melt and freeze rates further
upglacier, and has kept track of how much of the water produced has not
refrozen. In any case, the procedure is similar to that above, except that
now the value of β
o
calculated from Equation (6.26) will be greater than
that necessary to conduct the geothermal heat upward into the ice, and
dm/dt in Equation (6.27) will be negative, indicating freezing.
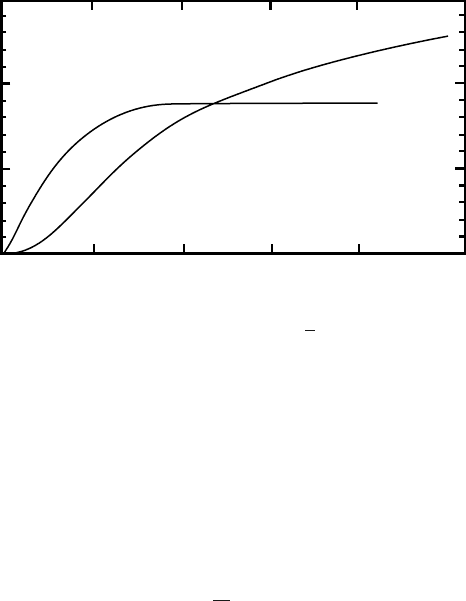
Character of the temperature profile
Several temperature profiles calculated from Equation (6.24) are shown
in Figure 6.6a.For the conditions assumed, the ice is nearly isothermal
in the upper few hundred meters and then warms rapidly near the bed.
Higher vertical velocities, resulting from higher accumulation rates at
the surface, increase the thickness of the isothermal zone and decrease
the basal temperature.
In essence, cold ice is advected downward from the surface, and
the upward-moving geothermal heat warms this descending ice. With
higher rates of advection (higher vertical velocities), the heat supplied
can warm a smaller fraction of the descending ice, so the ice column as
awhole is colder.
The shape of the temperature profile can be understood qualitatively
in the following way. Consider the three elements of ice labeled A, B,
and C in Figure 6.7. All three are moving downward, but because w
decreases with depth (Equation (6.15)), element A will be moving fastest
and element C slowest. As element C moves down, it must warm up and
this requires heat. Thus, the heat flux out of the top of this element will
be less than that into the bottom, and the temperature gradient required
to conduct this heat will be less at the top of the element than at the
bottom. However, w is small in this part of the glacier, so despite the
The steady-state temperature profile 125
Height above bed, m
−30 −20 −10
−30 −20 −10
−0.10
−0.50
−0.25
−0.50
(a) (b)
Figure 6.6. Calculated temperature profiles in polar ice sheets.
(a) Accumulation zone. Vertical velocity is negative or downward. Parameters,
other than w, are the same for all curves. Dashed profile labeled “R: w =−0.50”
is calculated from Equation (5.25) for w. (b) Ablation zone. Vertical component
of velocity is positive or upward. (Modified from Hooke (1977), Figure 3.
Reproduced with permission of The University of Washington.)
comparatively high temperature gradient here, this element does not
have to warm up very much and the change in temperature gradient
through it is small, as shown. Element B has a higher velocity, and the
temperature gradient is still comparatively high here, at mid-depth in
the glacier, so this element must warm up a lot. Thus, here the change
in temperature gradient through the element is rather large. Element A
has the highest vertical velocity, but at this level in the glacier nearly
all of the heat introduced at the base has been consumed in warming
deeper ice. Thus, the temperature gradient here is quite low, and despite
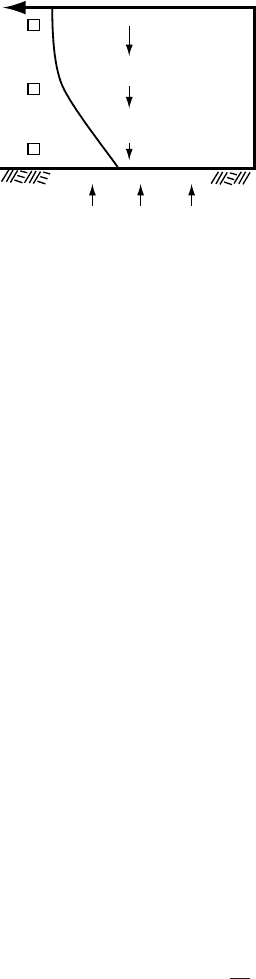
126 Temperature distribution in polar ice sheets
w
Geothermal
heat
Bed
Depth
Surface
0
o
CCold
A
B
C
Figure 6.7. Qualitative
illustration of effect of
downward vertical velocity
on a temperature profile.
its high velocity, element A does not have to warm up very much. Thus,
again, the change in temperature gradient through the element is small,
as shown.
Later we will examine temperature profiles in the ablation area,
where the vertical velocity is upward. However, the reader may find
it both challenging and instructive to try to deduce the character of the
profile there, using the logic just presented.
Error introduced by the assumed vertical
velocity distribution
One of the most tenuous assumptions we made in deriving
Equation (6.24)was that the longitudinal strain rate, ∂u/∂x,was inde-
pendent of depth. This led to the use of a linear decrease in w with
depth (Equation (6.15)) in Equation (6.16). As discussed in Chapter 5,
we know that ∂u/∂x decreases with depth under most conditions. Early
attempts to use a more realistic relation for w were made by Philberth
and Federer (1971) and Budd et al.(1971), but they relied on ad hoc
relations without good theoretical basis.
It would be convenient if we could simply use either Equation (5.24)
or Equation (5.25) for w,but this leads to solutions for β that cannot be
integrated a second time. Thus, a numerical integration is necessary.
To illustrate the importance of this effect, let us use Equation (5.25)in
place of Equation (5.21) for w. The solution for the temperature gradient
is then:
dθ
dz
= β
o
e
−ξ z
3
(6.28)
where ξ = b
n
/3κH
2
. Integrating this numerically with w = b
n
=−0.5ma
−1
yields the dashed curve in Figure 6.6a. Thus, using this

Temperature profiles near the surface of an ice sheet 127
more realistic expression for w leads to basal temperatures that are nearly
10
◦
Cwarmer than given by Equation (6.24) for otherwise similar con-
ditions!
Temperature profiles in the ablation zone
In the ablation area, except very near the equilibrium line, w is posi-
tive, or upward. In this case, the solution for the temperature gradient
becomes:
dθ
dz
= β
o
e
ζ
2
z
2
(6.29)
Again, this equation cannot be integrated in closed form, and the inte-
gral has not been tabulated. Examples of profiles obtained by a numerical
integration are shown in Figure 6.6b.Ofparticular interest is the expo-
nential increase in gradient near the surface, a result that is apparent
from Equation (6.29). A consequence of this behavior is that basal tem-
peratures must commonly reach the melting point in the ablation zone,
even with modest ice thicknesses and vertical velocities. Furthermore,
when basal temperatures do reach the melting point, β
o
becomes small,
so most of the geothermal heat is trapped at the bed resulting in high
basal melt rates.
Temperature profiles near the surface
of an ice sheet
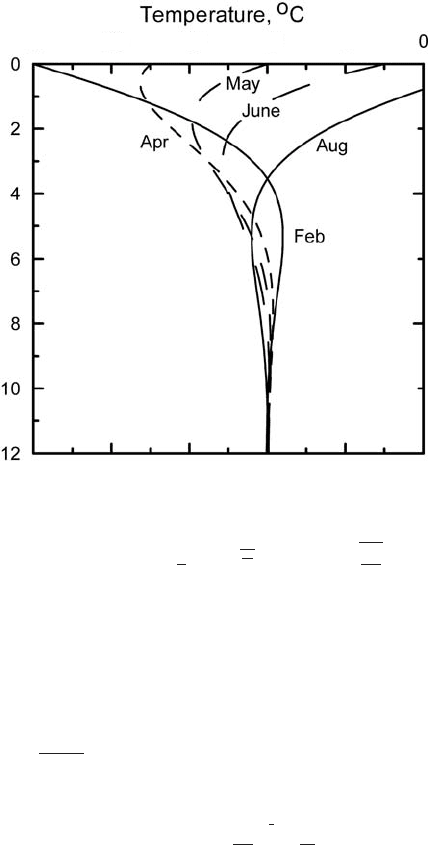
Earlier (p. 122) we noted that although the temperature at the surface, θ
s
,
varies seasonally, the temperature at a depth of ∼10 m is very close to the
mean annual temperature. Let us now verify this. We adopt a coordinate
system with z = 0atthe surface and the z-axis pointing downward.
At the surface we assume that the seasonal variation can be described
by θ(z = 0, t) =
1
2
θ
r
sin(ωt), where θ
r
is the annual temperature range
(twice the amplitude). Beneath the surface, we expect the oscillations
to be damped. Let the annual temperature range at depth be denoted by
(z) = θ
max
(z) − θ
min
(z). Our goal is to calculate the depth at which
decreases to an acceptably small value. Then, we can measure the
temperature at this depth and use it as our boundary condition at the
surface.
Ignoring horizontal gradients, strain heating, and vertical advection
(so there is no accumulation, ablation, or compaction), Equation (6.13)
simplifies to:
∂θ(z, t)
∂t
= κ
∂
2
θ(z, t )
∂z
2
(6.30)
128 Temperature distribution in polar ice sheets
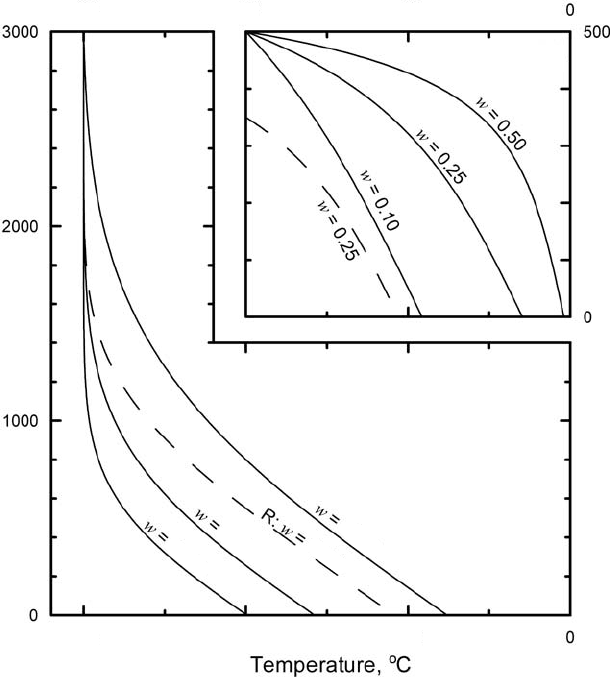
Depth, m
−25 −20 −15 −10 −5
Figure 6.8. Seasonal
variation in near-surface
temperature profiles in the
dry-snow zone of an ice sheet.
The solution to this is:
θ(z, t ) =
1
2
θ
r
e
−z
√
ω
2κ
sin
ωt − z
ω
2κ
(6.31)
where ω is the period of the variation (in this case, 2 radians per year)
(Carslaw and Jaeger, 1959,p.65). If the seasonal variation in temperature
at the surface is sinusoidal, the temperature profile at any given time
during the year can be calculated from Equation (6.31). Some profiles
for representative times are shown in Figure 6.8.
Now at any given depth, θ
max
(z,t) and θ
min
(z,t) occur when
ωt − z
ω/2κ =±/2, respectively. Thus, using Equation (6.31)to
obtain θ(z,t)atthese two times, and solving for z yields:
z =
2κ
ω
1
2
ln
θ
r
(6.32)
From this we find that z = 10 m if κ = 16 m
2
a
−1
,avalue appropriate
for unpacked snow, and is 1.2% of θ
r
.Inice, with κ = 37.2 m
2
a
−1
,
z = 15.2 m. Thus, temperatures measured at a depth of 10 m in snow
and firn or 15 m in ice should closely approximate the mean annual
temperature.
The most serious assumption in this calculation is that accumulation
and ablation can be ignored. In the accumulation area, accumulating
snow insulates the surface, reducing θ
r
. This is probably not too serious
a problem. However, in the ablation area, as noted earlier, there is not

Temperature profiles near the surface of an ice sheet 129
only the insulating effect of snow during the fall and winter, but also
warming by percolating meltwater in the late spring or early summer
and then lowering of the ice surface later in the summer. Combined,
these processes result in 15 m temperatures that are likely to be warmer
than the mean annual temperature, as noted.
Equation (6.32) can also be used to calculate effects of temperature
oscillations over longer time spans. For example, oxygen isotope vari-
ations in ice cores have revealed temperature cycles during the Pleis-
tocene that have a range ∼5
◦
C and a period of ∼2000 years. These
cycles were discovered by Dansgaard and Oeschger (1989) and are called
Dansgaard–Oeschger cycles (see also Dansgaard et al., 1993). Their
cause is not yet understood. With κ = 38 m
2
a
−1
,avalue appropriate
for ice at −10
◦
C, and a more liberal of 0.05θ
r
, z = 466 m. Thus,
such cycles would affect basal temperatures significantly only near the
margin where the ice was less than ∼500 m thick.
The speed, ˆw,ofpropagation of a temperature maximum or mini-
mum resulting from such a sinusoidal cycle of temperature is (2ωκ)
1/2
,
and the time lag between the maximum at the surface and the maximum
at some depth, z,isthus, z/ ˆw.Inthe case of the Dansgaard–Oeschger
cycles, the speed would be about 0.49 m a
−1
, and the signal would reach
a depth of 466 m after about 950 years.
Let us now consider the temperature profile in the firn area some
distance from an ice divide, a problem studied by Robin (1970). We
will restrict the problem to two dimensions; assume that strain heating is
negligible; and ignore conduction as K is low in firn, while the advective
terms are significant. Equation (6.13) then becomes:
∂θ
∂t
=−u
∂θ
∂x
− w
∂θ
∂z
(6.33)
∂θ/∂t may be thought of as being composed of two parts, a thickening
or thinning of the ice sheet with time, and climatic change, thus:
∂θ
∂t
= λ(˙ε
zz
H + b
n
) +
∂θ
o
∂t
Here, ε˙
zz
H represents the change in thickness of the ice sheet by flow (or
vertical strain), b
n
represents thickening by accumulation, and the differ-
ence between them is the net change in surface elevation. Multiplication
by the lapse rate, λ,orrate of decrease in temperature with increasing
elevation yields the resulting change in temperature at the glacier sur-
face. (As ε˙
zz
is normally compressive, or negative, in an accumulation
zone, ε˙
zz
H will be a negative number; b
n
is positive. If (ε˙
zz
H + b
n
) turns
out to be negative, representing net thinning, multiplication by the neg-
ative lapse rate yields a positive ∂θ/∂t.) To this is added any change in
temperature due to secular climatic change, ∂θ
o
/∂t.
130 Temperature distribution in polar ice sheets
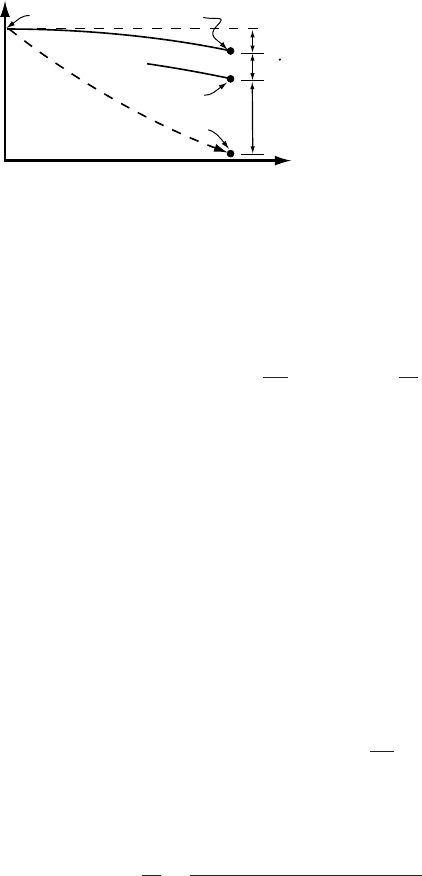
A
B
C
D
nb
n
n(e
zz
H + b
n
)
nua
x
z
Figure 6.9. Interpretation of
terms in Equation (6.34).
The expression u · ∂θ/∂x represents the change in temperature at the
glacier surface as the ice flows to lower elevations; ∂θ/∂x can thus be
replaced with αλ,where α is the surface slope of the glacier. Finally, w
is equated with the accumulation rate, b
n
. Making these substitutions in
Equation (6.33) yields:
λ(˙ε
zz
H + b
n
) +
∂θ
o
∂t
=−uαλ − b
n
∂θ
∂z
(6.34)
The meaning of the terms in Equation (6.34) can be clarified by reference
to Figure 6.9.Aparticle of snow deposited at A has moved to B after n
years, and is buried under nb
n
meters of new accumulation. In the absence
of conduction, it is still at the temperature at which it was deposited at
A. The surface above B was at C when the snow was deposited at A and,
owing to the lapse rate, snow then accumulating at C was nuαλ degrees
warmer than that which was accumulating at A.Inaddition, the ice sheet
has thinned by an amount n(ε˙
zz
H + b
n
)over the intervening years, and
the surface is now at D,which is n(ε˙
zz
H + b
n
)λ degrees warmer than C.
Finally, there may have been secular climatic warming at a rate ∂θ
o
/∂t,
so snow at D is n ∂θ
o
/∂t warmer than it would be otherwise. Thus the
surface at D is:
nuαλ + n(˙ε
zz
H + b
n
)λ + n
∂θ
o
∂t
warmer than the firn at B.Toobtain the temperature gradient from B to
D,divide by nb
n
and cancel the ns, thus:
∂θ
∂z
=
uαλ + (˙ε
zz
H + b
n
)λ +
(
∂θ
o
/∂t
)
b
n
(6.35)
which, with minor manipulation, can be shown to be the same as Equation
(6.34).
When one is far from the edge of an ice sheet, it is very difficult
to determine whether the ice sheet is thickening or thinning; that is,
whether (ε˙
zz
H + b
n
)ispositive or negative. One can measure b
n
in snow
pits; the problem is to measure ε˙
zz
without a stationary base upon which
to establish a survey point. Furthermore, such observations would span