Hill A.V. The Encyclopedia of Operations Management: A Field Manual and Glossary of Operations Management Terms and Concepts
Подождите немного. Документ загружается.

ptg6843605
commonality
–
competitive analysis
The Encyclopedia of Operations Management Page 76
Common cause variation includes the normal, everyday influences on a process. If a process is in control, it
only has common cause variation. This type of variation is hard to reduce because it requires change to the
fundamental process. Pande et al. (2000) referred to problems from common causes as “chronic pain.” Special
cause variation is the alternative to common cause variation.
See Capability Maturity Model (CMM), control chart, process capability and performance, quality
management, special cause variation, Statistical Process Control (SPC), Statistical Quality Control (SQC),
tampering, tolerance.
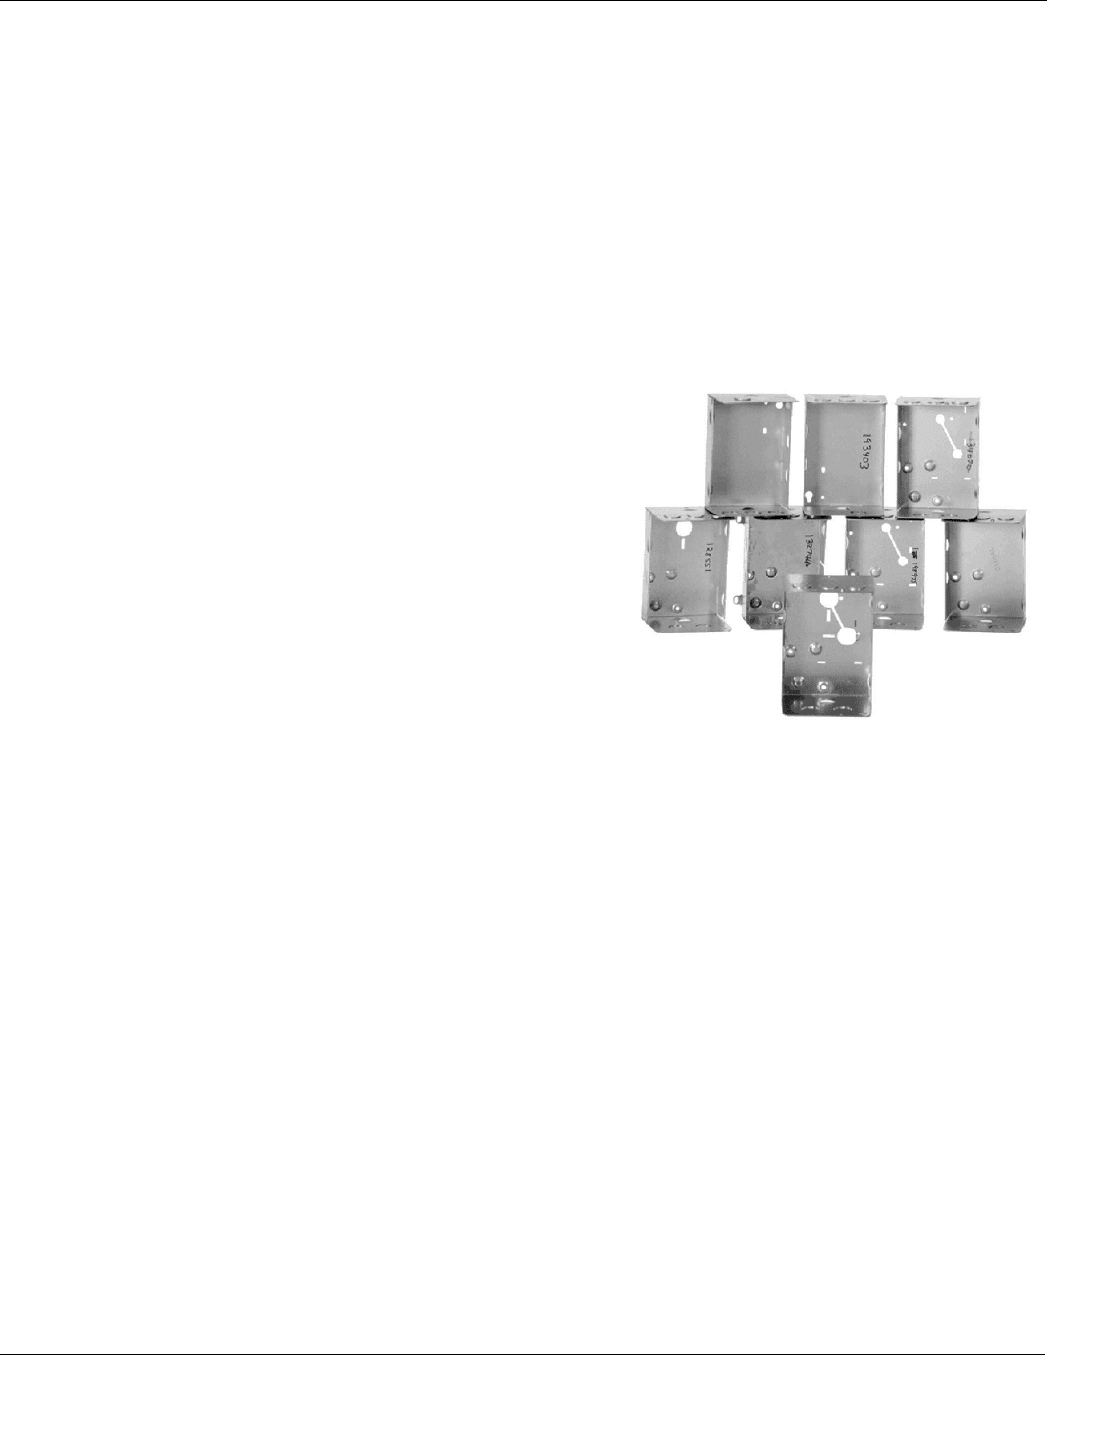
commonality
– The degree to which the same parts are used in different products.
In the photo below, the “universal” box in the front middle replaces all the other boxes in the back. The
change to this common box dramatically reduced inventory and manufacturing cost. (This photo is used with
permission from Honeywell.) Honeywell calls this a “universal” box. These types of components are also called
robust components. In general, robust components have higher direct labor cost because they have better
product design quality. However, increasing commonality can lead to economies of scope in many ways:
Reduced setup (ordering) cost – Because the robust
component has a higher demand rate, its economic order
quantity is larger and it does not have to be ordered as many
times as the current components. This saves on ordering
cost.
Potential quantity discounts for materials – However,
robust components have higher demand and therefore can
qualify for a quantity discount on the price.
Reduced cycle (lotsize) inventory – The economic order
quantity logic suggests that robust components have a larger
order size than any of the current components. However, the
total cycle stock for the robust component will be less than
the sum of the cycle stock for the two current components.
This will result in lower carrying cost.
Reduced safety stock inventory and improved service
levels – The variance of the demand during leadtime for a robust component is likely about equal to the sum
of the variance of the demand for the two current components. When this is true, the robust component
requires less safety stock inventory. Conversely, the firm can keep the same safety stock level and improve
the service level or make improvements in both. This can result in lower carrying cost, lower stockout cost,
or both.
Reduced forecasting error – Based on the same logic as above, the robust component has lower forecast
error variance than the sum of the variances of the two current components. Again, this can reduce safety
stock inventory, improve service levels, or both.
Reduced product design cost – If the firm is using truly robust components, it can use these components in
different products and not have to “reinvent the wheel” with each new product design.
Reduced purchasing and manufacturing overhead – As the number of components are reduced, the
overhead needed to maintain the engineering drawings, tooling, etc. can also be reduced.
Increased reliability – In some cases, a more robust part is also more reliable and easier to maintain.
Commonality is closely related to the concepts of standard parts and interchangeable parts.
See agile manufacturing, bill of material (BOM), cycle stock, economy of scale, economy of scope, engineer
to order (ETO), interchangeable parts, interoperability, mass customization, modular design (modularity),
overhead, quantity discount, reliability, robust, service level, standard parts, standard products, value
engineering.
competitive analysis
– A methodology used to help an organization identify its most important current and future
competitors, analyze how these competitors have positioned their products and services in the market, evaluate
these competitors’ strengths and weaknesses, and then develop strategies to gain competitive advantage in the
market.
See five forces analysis, industry analysis, operations strategy, SWOT analysis.
Example of commonality

ptg6843605
Compounded Annual Growth Rate (CAGR) − Computer Based Training (CBT)
Page 77 The Encyclopedia of Operations Management
Compounded Annual Growth Rate (CAGR) – The rate of growth for an investment that assumes that the
compounded growth rate per period is constant between the first and last values; also called the internal rate of
return (IRR) and smoothed rate of return.
The CAGR (pronounced “keg-er”) is also called a smoothed rate of return because it measures the growth
of an investment as if it had grown at a steady rate on an annually compounded basis. Mathematically, the
CAGR is the geometric mean growth rate and is computed as
1/
ending value
1
starting value
n
CAGR
, where n is the
number of periods (usually years). For example, if someone made an initial investment worth $10,000 at the end
of 2007, $11,000 at the end of 2008, $12,000 at the end of 2009, and $19,500 at the end of 2010, the
Compounded Annual Growth Rate (CAGR) over this n = 3 year period is (19,500/10,000)
1/3
– 1 = 24.9%. In
other words, if the growth rate over the three years was constant each year, it would be an annual growth rate of
24.9%. To prove this, we can see that $10,000 × 1.249 × 1.249 × 1.249 = $19,500. Note that this example has
balances for four years (2007, 2008, 2009, and 2010), but only three years for computing growth. In summary,
the CAGR is not the average (arithmetic mean) annual return but rather the geometric mean annual return.
The Excel functions IRR(values_range) and XIRR(values_range, dates_range) can be used to calculate the
CAGR. IRR is for periodic returns and XIRR allows the user to define a schedule of cash flows. Both functions
require at least one positive and one negative value. If this function is not available in Excel and returns the
#NAME? error, install and load the Analysis ToolPak add-in.
See financial performance metrics, geometric mean, Internal Rate of Return (IRR).
Computer Aided Design (CAD) – A combination of hardware and software that enables engineers and architects
to design everything from furniture to airplanes.
In addition to the software, CAD systems usually require a high-quality graphics monitor, mouse, light pen,
or digitizing tablet for drawing, and a special printer or plotter for printing design specifications. CAD systems
allow an engineer to view a design from any angle and to zoom in or out for close-ups and long-distance views.
In addition, the computer keeps track of design dependencies so that when the engineer changes one value, all
other values that depend on it are automatically changed. Until the mid-1980s, CAD systems were specially
constructed computers. Today, CAD software runs on general-purpose workstations and personal computers.
See Computer Aided Design/Computer Aided Manufacturing (CAD/CAM), Computer Numerical Control
(CNC), group technology, New Product Development (NPD).
Computer Aided Design/Computer Aided Manufacturing (CAD/CAM) – Computer systems used to
design and manufacture products.
An engineer can use the system to design a product and generate the instructions that can be used to control a
manufacturing process.
See Computer Aided Design (CAD).
Computer Aided Inspection (CAI) – A system for performing inspection through the use of computer hardware
and software technologies.
CAI tools are categorized as either contact or non-contact methods:
Contact methods – Coordinate Measuring Machines (CMMs) use a Computer Numerically Controlled
(CNC) mechanical probe to inspect parts to an accuracy of as little as 0.0002 inch. However, the CMM probe
may damage or deform a product’s surface and are not appropriate when contamination is a concern. With many
sample points or complex product contours, CMMs may be too slow to support the desired product inspection
rate. Contact methods are slower but cost less than non-contact methods.
Non-contact methods/Vision systems – A camera is used to take a video image of a part. The image is
processed by software and electronic hardware to compare it against a reference template. The vision system
determines the placement, size, and shape of holes and the presence of part features.
Non-contact methods/Laser-scan micrometers – These systems use reflected laser light to measure part
dimensions and are used to inspect single dimensions on highly repetitive work, such as intervals, diameters,
widths, heights, and linearity.
See inspection, Statistical Process Control (SPC).

ptg6843605
Computer Aided Manufacturing (CAM) – confidence interval
The Encyclopedia of Operations Management Page 78
Computer Aided Manufacturing (CAM) – See Computer Aided Design (CAD), Computer Aided
Design/Computer Aided Manufacturing (CAD/CAM), Computer Numerical Control (CNC).
Computer Based Training (CBT) – Self-paced instruction via interactive software; sometimes called Computer
Based Instruction (CBI), e-learning, and distance education.
CBT provides an opportunity for individuals to learn a subject with little or no involvement of an instructor.
Content can include videos, quizzes, tests, simulations, and “hands-on” learning by doing in a “virtual world.”
See cross-training.
Computer Integrated Manufacturing (CIM) – See Computer Aided Design (CAD), Computer Aided
Design/Computer Aided Manufacturing (CAD/CAM), Computer Numerical Control (CNC).
Computer Numerical Control (CNC) – A type of controller that is typically found on machining centers and
other machine tools.
CNC machines typically cut and form metal. A CNC includes a machine tool used to turn, drill, or grind
different types of parts and a computer that controls the sequence of processes performed by the machine. Not
all computer-controlled machines are CNC. For example, robots are not considered to be CNC machines.
See Computer Aided Design (CAD), manufacturing processes.
computer simulation – See simulation.
concurrent engineering – A systematic approach to the integrated, simultaneous design of products and their
related processes, including manufacturing and support; also called simultaneous engineering and Integrated
Product Development (IPD).
The goal of current engineering is to reduce time to market and quality problems. It can accomplish these
goals by engaging appropriate cross-functional teams from engineering, operations, accounting, procurement,
quality, marketing, and other functions. Suppliers are also involved in some cases.
See cross-functional team, Early Supplier Involvement (ESI), Integrated Product Development (IPD), New
Product Development (NPD), Quality Function Deployment (QFD), simultaneous engineering, waterfall
scheduling.
conference room pilot – See pilot test.
confidence interval – A range of values that will contain the true mean for a random variable with a user-specified
level of confidence based on a given sample of data.
Given a set of n > 30 random observations on a random variable, the confidence interval on the true mean is
given by
/2
/
x
z s n
, where
x
is the sample mean, s is the sample standard deviation, and
1
/2
(1 / 2)z F
is the z value associated with probability α/2. If n random samples are taken many times,
this interval will “capture” the true mean about 100·α/2 percent of the time. The procedure is as follows:
Step 0. Define the parameters – Specify the number of observations (n) that have been collected, the
estimated size of the population (N), and the confidence level parameter (
). If the size of N is large
but unknown, use an extremely large number (e.g., N = 10
10
).
Step 1. Compute the sample mean and standard deviation – Compute the sample mean
x
and sample
standard deviation s from the n observations.
Step 2. Find the z or t value – When n < 30, use the
/2, 1n
t
value from a Student’s t table or the Excel
statement TINV(
, n −1). Note: The arguments in this Excel function are correct. The Excel
functions TINV and NORMSINV are inconsistent in how they handle the probability parameter (α).
TINV returns the probability associated with the two-tailed Student’s t-distribution. When n ≥ 30, use
the
/2
z
value from a normal table or the Excel statement NORMSINV(1 – α/2).
Step 3. Compute the half-width – Compute the half-width of the confidence interval using
/2
/h z s n
(replace
/2
z
with
/2, 1n
t
when n < 30). If the sample size n is large relative to the total population N
(i.e., / 0.05n N ), use
/2
1/ 1/h z s n N
instead. The term
1/ 1/n N
is called the finite

ptg6843605
configuration control − conformance quality
Page 79 The Encyclopedia of Operations Management
population correction factor. For n ≥ 30, the half-width can also be found using the Excel function
CONFIDENCE(
, s, n). This Excel function should not be used when n < 30.
Step 4. Write the confidence interval – Write the
100(1 )%
confidence interval as (
x
h ).
Confidence intervals are a useful concept based on the central limit theorem and do not require any
assumptions about the distribution of x. The sample size calculation entry has more detail on this subject.
See Analysis of Variance (ANOVA), central limit theorem, Chebyshev’s inequality, dollar unit sampling,
normal distribution, sample size calculation, sampling, sampling distribution, simulation, standard deviation,
Student’s t distribution, t-test.
configuration control – See configuration management.
configuration management – The process of defining and controlling the information that defines a system.
Configuration control includes all activities needed to control the changes to a configuration after it has been
formally documented. Configuration control includes the evaluation, coordination, approval, or rejection of
changes.
The best configuration management process is one that can (1) accommodate change, (2) accommodate reuse
of proven standards and best practices, (3) assure that all requirements remain clear, concise, and valid, (4)
communicate promptly and precisely, and (5) assure that the results conform in each case. CM includes several
elements: requirements management, change management, release management, data management, records
management, document control, and library management. CM provides the infrastructure that enables an
organization to “change faster and document better.” CM also accommodates change and keeps requirements
clear, concise, valid, and synchronized. A strong CM process is the foundation of a sound business process
infrastructure. Adapted from the home page of the Institute of Configuration Management (www.icmhq.com).
See New Product Development (NPD).
configurator – A software tool (usually with an Internet interface) that allows customers, order entry people, or
sales people to create customized products by selecting various product features from menus.
Ideally, a configurator will (1) encourage customers to select standard, high-margin combinations of features,
(2) prevent customers from selecting prohibitive combinations of features, (3) discourage customers from
selecting low margin (or negative margin) combinations, and (4) create manufacturing orders that can be sent
electronically to manufacturing. In some cases, the configurator creates instructions for automated equipment.
Configurators might contain many expert rules and might draw heavily on science, engineering, and
manufacturing expertise. In conclusion, the ideal configurator is easy for the customer to use, creates product
configurations that customers want, and guides customers to product configurations that the firm can make and
sell profitably.
For example, mycereal.com
9
, General Mills’ custom-blended breakfast cereal, had a configurator that
included tremendous amounts of food science so customers would get healthy food and tasty portions. Lifetouch
provides software to high schools so they can configure their own student ID cards, populate a database with
student photos, and then send a file to the firm’s ID card manufacturing facility.
See configure to order (CTO), engineer to order (ETO), mass customization, order entry.
configure to order (CTO) – A customer interface strategy that adjusts parameters or adds modules to a product in
response to a customer’s order.
In a configure to order (CTO) system, a firm sells standard products that require parameter adjustments or
modules to be added in response to a customer order. Examples include setting the height of a seat for a riding
mower, selecting the language option for a software package, or setting some customer-specific parameters for a
medical device. Some people call this reconfigure to order. The respond to order (RTO) entry discusses a
number of similar customer interface strategies.
See configurator, respond to order (RTO), standard products.
conformance quality – The degree to which the product or service meets the design specifications or standards;
sometimes also called quality of the process or process quality.
9
This website is no longer active.

ptg6843605
congestion pricing – consolidation
The Encyclopedia of Operations Management Page 80
Conformance quality is generally measured by the yield rate (the percentage of units started that are not
defective) or the scrap rate (the percentage of units started that have to be discarded because they are defective).
In contrast, design quality (also called performance quality) is the degree to which the design meets customer
requirements.
For example, the new product development organization has set a performance standard (a specification
limit) that a new wristwatch should be able to survive in 100 meters of water. However, the manufacturing
process sometimes fails to properly assemble the watch, which results in 10% of all watches failing to meet the
standard. In this example, the yield rate is 90% and the percent defective is 10%.
See product design quality, quality at the source, quality management, scrap, yield.
congestion pricing – The practice of charging a higher price for a service during peak demand periods to
discourage arrivals to the system.
For example, the city of Singapore assesses a very high charge to drivers who enter the downtown areas
during the workday. This practice is now being used in many large metropolitan areas worldwide. Similar
examples can be found in telephone rates, electricity (power) usage, computer usage, restaurants, and other
service businesses.
See yield management.
conjoint analysis – An analytical marketing research technique that measures the trade-offs made by respondents
among product attributes.
Conjoint analysis is a useful tool for both product concept generation and evaluation by rating product
attributes in terms of their importance in the market. The method involves the measurement of the collective
effects of two or more independent variables (e.g., color, size, ease of use, cost, etc.) on the classification of a
dependent variable (overall liking, purchase intention, best buy, or any other evaluative measurement). The
stimulus is a product-attribute combination. Various mixed and matched product attributes are put together and
rated by the respondent. For example, does the respondent prefer a large, powerful, spacious car that is relatively
expensive in its operation or one that is smaller, less powerful, but more economic to operate?
Once the unique product combinations are established, conjoint studies typically collect data via the use of
one of the following:
• A paired-comparison methodology, where each of the hypothetical products is directly compared to another
product and one of the products is selected over the other. For example, with 16 unique products, a total of
120 binary choices are required.
• A ranking methodology, where product configurations are rank-ordered relative to preferences of the
respondent. This is probably the most common method for collecting conjoint data.
For the paired-comparisons model, a telephone survey is often difficult because of the amount of time
required to go through each of the possible comparisons.
Adapted from http://mrainc.com/trad_conj.html (April 16, 2011).
See Analytic Hierarchy Process (AHP).
consignee – A transportation term for the party (agent) that accepts a delivery.
The consignee is named on the bill of lading as the party authorized to take delivery of a shipment.
See Advanced Shipping Notification (ASN), bill of lading, consignment inventory.
consignment inventory – Items in the possession of a retailer or distributor and offered for sale to customers but
still owned by the supplier.
Consignment inventory is often used as a marketing tool to entice a retailer or distributor to carry a supplier’s
inventory. Payment on consignment inventory is usually made when stock is sold or used by a customer. The
supplier (the consignor) ships to the agent (the consignee) under an agreement to sell the goods for the consignor.
The consignor retains title to the goods until the consignee has sold them. The consignee sells the goods and
then pays a commission to the consignor.
Some examples of consignment inventory include: (1) Many retailers of Christmas craft items only pay their
suppliers when the craft items are sold. (2) Medical device firms often own the devices in hospital inventories
until they are sold to patients. (3) Some manufacturers of fasteners make their products available to assemblers
and do not require their customers to pay until the fasteners are used.
See consignee, inventory management, vendor managed inventory (VMI).

ptg6843605
consolidation − continuous process
Page 81 The Encyclopedia of Operations Management
consolidation – (1) In a general context: The combination of separate parts into a single unified whole. (2) In a
logistics context: The combination of two or more shipments going to the same destination in a single shipment;
related terms include consolidate, consolidation service, freight consolidation, consolidated shipment,
consolidated cargo, consolidated load, and consolidated container.
A consolidated shipment can reduce the number of individual shipments and take advantage of lower cost
transportation (i.e., full truck or full container load shipments). At the destination, the consolidated shipment is
separated (de-consolidated or de-grouped) back into the original individual shipments for delivery to consignees.
A consolidation service will combine smaller shipments and then ship them together to achieve better freight
rates and cargo security.
Consolidation is also used in the context of reducing the number of stocking locations (e.g., warehouses) and
consolidating the “spend” on just a few suppliers for each commodity group (e.g., MRO supplies).
See cross-docking, hub-and-spoke system, less than truck load (LTL), leverage the spend, Maintenance-
Repair-Operations (MRO), pooling, square root law for warehouses, Third Party Logistics (3PL) provider.
consortium – An association or coalition of two or more individuals, companies, firms, or not-for-profit
organizations (or any combination thereof) that pool resources, such as buying power, research capability,
manufacturing capability, libraries, or information, to achieve a common goal.
Constant WIP – See CONWIP.
constraints management – See Theory of Constraints.
consumable goods – An item or product that is used up (consumed) in a relatively short period of time; sometimes
called non-durable goods, soft goods, or consumables.
In the economics literature, consumable goods are defined as products that are used up fairly quickly and
therefore have to be replaced frequently. In contrast, durable goods (also called hard goods or capital goods),
such as refrigerators, cars, furniture, and houses, have long useful lives.
In the Maintenance, Repair, and Operations (MRO) context, consumables are items purchased by a firm
that do not become part of the product sold to customers. For example, 3M sandpaper might be used for final
surface conditioning of a product. Other examples of consumables include printer ink and machine oil.
In a marketing context, many firms make more money selling consumable products than they do selling
capital goods or other products. For example, Gillette almost gives away its razors to sell razor blades and HP
sells printers with lower margins than it has on its ink cartridges.
See category captain, category management, consumer packaged goods, durable goods, Maintenance-
Repair-Operations (MRO).
consumer packaged goods – Consumable goods, such as food and beverages, footwear and apparel, tobacco, and
cleaning products; sometimes abbreviated CPG.
Some examples of consumer packaged goods include breakfast cereal (such as General Mill’s Cheerios) and
soap (such as Proctor and Gamble’s Ivory soap).
See category captain, category management, consumable goods, Fast Moving Consumer Goods (FMCG),
private label, trade promotion allowance.
consumer’s risk – The probability of accepting a lot that should have been rejected.
More formally, consumer’s risk is the probability of accepting a lot with a defect level equal to the Lot
Tolerance Percent Defective (LTPD) for a given sampling plan. The consumer suffers when this occurs because
a lot with unacceptable quality was accepted. This is called a Type II error. The symbol β is commonly used for
the Type II risk.
See Acceptable Quality Level (AQL), acceptance sampling, Lot Tolerance Percent Defective (LTPD),
operating characteristic curve, producer’s risk, quality management, sampling, Type I and II errors.
container – See shipping container.
continuous demand – See demand.
continuous flow – Producing and moving small batches (ideally with a lotsize of one unit) through a series of
processing steps with almost no inventory and almost no waiting between steps.
See batch-and-queue, discrete manufacturing, facility layout, lean thinking, one-piece flow, repetitive
manufacturing.

ptg6843605
continuous improvement – control chart
The Encyclopedia of Operations Management Page 82
continuous improvement – See kaizen, lean sigma, lean thinking, Total Quality Management (TQM).
continuous probability distribution – See probability density function.
continuous process – A process that makes only one product with dedicated equipment and never needs to handle
changeovers (setups).
Examples of a continuous process include oil refining, paper making, and chemical processing.
See batch process, discrete manufacturing, setup cost, setup time.
continuous replenishment planning – The practice of working with distribution channel members to change
from distributor-generated purchase orders to replenishment based on actual sales and forecast data.
The principal goal of continuous replenishment planning is to reduce the cost of producing and moving
product through the vendor-retailer supply chain. The object is for all stages of the supply chain to operate with
greater knowledge of downstream inventory conditions, thereby allowing for a synchronized flow of product
from the manufacturer through point-of-sale (Vergin and Barr 1999).
See Collaborative Planning Forecasting and Replenishment (CPFR), Efficient Consumer Response (ECR),
inventory management.
continuous review system – A system for managing an inventory that compares the inventory position (on-hand
plus on-order less allocated) with the reorder point for every transaction and places a replenishment order when
the position is less than the reorder point.
See inventory management, inventory position, periodic review system, reorder point, replenishment order.
Contract Electronics Manufacturing Services (CEMS) – See contract manufacturer.
contract manufacturer – An organization that makes products under a legal agreement with the customer.
Contract manufacturers generally serve the Original Equipment Manufacturing (OEM) market. Contract
manufacturers make a large percentage of the products in the computer and electronics fields. These products are
usually designed and branded with the OEM’s name, built by the contract manufacturer, and then shipped
directly to distributors or customers.
A good example is the Microsoft Xbox game console, which is made by Flextronics and other contract
manufacturers around the world. Flextronics also makes cell phones for Ericsson, routers for Cisco, and printers
for HP. Other major contract electronics manufacturers include Sanmina-SCI Corporation and Celestica.
An “original design manufacturer” (ODM) is a type of contract manufacturer that uses its own designs and
intellectual property (IP). The ODM typically owns the IP for the product itself, while the regular contract
manufacturer uses its customer’s designs and IP. Whereas, contract manufacturers can make hundreds or
thousands of different products, ODMs usually specialize in only a handful of categories. Contract
manufacturers in the electronics field that not only make products but also offer assistance with the design and
supply chain generally call themselves Electronics Manufacturing Services (EMS) or Contract Electronics
Manufacturing Services (CEMS).
Porter (2000) listed the most prevalent sources of friction in a contract manufacturing relationship as:
• Traditional financial metrics.
• Difficulty defining core competencies.
• Fear of losing intellectual capital and expertise.
• Difficulty finding qualified manufacturing-services companies.
• Difficulty attracting good contract manufacturers for less-desirable programs.
• Difficulty understanding and documenting capabilities of contract manufacturers.
• Difficulty earning most-favored-customer status.
• Necessity of managing risk exposure.
• Trouble with technology and knowledge transfer.
• Unforeseeable problems (such as parts shortages).
See business process outsourcing, co-packer, intellectual property (IP), Original Equipment Manufacturer
(OEM), outsourcing, supply chain management.
contract warehouse – See warehouse.
control chart – A graphical tool used to plot the statistics from samples of a process over time and keep the system
in control.

ptg6843605
control limit − co-opetition
Page 83 The Encyclopedia of Operations Management
If all points are within the upper and lower statistical control limits, variation may be ascribed to “common
causes” and the process is said to be “in control.” If points fall outside the limits, it is an indication that “special
causes” of variation are occurring and the process is said to be “out of control.” Eliminating the special causes
first and then reducing common causes can improve quality. Control charts are based on the work of Shewhart
(1939). The most commonly used control charts are the run chart, x-bar chart, r-chart, c-chart, and p-chart. Less
commonly used control charts include the s-chart, s
2
-chart, u-chart, and np-chart.
See c-chart, common cause variation, cumulative sum control chart, lean sigma, np-chart, outlier, p-chart,
process capability and performance, quality management, r-chart, run chart, seven tools of quality, special cause
variation, specification limits, Statistical Process Control (SPC), Statistical Quality Control (SQC), tampering,
u-chart, x-bar chart.
control limit – See Statistical Process Control.
control plan – A formal document that defines how an organization will continue to benefit from an organizational
intervention, such as a lean sigma project.
When a process improvement project has been completed, it is important that the organization “sustain the
gains.” This is often difficult given the normal organizational “entropy,” where the system tends to fall back into
the old state of disorder. A good control plan includes the following elements:
• Procedure – What solutions were implemented to attain the project goals? What control device is in place?
• Responsible party – Who is responsible for this? See the RACI Matrix entry for a methodology.
• Nature of control – How does the control measure sustain the gain? What is the control measure for early
detection?
• What to check – What does the responsible party inspect/observe? What are the failure modes?
• Action/Reaction – What does the responsible party do if the situation is out of control?
If statistical process control is appropriate, the following data items should be specified for each Key Process
Output Variable (KPOV): Target value, lower specification limit, upper specification limit, C
pk
, and the
measurement system used to collect the data.
Good control plans go beyond statistical process control and include clear job descriptions, aligned reward
systems, standard operating procedures, visual signals and instructions, and error proofing.
See ADKAR Model for Change, lean sigma, Lewin/Schein Theory of Change, RACI Matrix.
CONWIP – An approach for manufacturing planning and control that maintains a constant work-in-process
inventory in the system.
With CONWIP (Spearman, Hopp, & Woodruff 1989), every time the last step in the process completes one
unit, the first step in the process is given permission to start one unit. As a result, CONWIP maintains a constant
WIP inventory. This is similar to the Theory of Constraints “drum buffer rope” (DBR) concept, except that
CONWIP does not send a signal from the bottleneck, but rather sends the signal from the final step in the
process. This concept is similar to a JIT pull system, except that CONWIP does not need to have buffers
(kanbans) between each pair of workcenters. Given that CONWIP does not require the firm to identify the
bottleneck and does not need to implement any type of kanban system between workcenters, it is clearly easier to
operate than many other systems. CONWIP can be implemented with a simple visual control system that has the
final operation signal the first operation every time a unit is completed. CONWIP can be applied at almost any
level: at a machine, a workcenter, a plant, or even an entire supply chain. Some research suggests that CONWIP
is superior to both DBR and JIT in terms of system performance (inventory, capacity, etc.).
See blocking, Drum-Buffer-Rope (DBR), gateway workcenter, kanban, pacemaker, POLCA (Paired-cell
Overlapping Loops of Cards with Authorization), pull system, Theory of Constraints (TOC), Work-in-Process
(WIP) inventory.
co-opetition – A blending of the words “cooperation” and “competition” to suggest that competing firms can
sometimes work together for mutual benefit; also called co-competition and coopetition.
Cooperation with suppliers, customers, and firms producing complementary or related products can lead to
expansion of the market and the formation of new business relationships, perhaps even the creation of new forms
of business. An example can be found in group buying, where multiple, normally competitive, buying group
members (such as hospitals) leverage the buying power of the group to gain reduced prices. All members of the
buying group benefit from this relationship.

ptg6843605
co-opt – core competence
The Encyclopedia of Operations Management Page 84
This concept was developed in the book Co-opetition (Brandenburger & Nalebuff 1996). Apparently, Ray
Noorda, the founder of Novell, coined the term. The concept and term have been widely used in the computer
industry, where strategic alliances are commonly used to develop new products and markets, particularly
between software and hardware firms. Some industry observers have suggested that Apple and Microsoft need
each other and, in fact, are involved in co-opetition.
Do not confuse this term with the term “co-opt,” which means to select a potential adversary to join a team.
See game theory.
co-opt – To appoint, select, or elect someone to become a member of a group, team, or committee, often for the
purpose of neutralizing or winning over potential critics or opponents; also spelled coopt, co-option, and co-
optation.
According to the Merriam-Webster Dictionary, co-opt comes from the Latin word “cooptare,” which means
to choose. When selecting members for a project team, it is often wise to co-opt potential opponents. Ideally,
this potential opponent becomes an advocate and recruits support from other like-minded potential opponents.
This term should not be confused with the term “co-opetition,” which is a cooperative relationship between
competing firms.
See change management, project management, stakeholder analysis.
coordinate the supply chain – See buy-back contract.
co-packer – A supplier that produces goods under the customer’s brand; also copacker.
A co-packer is a contract manufacturer that produces and packs items for another company. The term “co-
packer” is frequently used in a consumer packaged goods context, but is also used in other industries. For
example, Ecolab, a manufacturer of industrial cleaning products, uses co-packers to manufacture some cleaning
agents that require specialized chemical processes and Schwan’s Foods uses co-packers when it does not have
enough capacity, particularly for seasonal products.
See contract manufacturer, outsourcing.
core capabilities – See core competence.
core competence – Skills that enable an organization to differentiate its products and services from its competitors;
nearly synonymous with distinctive competence.
Coyne, Hall, and Clifford (1997) defined a core competence as “a combination of complementary skills and
knowledge bases embedded in a group or team that results in the ability to execute one or more critical processes
to a world-class standard.” This definition is similar but not identical to the above definition. Nearly all
definitions of core competence include the point that a core competence is an attribute of the organization and not
just an attribute of a single individual in that organization.
A core competence is unique and hard to copy, which means that it can lead the firm into new products and
markets. Some authors make a distinction between core competencies and distinctive competence. They define
core competence as the basic product and process technologies and skills that all firms need to compete in an
industry and distinctive competence as the set of technologies and skills that a firm uses to differentiate itself in
the market. However, it appears that many authors now use the terms almost synonymously. Knowledge of a
firm’s core competence can lead its management team to find new products and guide its thinking about
outsourcing.
Many marketing experts and students tend to define a core competence as a differentiated product. However,
a core competence is not a product or service, but rather the processes, abilities, and unique attributes
(differentiated processes) that allow the organization to develop and deliver differentiated “core products.”
Three requirements for a valid distinctive competence are:
• It must be unique and present a barrier to entry for new competitors.
• The unique competence must offer real value to the marketplace. Something being merely unique without
offering value is not a distinctive competence.
• The unique competence must be credible in the marketplace. Its existence and value have to be accepted and
believed.
A popular phrase in many MBA classrooms is “An organization should never outsource its core
competence.” With that said, it is interesting to see how many firms find that they are outsourcing today what
they defined as their core competences less than five years ago. It may just be that core competences, like

ptg6843605
corporate portal − correlation
Page 85 The Encyclopedia of Operations Management
strategies, tend to change and adapt over time as the markets, products, and technologies change. Clearly, an
organization’s set of core competences should not remain stagnant in a rapidly changing environment.
In this author’s experience, most executives cannot clearly identify their core competences when asked.
However, one insightful way to help an organization identify its core competence is to ask, “What would keep a
competitor from capturing 100% of your market share tomorrow?” This “barriers-to-entry” question usually
identifies the organization’s core competence. Barriers to entry can include:
Proprietary product or process technology
Product differentiation (often based on
process differentiation)
Economies of scale (that lead to a lower cost
structure)
Brand equity
Switching cost
Government protection, subsidies, and patents
Access to raw materials (special relationship
or location)
Access to customers (good location)
Another good question used to identify a core competence is, “Why do customers buy your product instead
of another product?” This is the customer’s view of core competence.
Zook (2004) emphasizes the need for firms to stay close to their core products and core competence. His
book offers a systematic approach for choosing among a range of possible “adjacency moves,” while always
staying close to the core products and core competencies.
See economy of scale, focused factory, market share, operations strategy, outsourcing, resource based view,
switching cost.
corporate portal – A Web-based system that allows businesses to make internal (IS/IT) systems or information
available in a single location and format.
A portal is a Web site intended to be the first place people see when using the Web. Most portals have a
catalog of web sites, a search engine, or both. Portals may also offer e-mail and other services to entice people to
use that site as their main point of entry (hence “portal”). Portals are often used to allow access to internal
information by providing a secure connection (dashboard) for employees, vendors, or customers.
See balanced scorecard, dashboard, extranet, intranet.
correlation – A dimensionless measure of the strength of the linear association between two variables; also known
as the Pearson product-moment correlation coefficient or Pearson’s correlation coefficient.
If two variables are correlated, they tend to vary together. In other words, when one is higher (lower) than its
mean, the other one is too. Correlation is always in the range [−1, 1], where a negative sign shows an inverse
relationship. The coefficient of determination (also known as R-squared) is the square of the correlation
coefficient. For example, if the correlation is r = −0.7, the coefficient of determination is R
2
= 0.49. The R-
squared value is often described as the percent of the variation explained.
Correlation is a necessary but not sufficient condition for causation. Although correlation may sometimes
infer causation, correlation does not mean causation. For example, shoe size and reading skill are correlated.
This does not mean that large feet cause better reading. It simply means that young children do not read as well
as adults. Similarly, roosters might make noise at sunrise, but the rooster’s noise does not cause the sun to rise.
Causation is also inferred by a time (temporal) ordering, where the cause should precede the effect. Correlation
and temporal ordering are both necessary but not sufficient conditions for causation.
The mathematical definition of the sample correlation between random variables x and y is
cov( , )
x y
x
y
r
s s
,
where the sample covariance between x and y is
1
1
cov( , ) ( )( )
1
n
i i
i
x
y x x y y
n
, the sample standard
deviation of x is
2
1
1
( )
1
n
x i
i
s
x x
n
, and the sample standard deviation of y is
2
1
1
( )
1
n
y i
i
s y y
n
.
A mathematically equivalent expression defines the sample correlation as the sum of the products of the
standardized values
1
n
x
i yi
i
r z z
, where
( ) /
x
i i x
z x x s
and
( ) /
yi i x
z y y s
. The variable