Hammond C. The Basics of Crystallography and Diffraction
Подождите немного. Документ загружается.

324 Fourier analysis in diffraction and image formation
1.0
Intensity
0.8
0.6
0.4
0.2
0
0
1
a
2
a
3
a
4
a
5
a
6
a
7
a
8
a
9
a
10
a
Sin
11
a
12
a
1
d
=
4
a
(missing order)
2
d
=
8
a
(missing order)
3
d
=
12
a
(missing order)
a
d
(a)
(b)
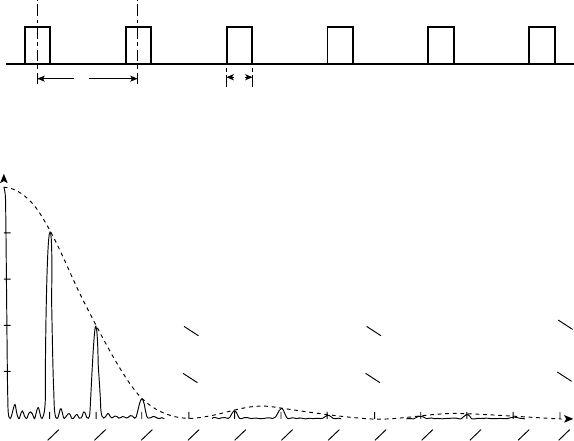
Fig. 13.7. (a) The ‘square-top’waveform representing the amplitude of light from a diffraction grating
consisting of six slits, width d and spacing a and ratio a/d = 4. (b) The corresponding diffraction pattern.
Note the fourth, eighth, etc. ‘missing orders’ and the number (6 − 2) = 4 of the subsidiary maxima
between the principal maxima (adapted from Geometrical and Physical Optics by R.S. Longhurst, 2nd
edn, Longmans, London, 1967.)
(4) For the given ratio, a/d = 4, the first, second, etc. minima of the single slit envelope
correspond to the angles of the fourth, eighth, etc. principal maxima (sometimes
called ‘missing orders’).
It is easy to see the effects of changing the variables d (slit width), a (slit spacing)
and N (number of slits). As d increases the single slit profile (dashed line) becomes
narrower. As N increases the principal maxima become narrower, i.e. ‘sharper’ and the
subsidiary maxima both increase in number (N − 2) and decrease in intensity. As a
increases the principal maxima become closer together and the ratio a/d determines the
missing orders.
As we have seen in Section 13.2, the amplitudes of the diffracted beams each corre-
spond to a Fourier coefficient of the Fourier analysis of the periodic variation in electron
density in a crystal. Precisely the same analysis applies to the amplitudes of the diffracted
beams from a grating: they each correspond to a Fourier coefficient of the Fourier analy-
sis of the square-topped waveform. Furthermore, if we take the origin at, say, the centre
of a slit, the Fourier coefficients are real (as with the example of NaCl, Fig. 13.5), with
signs +(zero phase angle) or − (180
◦
phase angle). Hence, we now have to determine
the amplitudes of the diffracted beams as a function of the angle α (rather than simply
determining the angles for either destructive or constructive interference). We do this by
means of amplitude–phase diagrams; first for a single slit and then for a grating of N slits.
13.3 Analysis of the Fraunhofer diffraction pattern 325
d
a
a
a
c
f
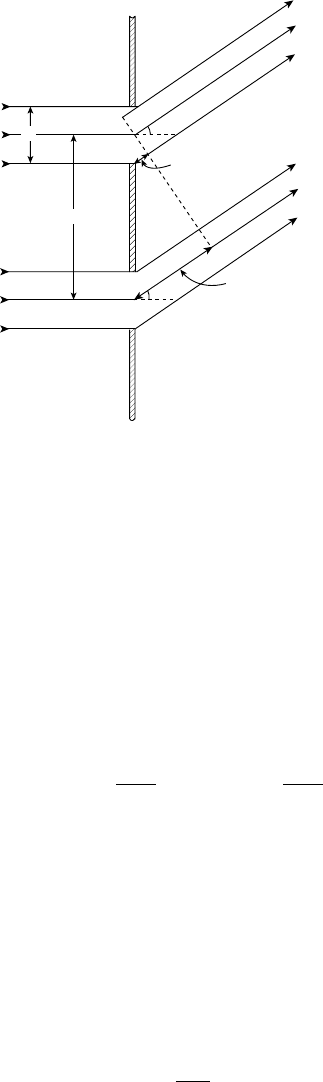
Fig. 13.8. A diffraction grating indicating the path difference d/2 sin α (phase difference φ) between
a Huygens wavelet at the centre and either edge of a slit and the path difference a sin α (phase difference
ψ) between the slits.
Single slit width d (Fig. 13.8)
When α = 0, all the Huygens wavelets are in phase and their sum, a straight line, has
amplitude, say A
0
(Fig. 13.9(a)). Now consider the situation at angle α. Taking the centre
of the slit as the origin, the path difference, PD, between the wavelet at the centre of
the slit and those at the edge is d /2 sin α and the phase difference φ = 2π/λ(PD) =
πd /λ sin α; +φ for the wavelet at the lower edge and −φ for the wavelet at the top
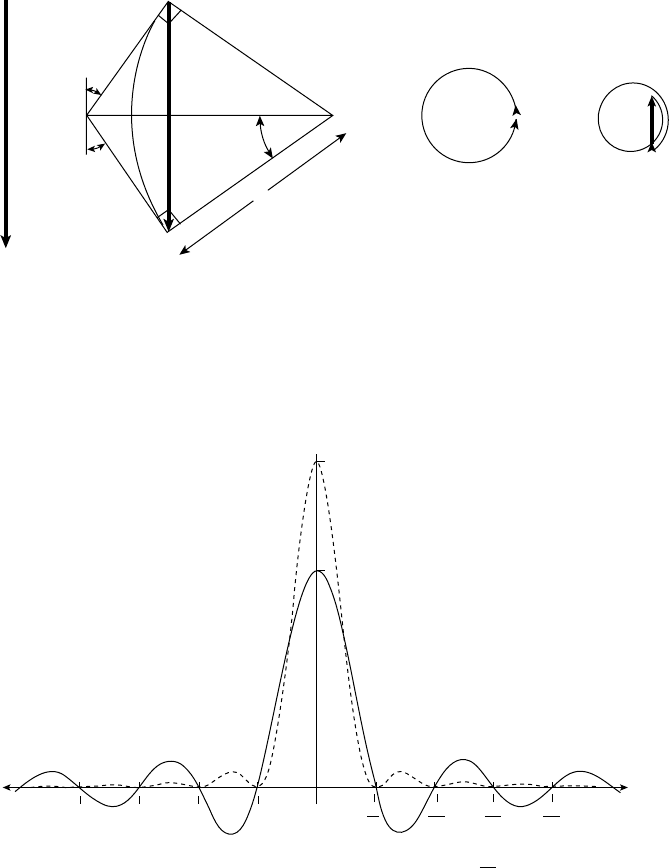
edge. The amplitude–phase diagram is now the arc of a circle, length A
0
, as shown in
Fig. 13.9(b) with the phase differences +φ and −φ indicated. The resultant amplitude is
given byA, thechordof the circle. From thegeometryA
0
= r2φ and A = r2 sin φ where r
is the radius of the circle. Hence A = A
0
sin φ
φ
. This function,
sin φ
φ
, occurs so commonly
in optics that it is given a special name, sincφ (pronounced sink φ). Its operation can be
seen in Fig. 13.9. As φ (or α) increases, the arc of the circle ‘winds up’ until φ = π (or
sin α = λ/d) at which point A = 0 (Fig. 13.9(c)). Then, as φ increases further it ‘winds
on itself’ and the resulting amplitude A is reversed in sign (Fig. 13.9(d)), and so on.
The function, sincφ, plotted vs. sin α to the right and vs. φ to the left is shown in
Fig. 13.10 (solid line) together with its square (dashed line), representing the intensity
distribution from a single slit.
N slits, width d , spacing a (Fig. 13.8)
The path difference, PD, between corresponding points between adjacent slits is a sin α
and the phase difference ψ = 2π/λ(PD) =
2πa
λ
sin α. Again, when α = 0, all the
326 Fourier analysis in diffraction and image formation
A
o
(a) (b) (c) (d)
A
A
–f
+f
+f
r
Fig. 13.9. The amplitude–phase diagram for a single slit: (a) α = 0; all the Huygens wavelets are in
phase; (b) for phase difference ±φ between the wavelet at the centre and those at the edges of the slit;
(c) for phase difference φ = π , the amplitude A is zero; (d) for φ>π, the amplitude A is reversed
in sign.
f
4p
3p 2p
0
d
p l
d
2l
d
3l
(A
0
)
2
A
0
d
4l
sin a
Fig. 13.10. The function A
0
sin cφ vs. sin α (plotted to right) or vs. φ =
πd
λ
sin α (plotted to left) rep-
resenting the amplitude distribution from a single slit (or aperture) (solid line) and its square representing
the intensity (dashed line). In this example A
0
= 1.5. (Courtesy of Mr D.G. Wright.)
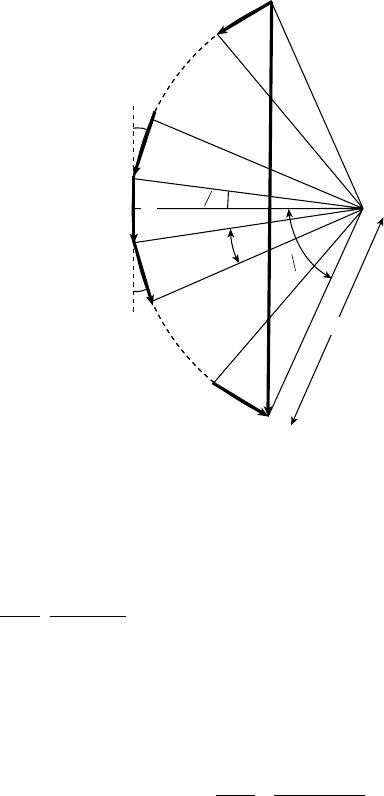
slits scatter in phase and the amplitude A
T
= A
0
. At angle α we again construct an
amplitude–phase diagram—but not as before as the arc of a circle of constant length, but
as a series of chords, each of amplitude A and differing in phase by ψ (Fig. 13.11). For
each chord A/2 = R sin ψ/2 where R is the radius. For N chords half the total angle is
13.3 Analysis of the Fraunhofer diffraction pattern 327
A
A
2
A
T
A
c
c
A
A
2
N
c
R
Fig. 13.11. The amplitude–phase diagram for a grating of N slits and for phase difference ψ between
the slits, total amplitude = A
T
. Note that (unlike the single slit) the series of chords (the arc of the
circle-dashed line) is not of constant length.
N ψ/2 and A
T
/2 = R sin Nψ/2. Substituting for R and A we have:
A
T
= A
0
sin φ
φ
.
sin Nψ/2
sin ψ/2
(φ = πd/λ sin α, ψ = 2πa/λ sin α and ψ/φ = 2a/d).
The first term in this expression is called the single-aperture term and the second is called
the grating term. In computing the amplitude, A
T
, and intensity, (A
T
)
2
, distributions the
equation may be simplified by using only two variables, φ and N , and a given ratio of slit
spacing/slit width, a/d ; i.e. sin N ψ/2 = sin Nφ a/d and sin ψ/2 = sin φ a/d , hence
A
T
= A
0
sin φ
φ
·
sin Nφ a/d
sin φ a/d
.
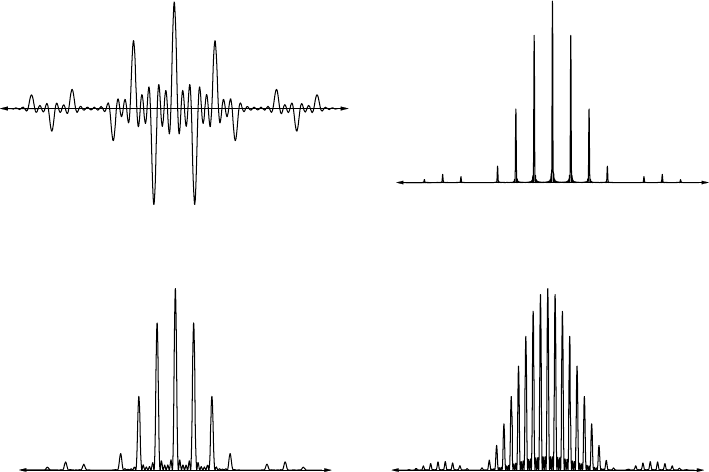
For N = 6 and a/d = 4 this function is shown in Fig. 13.12(a) and its square, represent-
ing the intensity distribution for the diffraction grating, is shown in Fig. 13.12(b) below.
Notice that the phases of the amplitudes of the diffraction maxima alternate between
+ and − (Fig. 13.12(a)) but that this phase information is lost in the intensity distribu-
tion (Fig. 13.12(b), which corresponds of course to the experimental intensity profile of
Fig. 13.7(b)).
Figure 13.12(c) shows the effect of increasing the number of slits, N , from 6 to 20. The
principal maxima are now sharper and the subsidiary maxima are now greater in number
but much reduced in intensity. Finally, Fig. 13.12(d) shows the effect of increasing a/d,
from 4 to 10 and for N = 4. The principal maxima approach closer together and, as
pointed out above, merge into one continuous function when a/d approaches infinity.
328 Fourier analysis in diffraction and image formation
sin a
(a)
(b) (d)
(c)
f
ff
f
sin
sin a
sin a
Fig. 13.12. (a) The amplitude distribution A
T
for a grating with N = 6 slits and a/d = 4, and (b) the
corresponding intensity distribution (A
T
)
2
. (c) The effect on the intensity distribution of increasing the
number of slits to 20—the principal maxima are sharper and the subsidiary maxima are insignificant.
(d) The effect of increasing a/d to 20 (N = 4)—the principal maxima approach closer together.
(Courtesy of Mr D.G. Wright.)
13.4 Abbe
∗
theory of image formation
The formation of an image in a microscope may be considered to be carried out by
the objective lens in two stages. First, the lens collects some (not all) of the parallel
wavetrains resulting from the diffraction and interference of light across the grating into
a series of diffraction peaks (sometimes called ‘spectra’) situated in the back focal plane.
In this sense the objective lens performs a Fourier analysis of the light emanating from
the grating as shown diagrammatically in Fig 13.12(a). A screen placed here records
their positions and intensities (Fig 13.12(b)) or the diffraction peaks may be observed
by simply removing the microscope eyepiece and observing the back focal plane either
directly or with the aid of a close-focused telescope.
1
∗
Denotes biographical notes available in Appendix 3.
1
Phase contrast and polarized-light microscopes often incorporate a Bertrand lens below the eyepiece
which when ‘flipped in’ allows observation of the back focal plane directly.
13.4 Abbe theory of image formation 329
The wavetrains emanating from the diffraction peaks then spread out and interfere
to form a set of interference fringes in the image plane—in short the objective lens
then performs a Fourier synthesis of the amplitude distribution of the light in the back
focal plane, the amplitudes of the zero, first, second, etc. diffraction peaks or spectra
corresponding to the zero, first, second etc. Fourier coefficients. And the greater the
number of termsincludedin the Fourier synthesis, i.e. the greater the numberofdiffracted
beams intercepted by the objective lens, the closer does the image correspond to the
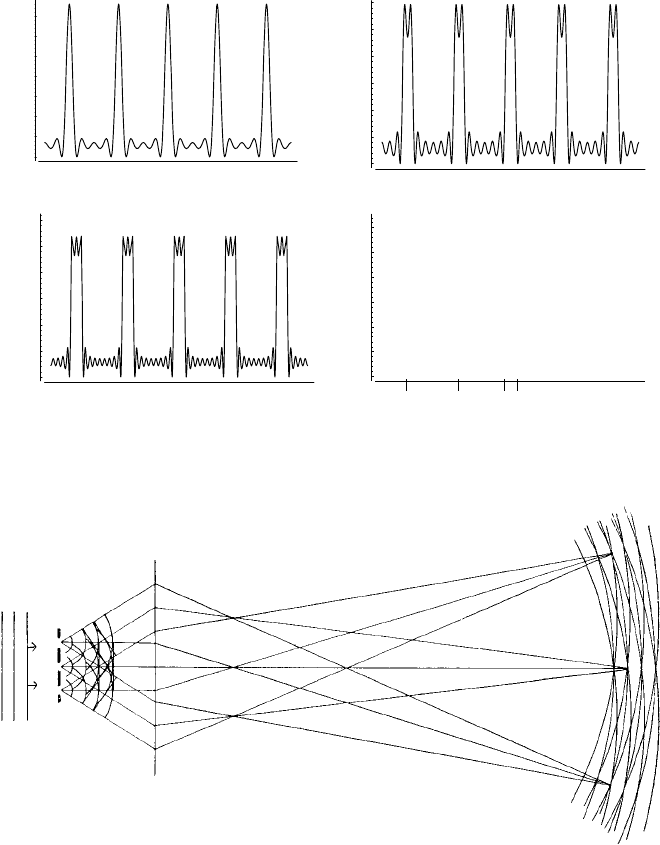
amplitude distribution across the grating. Figure 13.13(a)–(d) shows the evolution of
the image of a diffraction grating with a ‘square-top’ waveform with a/d = 4 (as in
Fig. 13.7(a)) synthesized with an increasing number of Fourier terms.
This two-stage image formation process may also be understood in simple terms by
making use of Abbe’s ‘classic’ representation of image formation (Fig. 13.14). A plane
wave (Fraunhofer case) incident normally on the narrow-line grating G is diffracted and
the diffracted beams are collected and focused by the objective lens L to give a series of
diffraction peaks or spectra situated in the back focal plane of the objective lens. Three
such spectra are shown in Fig. 13.14, the zero order S
0
and the first orders S
1
and S
1
each side. The waves then ‘spread out’ and interfere in the image plane. The wavefronts
are shown on the right of Fig. 13.14; each (curved) line may be considered to represent
the ‘crest’ of the waves. Where all three intersect, at I
1
, I
2
and I
3
, we have complete
constructive interference and these interference maxima reproduce the periodicity of
the grating—in short the line-spacing of the grating is resolved in the image plane. It
is not a ‘perfect’ image because half-way in between I
1
, I
2
and I
3
we see that the two
waves from S
1
and S
1
interfere constructively but that from S
0
interferes destructively
giving ‘subsidiary’maxima of one-third the amplitude (and one-ninth the intensity) of the
maxima at I
1
, I
2
and I
3
. (Such subsidiary maxima are also evident in Fig. 13.13(a)–(c).)
Figure 13.14 may also be used to see the effect of ‘blocking off’ one or more of
the waves emanating from S
0
, S
1
and S
1
. If we ‘block off’, say S
1
then again we have
interference maxima at I
1
, I
2
and I
3
and the amplitude distribution will be a simple cosine
curve, again reproducing the periodicity of the grating. If we ‘block off’ any two, say
S
1
and S
1
, then clearly there will be no interference in the image plane but just (for a
narrow slit grating) a uniform distribution of light—the periodicity of the grating is not
resolved. Finally (and this is an important case), if we ‘block off’ the zero order, S
0
, then
we have constructive interference (for the waves from S
1
and S
1
)atI
1
, I
2
and I
3
and
half-way in between giving a (cosine curve) of periodicity twice that of the grating.
In order to demonstrate his theory of image formation (which was by no means
immediately accepted, particularly by the English amateur microscopists), Abbe devised
a special slide carrying diffraction gratings—the Diffraktionsplatte—together with a
device enabling diaphragms to be inserted into the objective lens back focal plane to
prevent (i.e. ‘block off’) some parts of the diffraction pattern from contributing to the
image. This equipment was included in the Zeiss catalogue in 1878 and was available
intermittently until the 1960s. Abbe’s demonstrations have since been extended by Dr
P.J. Evennett,
2
examples of which are shown in Figs 13.15 and 13.16.
2
P.J. Evennett, Abbe and the development of the modern microscope, Proc. Roy. Micros. Soc., 31, 283
(1996).
330 Fourier analysis in diffraction and image formation
0
1
2
3
4
5
6
0 to 5th Order
0
1
2
3
4
5
6
0 to 9th Order
6
0 to 40th Order
5
4
3
2
1
0
ad
0
1
2
3
4
5
6
7
(A
n
)
2
(A
n
)
2
(A
n
)
2
(A
n
)
2
(a)
(c)
(b)
(d)
0 to 2nd Order
Fig. 13.13. The image of a diffraction grating with a ‘square-top’ waveform (as in Fig. 13.7(a)),
a/d = 4 synthesized with an increasing number of Fourier terms (a)–(d). (Courtesy of Mr D.G. Wright.)
I
1
S
1
S
0
S
1
L
5
I
2
I
3
Fig. 13.14. Abbe’s representation of image formation in a microscope. A plane wave (left) incident
upon a narrow-slit grating G is diffracted and the sets of parallel diffracted beams are intercepted and
focused by the objective lens L to give diffraction peaks (or spectra) S
0
, S
1
and S
1
situated in the back
focal plane, the light from which interferes to give maxima I
1
, I
2
and I
3
in the image plane (see text).
13.4 Abbe theory of image formation 331
(a)
1st order
2nd order 1st order
1st order Zero order
zero order
zero order only
Coarse grating
Coarse grating
Fine grating
Fine grating
–1st order
–1st order
–1st order
–2nd order
zero order
(b)
Fig. 13.15. (a) The image of a diffraction grating consisting of coarse and fine line spacings and the
corresponding diffraction pattern. (b) The image showing loss of resolution of the fine lines when the
first-order diffraction spots are excluded by a slit-diaphragm. (Courtesy of Dr P.J. Evennett.)
Figure 13.15(a) shows the image of a diffraction grating with regions with two line
spacings and the corresponding diffraction pattern taken from both regions with the
diffraction spots labelled accordingly. When a wide-slit diaphragm is inserted as in
Fig. 13.15(b) the first-order spots from the fine grating do not contribute to the image
and the lines are not resolved. Similarly, Fig. 13.16(a) shows the image of a square
cross-grid grating and its associated diffraction pattern (see also Figs 7.1 and 7.3). When
a slit diaphragm is inserted as in Figs 13.16(b) and (c), the periodicity is only resolved
in the direction normal to the lines of the diffraction spots—and the spacing of the lines

332 Fourier analysis in diffraction and image formation
(c)
Fig. 13.16. (a) The image of a square cross-grid grating and the corresponding diffraction pattern.
(b) and (c) The periodicity of the grating is only resolved in the direction normal to the line of diffraction
spots which contribute to the image. (Courtesy of Dr P.J. Evennett.)
is of course inversely proportional to the spacings of the diffraction spots. We have,
in short, the relationship between the lattice and the reciprocal lattice. How simple
it all is!

Appendix 1
Computer programs, models and
model-building in crystallography
Computer programs now contribute a significant ‘learning resource’ in crystallogra-
phy since, unlike the illustrations in books, images of crystal structures, lattices and
space groups can be created and orientated at will such that a student can more readily
appreciate the dispositions of atoms and symmetry elements. The same applies to the
three-dimensional construction of the Ewald reflecting sphere and reciprocal lattice in
providing an understanding of the geometry of diffraction. Moreover, some computer
programs make use of anaglyphs such that the images appear to ‘emerge’from the screen
as three-dimensional objects when viewed with the appropriate left and right eye filter
spectacles.
It might be supposed therefore that such computer programs have superseded models
as a learning resource. I believe that this is not the case: what is missing is the tangible
element, the enhancement of understanding brought about by the link between hand
and eye. In short, models provide the basis for crystallographic object lessons. And
by models I do not only mean the crystal-model building kits which are commercially
available but the simpler ones which you can make yourself from cardboard or plastic
spheres or even such everyday objects as clothes pegs, tennis balls or plant stems which
provide the very first lessons in understanding symmetry.
Listed below are (1) a selection of computer programs which are of value in learning
crystallography (though many include also much more advanced material) and (2) some
suggestions for model-building and a list of suppliers of model-building kits.
A1.1 Computer programs in crystallography
The International Union for Crystallography (IUCr) maintains a website with links to
many others. Its URL is:
(IUCR) http://www.iucr.org/
Useful links are to the American Crystallographic Association (ACA), the British Crys-
tallographicAssociation (BCA), CrystallographyWorld-Wide (CWW) and the European
Crystallographic Association (ECA) whose URLs are:
(ACA) http://www.hwi.buffalo.edu/ACA/
(BCA) http://bca.cryst.bbk.ac.uk/BCA/index.html
(CWW) http://www.iucr.org/cww-top/crystal.index.html
(ECA) http://area.ba.cnr.it/eca/
The following list provides brief descriptions of some programs currently available.