Hammond C. The Basics of Crystallography and Diffraction
Подождите немного. Документ загружается.

224 The diffraction of X-rays
002
202
(a)
(b)
102
201
101 001
200
212
211
210 110 010
10°
10°
111 011
112 012
100
000
10°
10°
201
202
211
212 112 012
111 011
102 002
101 001
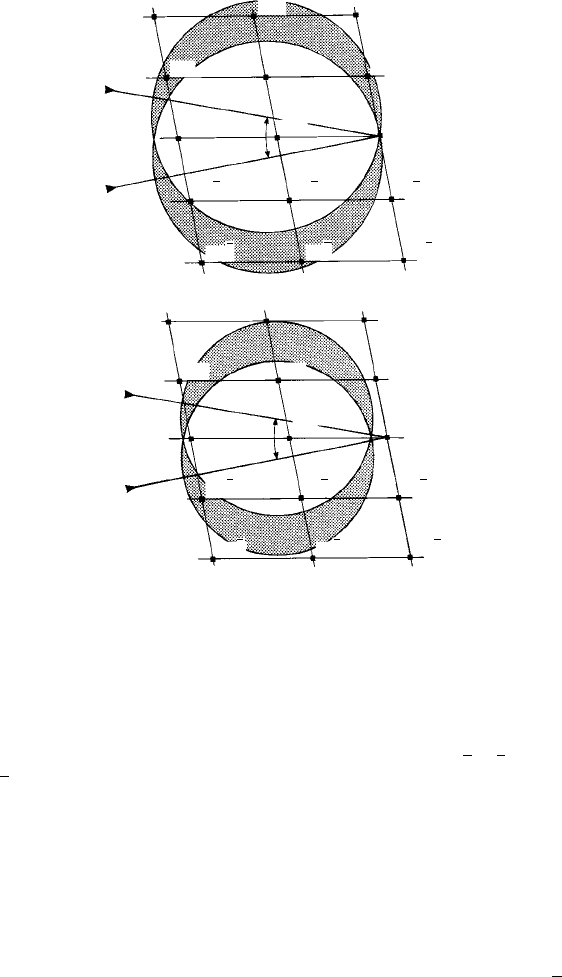
Fig. 9.15. The Ewald reflecting sphere construction for a monoclinic crystal in which the incident
X-ray beam is oscillated ±10
◦
from the direction of the a
∗
reciprocal lattice vector about the [010]
direction (y-axis, perpendicular to the plane of the paper). The directions of the X-ray beams and the
corresponding surface of the reflecting sphere are shown at the limits of oscillation. Any reciprocal
lattice points lying in the regions of reciprocal space through which the reflecting sphere passes (the
shaded regions, called ‘lunes’) give rise to reflections, (a) The h0l reciprocal lattice section through the
origin and a diametral section of the reflecting sphere and (b) the h1l reciprocal lattice section (i.e. the
layer ‘above’ the h0l section) and the smaller, non-diametral section of the reflecting sphere (compare
with Fig. 8.6). In these two sections the planes which reflect are 201, 102, 001,20
1, 102 (zero layer line)
and 112, 21
1 (first layer line above).
incident beam) such that reflections at all angles can be recorded. Now, all the reflected
beams from the h0l reciprocal lattice section (Fig. 9.15(a)) lie in the plane of the paper
and thus lie in a ring around the film. The reflected beams from the h1l reciprocal lattice
section lie in a cone whose centre is the centre of the Ewald sphere and these beams also
intersect the film in a ring ‘higher up’than the ring from the h0l reciprocal lattice section.
Figure 9.16(a) shows this geometry for the reflected beams from the h0l, h1l, h
1 l, h2l,
etc. sections of the reciprocal lattice.
When the film is ‘unwrapped’ and laid flat, the rings of spots appear as lines, called
layer lines (Fig. 9.16(b)), the ‘zero layer line’spots from the h0l reciprocal lattice section
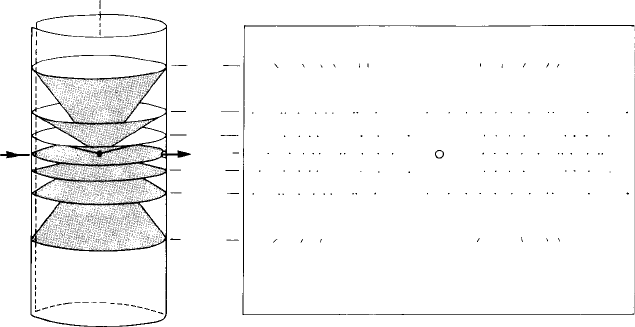
9.5 Fixed λ, varying θ X-ray techniques 225
k = 3
[010]
X
k = 2
k = 1
k = 0
k = –1
k = –2
k = –3
(a) (b)
Fig. 9.16. (a) The oscillation photograph arrangement with the crystal at the centre of the cylindrical
film. The oscillation axis [010] is co-axial with the film and the reflections from each reciprocal lattice
section (h0l), (h1l), (h
¯
1l), (h2l) etc. lie on cones which intersect the film in circles. X indicates the
incident beam direction and in (b), showing the cylindrical film ‘unwrapped’, O indicates the exit beam
direction through a hole at the centre of the film.
through the centre, the ‘first layer line’ spots from the h1l reciprocal lattice section next
above—and so on for all the reciprocal lattice sections perpendicular to the axis of
oscillation.
In practice it is necessary to set up a crystal such that some prominent zone axis is
along the oscillation axis, such as, in our case, the [010] axis. This implies that the
reciprocal lattice sections or layers perpendicular to the oscillation axis are well defined
and give rise to clearly defined layer lines on the film. If, for example, we set a cubic
crystal with the z-axis or [001] direction along the axis of oscillation, then the reciprocal
lattice sections giving the layer lines would be hk0 (zero layer line), hk1 (first layer line
above) and so on (see Figs 6.7 or 6.8). If on the other hand the crystal was set up in
no particular orientation, i.e. no particular reciprocal lattice section perpendicular to the
axis of rotation, the layer lines would, correspondingly, hardly be evident.
9.5.2 The rotation method
As the angle of oscillation increases, the Ewald reflecting sphere sweeps to and fro
through a greater volume of reciprocal space, the lunes (Fig. 9.15) become larger and
overlap and more reflections are recorded. The extreme case is to oscillate the crystal
±180
◦
—but this is the same as rotating it 360
◦
, in which case the Ewald reflecting sphere
makes a complete circuit round the origin of the reciprocal lattice. As the Ewald sphere
sweeps through the reciprocal lattice, a plane will reflect twice: once when it crosses
‘from outside to inside’ the reflecting sphere and once when it crosses out again, the

226 The diffraction of X-rays
Fig. 9.17. A single crystal c-axis rotation photograph of α-quartz showing zero, hk0, first order, hk1
and hk
¯
1 and second order hk2 and hk
¯
2 layer lines. (Photograph by courtesy of the General Electric
Company.)
reflections being recorded on opposite sides of the direct beam. Rotation photographs
are generally used to determine the orientation of small single crystals. An example is
given in Fig. 9.17.
9.5.3 The precession method
This is an ingenious and useful technique invented by M. J. Buerger
∗
by means of which
(unlike oscillation and rotation photographs), undistorted sections or layers of reciprocal
lattice points may be recorded on a flat film. It is probably easiest to appreciate the
geometrical basis of the method by using, as an example, a simple cubic crystal.
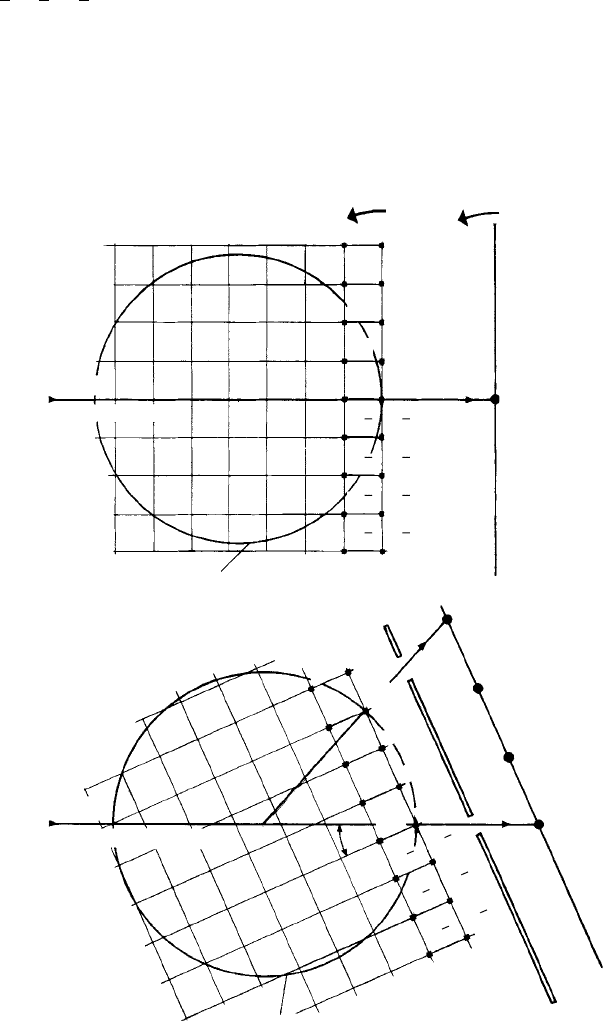
Figure 9.18(a) shows an (h0l) section of a simple cubic crystal (drawn with the y-axis
or b
∗
reciprocal lattice unit cell vector perpendicular to the page). The X-ray beam is
incident along the x-axis or a
∗
reciprocal lattice unit cell vector and the Ewald reflecting
sphere for a particular wavelength is centred about the incident beam direction. The
flat film is set perpendicular to the X-ray beam. We are now going to consider the
conditions by which we can obtain reflections from the reciprocal lattice points lying
in the plane 0kl—i.e. the plane through the origin and perpendicular to the x-axis or a
∗
reciprocal lattice vector. Figure 9.18(a) shows only one row of these reciprocal lattice
points—001, 002, 003, 00
1, 002, 003, etc.; the others are above and below the plane
of the diagram. Now, ignoring for the time being the reciprocal lattice points not lying
in this plane 0kl, let us consider the movements necessary to bring 001, 002, 003, etc.
reciprocal lattice points into reflecting positions. Clearly, we need to tilt or rotate the
crystal anticlockwise such that first 001, then 002, then 003, etc. successively intersect
the sphere. As we do so we tilt or rotate the film anticlockwise by the same angle (the film
and crystal rotation mechanisms being coupled together). The 001, 002, 003 reflections
then strike the film successively at equally spaced distances from the origin 000. The
situation in which 003 is in the reflecting position at a tilt or rotation angle φ is drawn
in Fig. 9.18(b). Clearly, if we rotate the crystal and film clockwise we would record the
∗
Denotes biographical notes available in Appendix 3.
9.5 Fixed λ, varying θ X-ray techniques 227
00
1, 002, 003, etc. reflections on the opposite side of the film from the origin. The result
(ignoring reflections from reciprocal lattice points not lying on this row) would be a row
of equally spaced spots on the film corresponding to the equally spaced reciprocal lattice
points in the row through the origin. These are shown on a plan view of the film (Fig.
9.18(c)), as the vertical row of spots through the centre.
Coupled rotation of
film and crystal
film
000
104 004
103 003
102
Incident
beam along x-axis
Ewald reflecting sphere
(b)
Incident
beam tilted f° from x-axis
f
(a)
002
101 001
100 000
101
101
102 002
103 003
104 004
003
Film
002
001
000
Ewald reflecting sphere
Screen with
annular opening
001
000
001
002
003
004
104
103
102
101
100
101
102
103
003
002
Fig. 9.18. (continued)
228 The diffraction of X-rays
003
Annular opening of
screen
Plan view
of film
Precession of film
(c)
022
021
030
021
022 012
002 012
022
003
011
001
011 021
020
010
000
010 020
011 001
011 021
012 002
012 022
0kl section of
reciprocal lattice
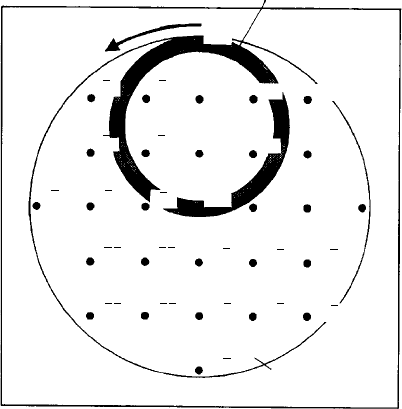
Fig. 9.18. The geometry of the precession method, (a) The incident beam normal to the 0kl section of
the reciprocal lattice (indicated by the row of reciprocal lattice points 001, 002, 003, etc.). In order to
bring these points into reflecting positions the crystal and the film are rotated anti-clockwise as indicated.
The situation in which the 003 reciprocal lattice point is in a reflecting position is shown in (b). (c) A
plan view of the film at this angle φ with the circle representing the intersection of the 0kl plane and the
reflecting sphere and the projection of the annulus on to the screen. The only reflections to reach the film
are those falling within the annulus (shaded region), As the crystal + screen + film are precessed about
the angle φ the annulus effectively sweeps through the 0kl section of the reciprocal lattice as indicated
by the arrow and all reciprocal lattice points within the large circle give rise successively to reflections.
Now wehave to considerthereciprocal lattice pointsin the 0kl sectionof the reciprocal
lattice which intersect the Ewald reflecting sphere above and below the plane of Fig.
9.18(b). The sphere intersects the reciprocal lattice section 0kl in a circle, Fig. 9.18(c);
any reciprocal lattice point lying in this circle gives rise to a reflected beam. Now we
precess the crystal and the film about the incident beam direction such that the film is
always parallel to the 0kl reciprocal lattice section (the precession movement means that
the x-axis of the crystal rotates about the incident beam direction at the fixed angle φ).
As we do so the circle moves through the reciprocal lattice section in an arc centred at
the origin 000 of the reciprocal lattice, i.e. about the direction of the direct X-ray beam.
Hence, in a complete revolution, all the reciprocal lattice points lying within the large
circle of Fig. 9.18(c) reflect—and the pattern of spots on the film corresponds to the
pattern of reciprocal lattice points in the 0kl section of the reciprocal lattice, as shown
in Fig. 9.18(c).
Finally, we have to eliminatethe complicating effectsof the reflectionsfrom reciprocal
lattice points not lying in the 0kl plane through the origin. This is achieved by placing a

9.6 X-ray diffraction from single crystal thin films and multilayers 229
Fig. 9.19. A(zero level)precession photograph oftremolite, Ca
2
Mg
5
Si
8
022(OH)
2
(monoclinic C2/m,
a = 9.84 Å, b = 18.05 Å, c = 5.28 Å, β = 104.7
◦
), showing reflections from the h0l reciprocal
lattice section (incident beam along the y-axis). The orientations of the reciprocal lattice vectors a
∗
and c
∗
are indicated. Compare this photograph with the drawing of the (h0l) reciprocal lattice section
of a monoclinic crystal (Fig. 6.4(c)). The streaking arises from the presence of a spectrum of X-ray
wavelengths in the incompletely filtered MoKα (λ = 0.71 Å) X-radiation. (Photograph by courtesy of
Dr. J. E. Chisholm.)
screen with an annular opening between the crystal and the film, the size of the annulus
being chosen to allow reflections to pass to the screen only from reciprocal lattice points
lying in the circle (Fig. 9.18(c)). The screen is indicated in cross-section in Fig. 9.18(b)
for the case in which the furthest reciprocal lattice point from the origin which can be
recorded is 003. The screen is also linked to the crystal–film precession movements.
The precession method can be modified to record reciprocal lattice sections which
do not pass through the origin (non-zero-level photographs), details of which can be
found in the books on X-ray diffraction techniques listed in Further Reading. Its main
application is in crystal structure determination by measurement of the intensities of
the X-ray reflections. Figure 9.19 shows an example of a zero-level photograph (of a
reciprocal lattice section passing through the origin) which shows very convincingly the
pattern of reciprocal lattice points.
9.6 X-ray diffraction from single crystal thin films
and multilayers
Thin films and multilayer specimens are invariably studied using the X-ray diffractome-
ter, the geometrical basis of which is described in detail in Section 10.2.

230 The diffraction of X-rays
2/l (Smallest value of d
hkl
)
2/l
2/l
Plane parallel to
specimen surface
Maximum angle of
specimen tilt for
plane d
hkl
u
u
u
u
n
(a)
(c)
(b)
n
a
a
(u + a)
(u – a)
Reciprocal lattice point
of reflecting plane
Fig. 9.20. The X-ray diffractometer arrangements for a single crystal. (a) The symmetrical setting:
the reciprocal lattice vectors of the reflecting planes are all parallel to the specimen surface normal n. (b)
The asymmetrical setting, the reciprocal lattice vectors of the reflecting planes are inclined at angle α to
n. (c) The region of reciprocal space (shaded) within which lie the reciprocal lattice points of possible
reflecting planes.
The normal arrangement, as used in X-ray powder diffractometry, is the symmetri-
cal (Bragg–Brentano) one in which only the d-spacings of those planes parallel to the
specimen surface are recorded. This is achieved by arranging the X-ray source and X-
ray detector and their collimating slits such that the incident and reflected beams make
equal angles to the specimen surface. The arrangement is shown diagrammatically in
Fig. 9.20(a). As the angle θ is varied (either by keeping the specimen fixed and rotat-
ing the source and detector in opposite senses as indicated in Figs 10.3(a) and (b), or
by keeping the source fixed and rotating the detector at twice the angular velocity of
the specimen), reflections occur whenever Bragg’s law is satisfied. Clearly, for a single
crystal, with only one set of planes parallel to the surface, there will only be one Bragg
reflection. For multilayer specimens, which may consist of a sequence of thin crystal
films (say, of copper and cobalt) mounted on a single crystal substrate, there will be three
Bragg reflections—one from the substrate and one each from the thin films (of different
crystal structure).
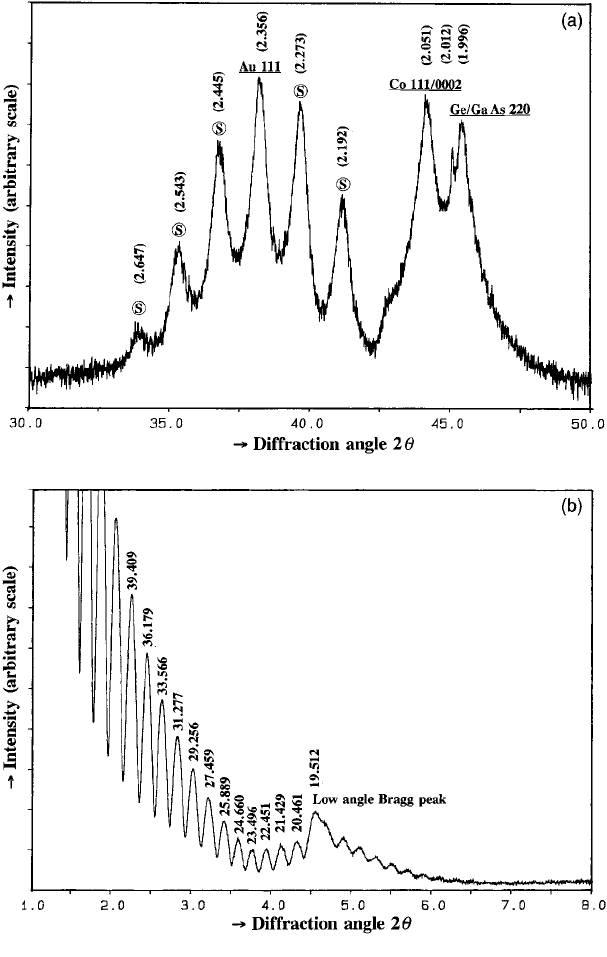
However, there are more diffraction phenomena to be recorded. First, since the lay-
ers are generally thin—of the order of 1–10 nm—the (high angle) Bragg peaks are
substantially broadened and this may be used to estimate the thickness of the layers by
means of the Scherrer equation (Section 9.3). Second, the repeat distance, or superlattice

9.6 X-ray diffraction from single crystal thin films and multilayers 231
wavelength of the layers can be determined from the angles of ‘satellite’ reflections
which occur (given a multilayer specimen with a long range structural coherence) on
either side of the (high angle) Bragg peaks. The value of may be determined from the
equation
=
λ
2(sin θ
2
− sin θ
1
)
where λ = the X-ray wavelength and sin θ
1
, sin θ
2
are the Bragg angles of adjacent
satellite peaks. This equation may be rearranged to give
1
=
1
d
2
−
1
d
1
where d
1
, d
2
are the notional d -spacings of the satellite peaks. An example of a cobalt-
gold multilayer specimen is given in Fig. 9.21(a).
The repeat distance of the layers also gives rise to low-angle Bragg reflections (of
the order 2θ = 2 − 5
◦
), between which occur a further set of satellite peaks or fringes
called Keissig fringes which may be used to determine the total multilayer film thickness
N using an analogous equation to that above, viz.
1
N
=
1
d
k2
−
1
d
k1
where d
k1
, d
k2
are the notional d-spacings of any pair of adjacent Keissig fringes. An
example of a cobalt–copper multilayer specimen is given in Fig. 9.21(b).
The occurrence of the low-angle Bragg peaks and Keissig fringes may be understood
by analogy with the diffraction pattern from a limited number N of slits of width a
(Section 7.4); Fig. 7.9 shows a particular case for N = 6. The principal maxima cor-
respond to the low-angle Bragg peaks in which the slit spacing a corresponds to the
repeat distance of the layers, or superlattice wavelength . The subsidiary maxima, of
which there are (N −2) between principal maxima, correspond to the Keissig fringes; by
counting the number of Keissig fringes (plus two) between the low-angle Bragg peaks
the number of multilayers or superlattice wavelengths N can be determined and by mea-
suring the angles between adjacent fringes the total thickness N of the multilayers can
be determined using the equation given above. Its validity can be checked by applying it,
say, to the subsidiary maxima in Fig. 7.9; for the zero and first order minima the sin α ≈
α ≈ 2θ values are 1(λ/6a) and 2(λ/6a). Substituting these values in the above equation
gives N = 6a, the total width of the grating.
In practice in X-ray diffraction the Keissig fringes are most clearly defined between
the direct beam (zero order peak) and first low-angle Bragg peak (Fig. 9.21(b)).
The other arrangement used in X-ray diffractometry is the asymmetrical one in which,
for any particular Bragg angle (source and detector fixed), the specimen can be rotated
such that the incident and diffracted beams make different angles to the specimen surface
(the angle between them remaining fixed at 2θ). The arrangement is shown diagrammat-
ically in Figs 9.20(b) and 10.3(c). It has the advantage in that reflections from planes
which are not parallel to the surface can be recorded (and is also a useful means of ‘fine
232 The diffraction of X-rays

9.7 X-ray (and neutron) diffraction from ordered crystals 233
tuning’ the angle of the specimen to maximize the intensity of reflections from planes
which may not be exactly parallel to the specimen surface). Clearly, the maximum angle
of tilt either way is θ, otherwise the surface of the specimen will block or ‘cut off either
the incident or the diffracted beam.
The Ewald reflecting sphere construction, which shows the extent to which the sym-
metrical and asymmetrical techniques sample a volume of reciprocal space, is shown in
Fig. 9.20(c). The construction is essentially two-dimensional, since only those planes
whose normals lie in the plane of the diagram (co-planar with the incident and reflected
beams) can be recorded. In the symmetrical case (Fig. 9.20(a)), the reciprocal lattice
points of the reflecting planes lie along a line perpendicular to the specimen surface
whose maximum extent corresponds with the reciprocal lattice vector of the plane
of smallest d
hkl
-spacing that can be measured, i.e. that for which θ = 90
◦
; hence
|d
∗
hkl
|=2/λ.
In the asymmetrical case (Fig. 9.20(b)) the crystal can be tilted or rotated clockwise
or anticlockwise such that the reciprocal lattice vector of the reflecting planes is also
tilted or rotated with respect to the specimen surface. The angular range, ±θ (limited
by specimen cut-off), increases as |d
∗
hkl
|=2 sin θ
λ increases, the maximum being
±90
◦
when sin θ = 1. This is shown as the shaded region in Fig. 9.20(c). Clearly,
the choice of the wavelength of the X-radiation may be important, particularly in the
asymmetrical case, since it determines which crystal planes in the specimen may, or may
not, be recorded.
9.7 X-ray (and neutron) diffraction from ordered crystals
In metal alloys, solid solutions may be of two kinds—interstitial solid solutions such
as, for example, carbon in iron (see p. 17) and substitutional solid solutions, such as,
for example, α-brass where zinc atoms substitute for copper atoms in the ccp structure.
In some cases complete solid solubility is obtained across the whole compositional
range from one pure metal to another—such as, for example, copper and nickel, both
Fig. 9.21. (a) A high angle X-ray diffraction trace (CuKα
1
radiation) from a cobalt–gold multilayer
specimen showing the satellite peaks or fringes
s
each side of the Au 111 Bragg reflection. The repeat
distance of the layers is determined by measuring the (notional) d-spacings d
1
and d
2
of adjacent
fringes and using the equation on page 231. The notional d -spacings (Å) of the fringes and the Au 111
peak are indicated (from which a value of ≈ 64 Å is obtained). The group of higher angle reflections
are from Co 111, Co 0002, the substrate GaAs 110 and the ‘buffer’ layer Ge 110. (b) A low angle X-ray
diffraction trace (CuKα
1
radiation) from a cobalt–copper multilayer specimen showing the low angle
Bragg reflection at 4.525
◦
and the Keissig fringes each side. The Bragg peak gives the multilayer or
superlattice repeat distance and the number N − 2 of Keissig fringes between the Bragg peak and
zero angle gives N , the total thickness. In this example = 19.512 Å and (N − 2) = 22 (only
those fringes from about 2θ ≈ 1.5
◦
are shown). Hence the total thickness N = 468.3 Å. N may
also be determined by measuring the (notional) d-spacings, d
Kl
and d
K2
of adjacent Keissig fringes
and using the equation on page 231. The notional d-spacings (Å) of fringes 11 to 22 are indicated,
from which values of N , in fair agreement with that given above (subject to experimental scatter), are
obtained.
