Gupta D. (Ed.). Diffusion Processes in Advanced Technological Materials
Подождите немного. Документ загружается.


502 DIFFUSION PROCESSES IN ADVANCED TECHNOLOGICAL MATERIALS
observed that long-range Cu diffusion is a difficult process in both the
Cu (1)-O (1) chains and the Cu (2)-O (2) planes. If a certain amount of
thermal vacancies are assumed to exist on the Cu sites, similar to those
commonly observed in the metal and transition-metal oxides,
[20, 21]
Cu
diffusion is possible without the mediation of oxygen vacancies or
excursions on the oxygen sublattice. Cu atom migration could then be
thought to take place in all combinations of atomic jumps of the types
110, 301, and 031, as shown in Fig. 10.8. For example, Cu
atoms would diffuse along the Cu (1)-Cu (1) diagonal in the basal
plane, along Cu (2)-Cu (2) diagonals in the Cu-O planes and (001) planes,
and so forth. Note that communication between the chains and planes
is permissible only by the diagonal jumps between Cu (1)-Cu (2) sites.
The alternative Cu (2)-Cu (2) jumps along 001 are somewhat
shorter, but their contribution to diffusion may not be substantial. Since
there would be fewer thermal vacancies in the Cu sites than in the oxy-
gen O (1) sites, and they would be accompanied by longer jumps,
cation diffusion may be expected to be very slow. Therefore, both D
o
and Q would be larger for cation diffusion compared to anion diffusion
in the YBCO lattice and they may resemble the corresponding values in
closely packed lattices of pure metals, such as Cu.
[22]
The analysis can
be extended to show that cation diffusion in the YBCO lattice resem-
bles self-diffusion in the Cu lattice. From the lattice parameters of the
neutron diffraction studies,
[19]
an average length of 5.5Å for the
Cu (1)-Cu (1), Cu (1)-Cu (2), and the Cu (2)-Cu (2) diagonal jumps (l)
may be estimated. To the first approximation, the pre-exponential term
D
o
(cm
2
/sec) may be written as:
D
o
(cm
2
/sec) l
2
n e
(∆S/k )
, (1)
where n is the lattice frequency 7 10
12
/sec, ∆S is the entropy for dif-
fusion, and k is the Boltzmann constant. Hence the measured value of D
o
(Table 10.1) for Cu in YBCO leads to the entropy ∆S 5k. The corre-
sponding value for self-diffusion in Cu is ∆S
3k.
[22]
Considering the
dissimilarities of the lattice and the nature of the nearest neighbors,
entropy as well as the enthalpy for Cu cation diffusion in the YBCO have
values similar to those for Cu self-diffusion in the Cu metal. Note that the
orthorhombic to tetragonal transformation has no effect on cation diffu-
sion kinetics. The Arrhenius plot, shown in Fig. 10.7, remains straight
through the transformation that occurs at 700°C. This is consistent with the
fact that the YBCO cell volume is preserved during this second-order
transformation.
[19]
The cation diffusion processes are, however, expected
to be anisotropic, but the available data are sparse. Considering the diffusion
Ch_10.qxd 11/12/04 4:32 PM Page 502

DIFFUSION IN SOME PEROVSKITES, GUPTA 503
mechanism proposed above for Cu, we do not expect any significant
anisotropy for Cu diffusion, although it is not ruled out for the Ba and Y
species.
10.2.3.2 Self-Diffusion of Ba and Y in YBCO
As Fig. 10.8 shows, both Ba and Y atoms are deeply embedded in the
YBCO lattice, and their atomic movement is expected to be even more
difficult than Cu. Diffusion of Ba and Y atoms would require excursions
to the Cu sites, which would disturb the thermodynamic equilibrium of
the occupancy of sites. In addition, the chemical environments for Ba and
Y cations are different than that of Cu. Ba resides in Ba-O insulating lay-
ers, while Y is surrounded by Cu (2)-O layers, which have partially free
electrons. Thus the state of defects, the energetics, and the diffusion paths
for Ba and Y may be expected to be vastly different. A long-range diffu-
sive motion may in fact involve cooperative atomic jumps between the Cu
and Ba or Y sites. The activation energies for Ba and Y diffusion are
expected to be much larger than that for Cu, and diffusion is likely to be
highly anisotropic. Table 10.1 shows that the activation energies measured
by Chen et al.
[9]
for Ba and Y species are indeed very large, of the order
of 900 to 1000 kJ/mol, and diffusion of Ba shows an anisotropy of at least
1000. These activation energies are similar to those observed for steady-
state creep in transition metal oxides.
10.2.4 Diffusion of Cation Impurities in YBCO
Bulk and thin-film YBCO specimens described in Sec. 10.2.1 were
used to study diffusion of the
63
Ni cation
[6, 7]
under an oxygen pressure of
10
5
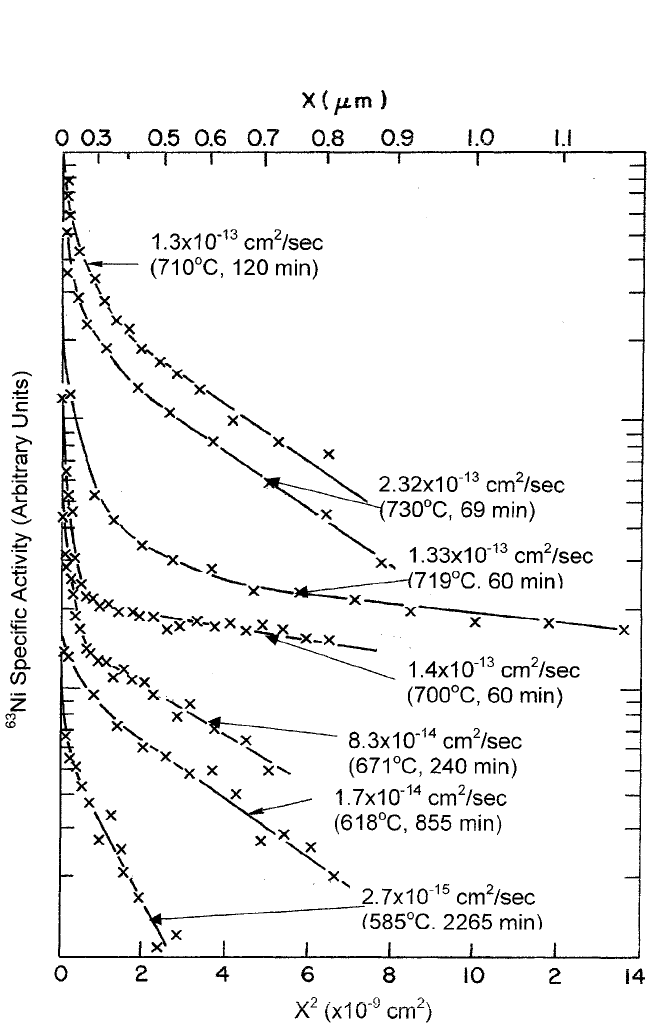
Pa. The corresponding diffusion profiles, plots of the log-specific
activity versus the square of the cumulative penetration distance, are
shown in Fig. 10.9(a) and (b). All
63
Ni diffusion profiles displayed in
Fig. 10.9, in bulk as well as the epitaxial thin-film specimens, showed ini-
tially high data points and subsequently became linear. Unlike
67
Cu tracer
(see Fig. 10.6), which should not have had any problems of solubility in
the host YBCO specimens, the
63
Ni tracer may have exceeded the solubil-
ity limit because
63
Ni has a half-life of 85 years and a large number of Ni
atoms are required to obtain detectable radioactivity. Therefore, we relied
on the deeper linear (Gaussian) segments of the
63
Ni profiles to extract the
diffusion coefficients. Thus,
63
Ni diffusion coefficients have been obtained
by fitting the Gaussian solution of the Fick’s law for an instantaneous
Ch_10.qxd 11/12/04 4:32 PM Page 503
504 DIFFUSION PROCESSES IN ADVANCED TECHNOLOGICAL MATERIALS
Figure 10.9(a)
63
Ni radiotracer diffusion penetration profiles in bulk polycrystalline
YBa
2
Cu
3
O
7x
specimens.
[7]
Ch_10.qxd 11/12/04 4:32 PM Page 504
DIFFUSION IN SOME PEROVSKITES, GUPTA 505
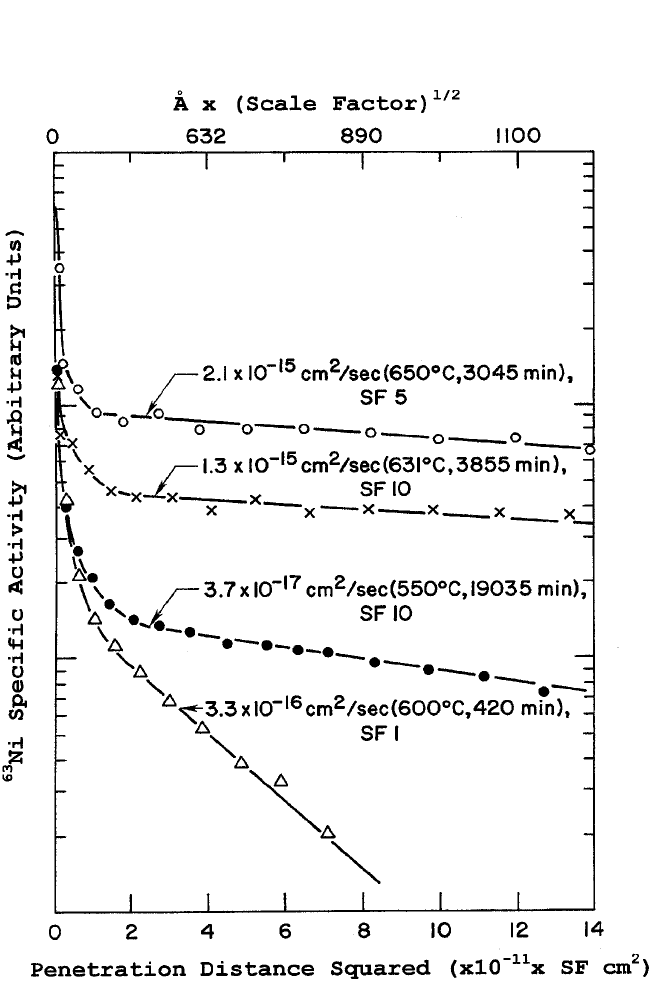
Figure 10.9(b)
63
Ni radiotracer diffusion profiles in YBa
2
Cu
3
O
7x
epitaxial thin films
on (100) SrTiO
3
substrate. Note the scale factor (SF) for the abscissa marked on
each profile.
[6]
Ch_10.qxd 11/12/04 4:32 PM Page 505
source and semi-infinite boundary conditions to the linear segments in the
profiles shown in Fig. 10.9(a) and (b).
This section compares and contrasts the impurity cation (
63
Ni) diffu-
sion parameters obtained in polycrystalline bulk and epitaxial films with
similar data in single crystals obtained by Routbort et al.
[8]
Then we exam-
ine diffusion of Co, Cu, Ag, and Zn impurity cations in the polycrystalline
YBa
2
Cu
3
O
7–d
specimens listed in Table 10.1. We first discuss the Ni tracer
diffusion, which behaves more or less similarly to the Cu tracer and is
known to substitute for Cu in the YBCO lattice.
10.2.4.1 Ni Tracer Cation Diffusion in YBa
2
Cu
3
O
7d
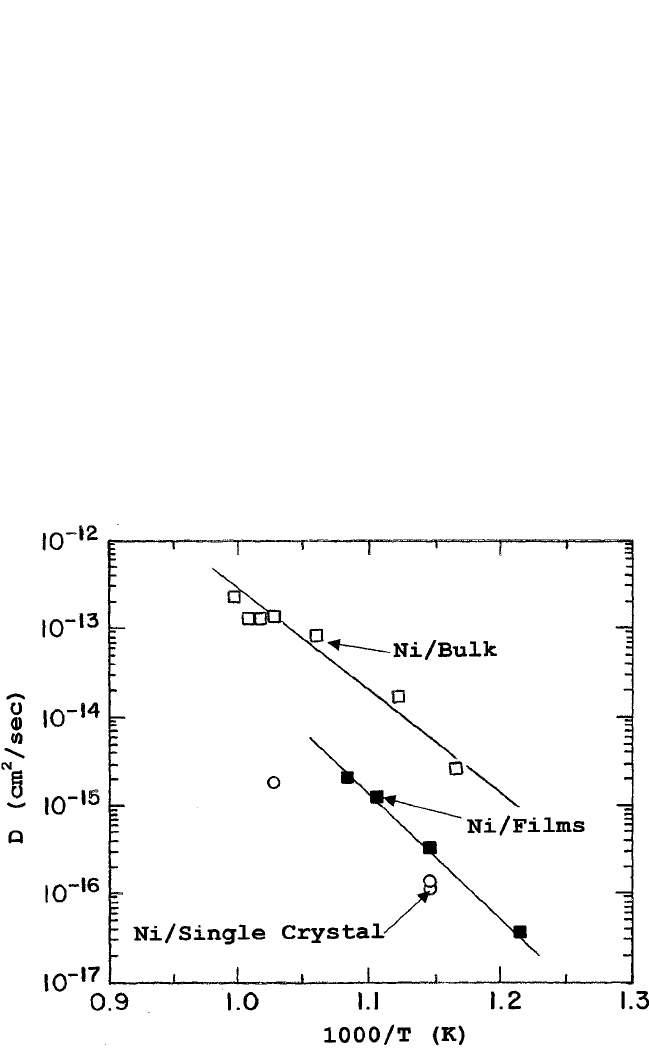
In Fig. 10.10, the Ni diffusion data are plotted for epitaxial,
[6]
poly-
crystalline,
[7]
and single-crystal specimens
[8]
to show the effect of
microstructure and crystal anisotropy. As Table 10.1 shows, the activation
506 DIFFUSION PROCESSES IN ADVANCED TECHNOLOGICAL MATERIALS
Figure 10.10 Arrhenius plots of Ni diffusion in YBa
2
Cu
3
O
7x
polycrystalline bulk,
[7]
epitaxial thin films on (100) SrTiO
3
substrate,
[6]
and single-crystal specimens.
[8]
Ch_10.qxd 11/12/04 4:32 PM Page 506

DIFFUSION IN SOME PEROVSKITES, GUPTA 507
energy for Ni diffusion in the YBCO specimens (epitaxial thin-film, poly-
crystalline, or single-crystal specimens) is very similar to that for the Cu
tracer between 240 to 260 kJ/mol. This is understandable since both
occupy the same sites and have similar electrical charge.
Figure 10.10 shows that the
63
Ni radioactive tracer data in the
(100) epitaxial films agree reasonably well with the secondary ion
mass spectroscopy (SIMS) diffusion data of Ni in the c direction of
single crystals of YBa
2
Cu
3
O
7x
. The principal difference is in D
o
for
the
63
Ni data in polycrystalline bulk specimens due to contributions of
grain boundaries present in the specimens (see Fig. 10.1). The small
difference between the Ni diffusion coefficients in the epitaxial films
and the single crystals seen in Fig. 10.10 may be attributed to the pres-
ence of a higher density of dislocations in the former rather than
anisotropy of the diffusion coefficients, because both were diffused in
the c direction.
10.2.4.2 Cation Impurity Diffusion and Effect of
Charge Imbalance
In Fig. 10.11, impurity cation diffusion for Zn, Ni, Ag, and Co
[6–8]
is
compared with the Cu self-diffusion data.
[7, 8]
Note that charge may be an
important factor in determining the sites occupied by impurity cations;
consequently, the diffusion kinetics will be affected. It is well recognized
that Zn and Ni in low concentrations, of the order of 0.05%, substitute Cu
in Cu (1) sites,
[23]
but in higher concentrations (≈0.30) they occupy Cu (1)
and Cu (2) sites randomly.
[24]
Ag also replaces Cu on Cu (1) and Cu (2)
sites,
[25]
while Co occupies exclusively the Cu (1) sites.
[26]
For radiotracer
studies that involve very small concentrations, we may consider that Zn,
Ni, and Co all go into Cu (1) sites. Because of their close proximity to
oxygen-ion vacancies, diffusion along Cu (1) sites is much faster than
along Cu (2) sites. Furthermore, the valent states of (a) Cu, Zn, (b) Co, Ni,
and (c) Ag are 2, 2 or 3, and Ag 1, respectively. As Fig. 10.11
shows, that diffusion of Zn in bulk YBCO specimens falls on the Cu self-
diffusion Arrhenius plot. This is not surprising since both Cu and Zn have
2 states and Zn occupies Cu (1) sites. Ni diffusion in the epitaxial films
also come very close to the Cu self-diffusion line, indicating that it is
likely to diffuse in the Cu (1) sites in the Ni
2
state. Ag, on the other hand,
diffuses substantially faster than Cu or Zn. Routbort et al.
[8]
have
advanced an explanation to account for this difference: Ag
1
, being nega-
tively charged with respect to the Cu
2
ion it replaces, may attract oxygen-
ion vacancies for charge compensation, thereby lowering the activation
energy for motion at the saddle point. As a converse corollary, if Co
Ch_10.qxd 11/12/04 4:32 PM Page 507
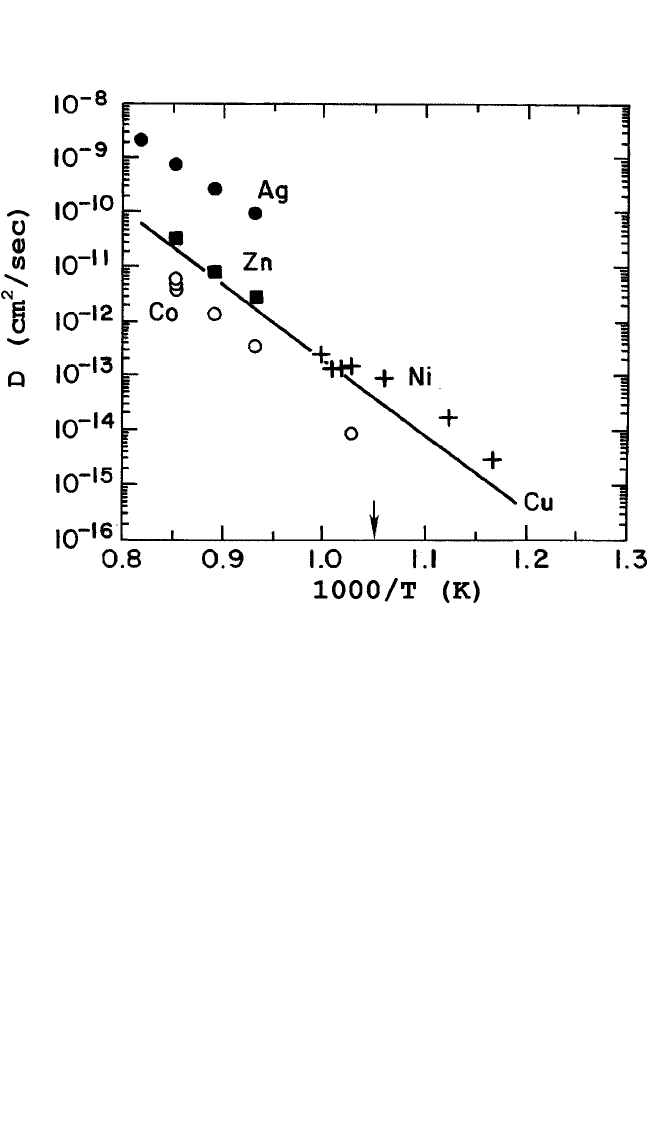
occurred in the 3 state, it should repel oxygen-ion vacancies, increase
the saddle-point energy, and slow down its diffusion. This is, in fact,
observed, as shown in Fig. 10.11. It is therefore seen that diffusion of the
cation impurities, which lie close to Cu in the Periodic Table, is very sim-
ilar to Cu self-diffusion, with some perturbations caused by their charge
dissimilarities, if any.
10.2.4.3 Cation Impurity Diffusion in Piezoelectric Perovskites
Besides cation diffusion in YBCO, similar data are also available in
several other perovskites, notably the single crystals of the PbMnNbO
3
-
PbTiO
3
(PMN-PT) system.
[10]
Figure 10.12 compares Ag radiotracer dif-
fusion in the PMN-PT piezoelectric ceramic and the YBCO. It also shows
the Cu self-diffusion in the YBCO. Ag diffusion in the PMN-PT single
crystals compares well with the self-diffusion of Cu in the HTSC YBCO.
508 DIFFUSION PROCESSES IN ADVANCED TECHNOLOGICAL MATERIALS
Figure 10.11 Comparison of diffusion of cation impurities (Ag, Ni, Co, and Zn) with
Cu self-diffusion in YBa
2
Cu
3
O
7x
. (Table 10.1 gives the source of the data.) The
arrow indicates the orthorhombic-to-tetragonal transformation.
[8]
Ch_10.qxd 11/12/04 4:32 PM Page 508
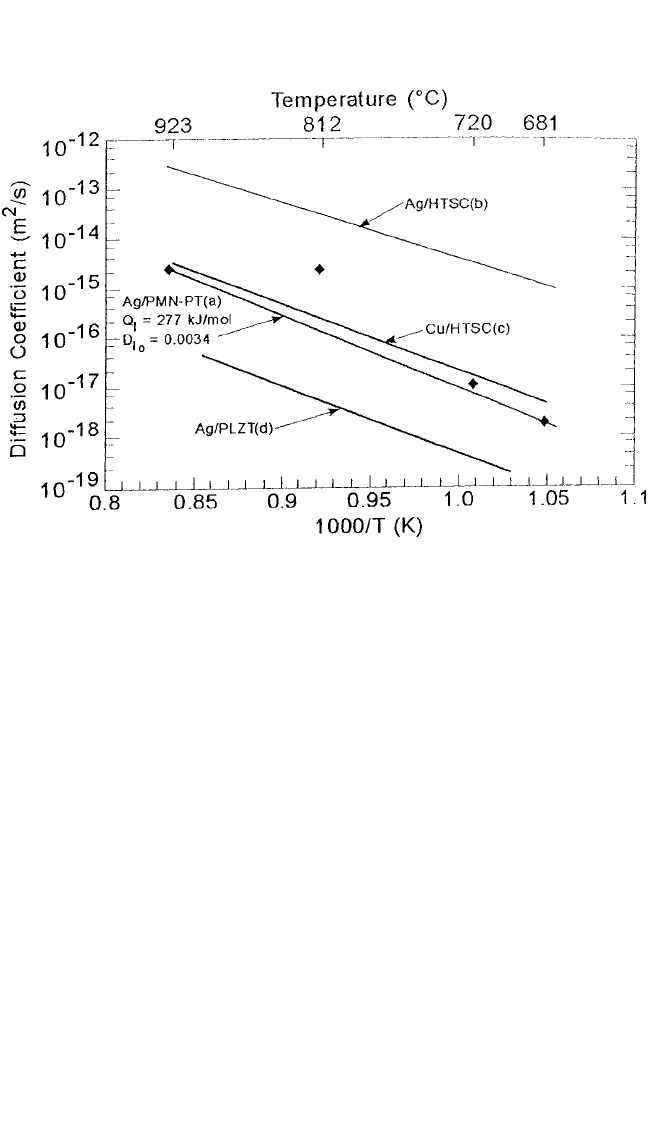
DIFFUSION IN SOME PEROVSKITES, GUPTA 509
The Ag diffusion data in the polycrystalline YBCO, however, are signifi-
cantly higher due to the contribution of the grain boundaries. Nevertheless,
the diffusion process in two perovskites, YBCO and PMN-PT, appears to
be similar and to involve primarily thermal vacancies on Cu or the Pb
sites, respectively.
10.3 Anion Diffusion in Several HTSC
Cuprates
Soon after the discovery of the HTSC cuprates, it was realized that
they were essentially nonstoichiometric compounds and that the deviation
from the stoichiometry (x) is controlled largely by the anion (oxygen)
defect equilibria. The electronic defects, namely the electrons and the
holes, are also related to the defect equilibria. In fact, oxygen stoichiom-
etry turned out to be a critical parameter in determining the supercon-
ducting transition temperature, T
c
, and the critical current, J
c
.
[27]
Diffusion
of anions is also expected to be closely related to the concentration and
Figure 10.12 Arrhenius plots of diffusion of
11 0
Ag in PMN-PT single crystals and
polycrystalline superconducting YBa
2
Cu
3
O
7x
.
67
Cu self-diffusion in the latter is
also shown for comparison.
[10]
(See Table 10.1)
Ch_10.qxd 11/12/04 4:32 PM Page 509

mobility of defects and hence to the stoichiometry of the compounds.
Therefore, it is not surprising that the early investigators noted large
changes in the physical properties of the compounds upon heating and
cooling, notably color, electrical resistance, and specific gravity. Some of
these effects became bases of measurements of fast in-and-out diffusion
of oxygen in these compounds, as discussed later in this section. Fast dif-
fusion kinetics of oxygen in a large number of superconducting cuprates
and their defect equilibria have been comprehensively reviewed by
Routbort and Rothman.
[28]
We will discuss here only the salient features of
oxygen diffusion in the HTSC cuprates and the manner in which they may
be related to self-diffusion of the Cu cation, in YBCO in particular.
Bakker et al.
[29]
provide details of the defect equilibria in YBCO in their
excellent paper.
10.3.1 Oxygen Diffusion Data in HTSC Cuprates
In Table 10.2, we have compiled critical data on oxygen diffusion in
a number of HTSC cuprates measured by the SIMS technique using
18
O
stable isotope. The data are also displayed in Fig. 10.13. The scatter
among data from material to material is rather large, varying 6 to 10
orders of magnitude. The anion diffusion coefficients are also many
orders of magnitude larger than those for cation species (compare data
in Tables 10.1 and 10.2), although in some cases diffusion kinetics
do come close to each other (for example, in YBa
2
Cu
4
O
7d
and
Bi
2
Sr
2
Cu
2
O
x
compounds). For rigorous comparison of diffusion data in
dissimilar compounds, a homologous temperature scale should be used;
however, this is not possible because these compounds decompose and
sublime before melting takes place. Figure 10.8 clearly shows that dif-
fusion of oxygen would be quite complex because it occupies five dif-
ferent kinds of sites due to differing environments, state of occupancy,
and, in particular, ordering of oxygen atoms and vacant sites in the basal
planes. Departure from stoichiometry, as measured by x, is the control-
ling parameter, but it is not a fixed quantity. It increases at higher tem-
peratures and decreasing partial pressure of O
2
. The deviation of the sto-
ichiometry decreases as the occupancy in O (1) and O (4) sites is
reduced and an increase in O (5) sites takes place. The reductions or
increments of occupancy may be neither proportional nor compensatory.
The magnitude of x and its thermodynamic kinetics vary from material
to material. Diffusion of oxygen may also be expected to be anisotropic
by several orders of magnitudes.
[30]
Hence these numerous variables
result in a very large scatter in the diffusion data for oxygen, as seen in
Fig. 10.13. However, meaningful inferences have been drawn from
510 DIFFUSION PROCESSES IN ADVANCED TECHNOLOGICAL MATERIALS
Ch_10.qxd 11/12/04 4:32 PM Page 510

DIFFUSION IN SOME PEROVSKITES, GUPTA 511
Table 10.2. Oxygen Diffusion in Some HTSC Cuprates
Stoichiometry D
o
Q Comment
*
/
No. Host Technique (x) (cm
2
s) (kJ/mol) Reference
1La
2x
Sr
x
CuO
4
0 1.6 10
6
80.0 S [33]
2La
2x
Sr
x
CuO
4
0.10 0.55 10
6
62.6 P [33]
3La
2x
Sr
x
CuO
4
SIMS(
18
O)
0.10 0.2 10
6
77.0 P [34]
4La
2x
Sr
x
CuO
4
0.10 5.9 10
6
126.2 C [33]
5La
2x
Sr
x
CuO
4
0.24 12 234.1 P [33]
6 YBa
2
Cu
3
O
7x
0 1.36 10
4
93.5 P [31]
7 YBa
2
Cu
3
O
7x
Resistance 0.7 3.5 10
2
125.3 P [32]
8 YBa
2
Cu
3
O
7x
Calculation 0.1 0.04 125.3 P [35]
9 YBa
2
Cu
4
O
7x
0 0.08 200.6 P [36]
10 YBa
2
Cu
4
O
7x
075296 C [36]
11 Bi
2
Sr
2
Ca
1
Cu
2
O
x
SIMS (
18
O)
8 1.7 10
5
89.3 P [37]
12 Bi
2
Sr
2
Ca
1
Cu
2
O
x
8 0.6 212.3 C [37]
13 Bi
2
Sr
2
Cu
1
O
x
6 0.06 203.6 AB plane [38]
14 YBa
2
Cu
3
O
7x
Radiotracer 0.1 4.0 255.3 P [6, 7]
67
Cu Cation
15 YBa
2
Cu
3
O
7x
Molecular 0.09 1.4 10
4
94.4 Theory
dynamics [39]
*
P: polycrystalline; C: c axis or AB plane; S: single crystal; NA: not available
these data; these have been summarized by Routbort and Rothman for
YBCO,
[28]
as follows:
1. The measured oxygen tracer diffusion coefficients (D) are
relatively insensitive to the oxygen partial pressure (P
O
2
).
2. The Arrhenius plot at the fixed partial pressure of 10
5
Pa is
straight over a large temperature range and remains unbroken
through orthorhombic-tetragonal transformation, similar to
the Cu cation discussed in Sec. 10.2.
3. In single crystals, D
b
W D
a
at small values of x obtained at
300°C and P
O
2
10
5
Pa, but D
b
≈ D
a
at higher values of x
obtained at 600°C and P
O
2
2 10
4
Pa, where the subscripts
a through c refer to a and b directions in the AB plane and c
is the direction normal to it (see Fig. 10.8).
4. D
c
V D
ab
at low temperatures, and both Qand D
o
are much larger
in the c direction, indicating that oxygen diffusion is occurring by
individual lattice vacancies far away from the basal planes.
5. In polycrystalline material, D
poly
≈ D
ab
.
Ch_10.qxd 11/12/04 4:32 PM Page 511