Gregersen E. (editor) The Britannica Guide to Statistics and Probability
Подождите немного. Документ загружается.


7 The Britannica Guide to Statistics and Probability 7
310
a two-parameter exponential function in 1809 in connec-
tion with studies of astronomical observation errors. This
study led Gauss to formulate his law of observational error
and to advance the theory of the method of least squares
approximation. Another famous early application of the
normal distribution was by the British physicist James
Clerk Maxwell, who in 1859 formulated his law of distribu-
tion of molecular velocities—later generalized as the
Maxwell-Boltzmann distribution law.
The French mathematician Abraham de Moivre, in his
Doctrine of Chances (1718), first noted that probabilities
associated with discretely generated random variables
(such as are obtained by flipping a coin or rolling a die) can
be approximated by the area under the graph of an expo-
nential function. This result was extended and generalized
by the French scientist Pierre-Simon Laplace, in his
Théorie analytique des probabilités (1812; “Analytic Theory of
Probability”), into the first central limit theorem, which
proved that probabilities for almost all independent and
identically distributed random variables converge rapidly
(with sample size) to the area under an exponential
function—that is, to a normal distribution. The central
limit theorem permitted hitherto intractable problems,
particularly those involving discrete variables, to be han-
dled with calculus.
peRMuTaTions and
coMbinaTions
The various ways in which objects from a set may be
selected, generally without replacement, to form subsets
are called permutations and combinations. This selec-
tion of subsets is called a permutation when the order of
selection is a factor, a combination when order is not a
311
7
Special Topics 7
factor. By considering the ratio of the number of desired
subsets to the number of all possible subsets for many
games of chance in the 17th century, the French mathe-
maticians Blaise Pascal and Pierre de Fermat gave
impetus to the development of combinatorics and prob-
ability theory.
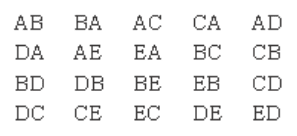
The concepts of and differences between permuta-
tions and combinations can be illustrated by examination
of all the different ways in which a pair of objects can be
selected from fi ve distinguishable objects—such as the
letters A, B, C, D, and E. If both the letters selected and
the order of selection are considered, then the following
20 outcomes are possible:
Each of these 20 different possible selections is called
a permutation. In particular, they are called the permuta-
tions of fi ve objects taken two at a time, and the number
of such permutations possible is denoted by the symbol
5
P
2
, read “5 permute 2.” In general, if there are n objects
available from which to select, and permutations ( P ) are to
be formed using k of the objects at a time, the number of
different permutations possible is denoted by the symbol
n
P
k
. A formula for its evaluation is
n
P
k
= n !/( n − k )!
The expression n ! (read “ n factorial”) indicates that all
the consecutive positive integers from 1 up to and includ-
ing n are to be multiplied together, and 0! is defi ned to
7 The Britannica Guide to Statistics and Probability 7
312
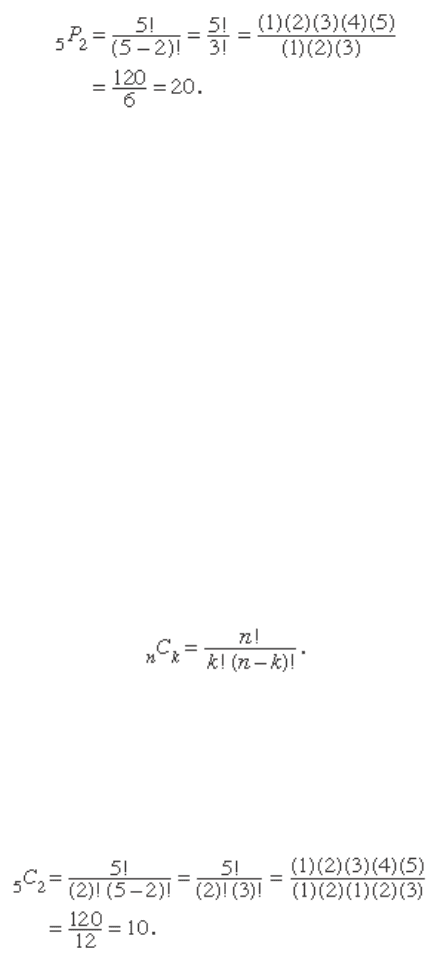
equal 1. For example, using this formula, the number of
permutations of fi ve objects taken two at a time is
(For k = n ,
n
P
k
= n ! Thus, for 5 objects there are 5! = 120
arrangements.)
For combinations, k objects are selected from a set of
n objects to produce subsets without ordering. Contrasting
the previous permutation example with the correspond-
ing combination, the AB and BA subsets are no longer
distinct selections. By eliminating such cases, there remain
only 10 different possible subsets: AB, AC, AD, AE, BC,
BD, BE, CD, CE, and DE.
The number of such subsets is denoted by
n
C
k
, read “ n
choose k .” For combinations, because k objects have k !
arrangements, there are k ! indistinguishable permutations
for each choice of k objects. Hence, dividing the permuta-
tion formula by k ! yields the following combination
formula:
This is the same as the ( n , k ) binomial coeffi cient ( see
binomial theorem). For example, the number of combina-
tions of fi ve objects taken two at a time is

313
7
Special Topics 7
The formulas for
n
P
k
and
n
C
k
are called counting formu-
las, because they can be used to count the number of
possible permutations or combinations in a given situa-
tion without having to list them all.
poinT esTiMaTion
Point estimation is the process of finding an approximate
value of some parameter, such as the mean (average), of
a population from random samples of the population.
The precise accuracy of any particular approximation is
unknown pre, but probabilistic statements concerning
the accuracy of such numbers as found over many experi-
ments can be constructed.
It is desirable for a point estimate to be: (1) Consistent.
The larger the sample size, the more accurate the esti-
mate. (2) Unbiased. The expectation of the observed
values of many samples (“average observation value”)
equals the corresponding population parameter. For
example, the sample mean is an unbiased estimator for the
population mean. (3) Most efficient or best unbiased—of
all consistent, unbiased estimates, the one possessing the
smallest variance (a measure of the amount of dispersion
away from the estimate). In other words, the estimator
that varies least from sample to sample. This generally
depends on the particular distribution of the population.
For example, the mean is more efficient than the median
(middle value) for the normal distribution but not for
more “skewed” (asymmetrical) distributions.
Several methods are used to calculate the estima-
tor. The most often used, the maximum likelihood
method, uses differential calculus to determine the maxi-
mum of the probability function of a number of sample
parameters. The moments method equates values of
sample moments (functions describing the parameter) to

7 The Britannica Guide to Statistics and Probability 7
314
population moments. The solution of the equation gives
the desired estimate. The Bayesian method, named for
the 18th-century English theologian and mathematician
Thomas Bayes, differs from the traditional methods by
introducing a frequency function for the parameter being
estimated. Although with the Bayesian method sufficient
information on the distribution of the parameter is usu-
ally unavailable, the estimation can be easily adjusted as
additional information becomes available.
poisson disTRibuTion
The Poisson distribution helps characterize events with
low probabilities of occurrence within some definite time
or space. French mathematician Siméon-Denis Poisson
developed his function in 1830 to describe the number of
times a gambler would win a rarely won game of chance in
a large number of tries. Letting p represent the probability
of a win on any given try, the mean, or average, number of
wins (λ) in n tries will be given by λ = np. Using the Swiss
mathematician Jakob Bernoulli’s binomial distribution,
Poisson showed that the probability of obtaining k wins is
approximately λ
k
/e
λ
k!, where e is the exponential function
and k! = (k − 1)(k − 2)⋯2·1. Noteworthy is the fact that λ
equals both the mean and variance (a measure of the dis-
persal of data away from the mean) for the Poisson
distribution.
The Poisson distribution is now recognized as a vitally
important distribution in its own right. For example, in
1946 the British statistician R.D. Clarke published “An
Application of the Poisson Distribution,” in which he
disclosed his analysis of the distribution of hits of flying
bombs (V-1 and V-2 missiles) in London during World
War II. Some areas were hit more often than others. The

315
7
Special Topics 7
British military wished to know if the Germans were tar-
geting these districts (the hits indicating great technical
precision) or if the distribution was by chance. If the mis-
siles were in fact only randomly targeted (within a more
general area), the British could simply disperse important
installations to decrease the likelihood of their being hit.
Clarke began by dividing an area into thousands of
tiny, equally sized plots. Within each of these, it was
unlikely that there would be even one hit, let alone more.
Furthermore, under the assumption that the missiles fell
randomly, the chance of a hit in any one plot would be a
constant across all the plots. Therefore, the total number
of hits would be much like the number of wins in a large
number of repetitions of a game of chance with a very
small probability of winning. This sort of reasoning led
Clarke to a formal derivation of the Poisson distribution
as a model. The observed hit frequencies were close to the
predicted Poisson frequencies. Hence, Clarke reported
that the observed variations appeared to have been gener-
ated solely by chance.
queuing TheoRy
Queuing theory is a subject in operations research
that deals with the problem of providing adequate but
economical service facilities involving unpredictable
numbers and times or similar sequences. In queuing
theory the term customers is used, whether referring to
people or things, in correlating such variables as how
customers arrive, how service meets their requirements,
average service time and extent of variations, and idle
time. When such variables are identified for both cus-
tomers and facilities, choices can be made on the basis of
economic advantage.

7 The Britannica Guide to Statistics and Probability 7
316
Queuing theory is a product of mathematical
research that grew largely out of the need to determine
the optimum amount of telephone switching equip-
ment required to serve a given area and population.
Installation of more than the optimum requires exces-
sive capital investment, while less than optimum means
excessive delays in service.
RandoM walk
A random walk is a process for determining the prob-
able location of a point subject to random motions,
given the probabilities (the same at each step) of moving
some distance in some direction. Random walks are an
example of Markov processes, in which future behaviour
is independent of past history. A typical example is the
drunkard’s walk, in which a point beginning at the origin
of the Euclidean plane moves a distance of one unit for
each unit of time, the direction of motion, however, being
random at each step. The problem is to find, after some
fixed time, the probability distribution function of the
distance of the point from the origin. Many economists
believe that stock market fluctuations, at least over the
short run, are random walks.
saMpling
In statistics, a process or method of drawing a representa-
tive group of individuals or cases from a particular
population is called sampling. Sampling and statistical
inference are used in circumstances in which it is imprac-
tical to obtain information from every member of the
population, as in biological or chemical analysis, industrial
quality control, or social surveys. The basic sampling
design is simple random sampling, based on probability

317
theory. In this form of random sampling, every element of
the population being sampled has an equal probability of
being selected. In a random sample of a class of 50 stu-
dents, for example, each student has the same probability,
1/50, of being selected. Every combination of elements
drawn from the population also has an equal probability of
being selected. Sampling based on probability theory
allows the investigator to determine the likelihood that
statistical findings are the result of chance. More com-
monly used methods, refinements of this basic idea, are
stratified sampling (in which the population is divided
into classes and simple random samples are drawn from
each class), cluster sampling (in which the unit of the
sample is a group, such as a household), and systematic
sampling (samples taken by any system other than random
choice, such as every 10th name on a list).
Sampling is known as process or method of drawing a representative group of
individuals or cases from a particular population, such as a jar of jellybeans.
Shutterstock.com
7 Special Topics 7

7 The Britannica Guide to Statistics and Probability 7
318
An alternative to probability sampling is judgment
sampling, in which selection is based on the judgment of
the researcher and there is an unknown probability of
inclusion in the sample for any given case. Probability
methods are usually preferred because they avoid selec-
tion bias and make it possible to estimate sampling error
(the difference between the measure obtained from the
sample and that of the whole population from which the
sample was drawn).
sTandaRd deviaTion
In statistics, the standard deviation is a measure of the
variability (dispersion or spread) of any set of numerical
values about their arithmetic mean (average; denoted by
μ). It is specifically defined as the positive square root of
the variance (σ
2
). In symbols, σ
2
= Σ(x
i
− μ)
2
/n, where Σ is a
compact notation used to indicate that as the index (i)
changes from 1 to n (the number of elements in the data
set), the square of the difference between each element x
i
and the mean, divided by n, is calculated and these values
are added together. The variance is used procedurally to
analyze the factors that may influence the distribution or
spread of the data under consideration.
sTochasTic pRocess
A stochastic process involves the operation of chance. For
example, in radioactive decay every atom is subject to a
fixed probability of breaking down in any given time inter-
val. More generally, a stochastic process refers to a family
of random variables indexed against some other variable
or set of variables. It is one of the most general objects of
study in probability. Some basic types of stochastic pro-
cesses include Markov processes, Poisson processes (such

319
7
Special Topics 7
as radioactive decay), and time series, with the index vari-
able referring to time. This indexing can be either discrete
or continuous, the interest being in the nature of changes
of the variables with respect to time.
sTudenT’s T-TesT
Student’s t-test is a method of testing hypotheses about
the mean of a small sample drawn from a normally distrib-
uted population when the population standard deviation
is unknown. In 1908 William Sealy Gosset, an Englishman
publishing under the pseudonym Student, developed the
t-test and t distribution. The t distribution is a family of
curves in which the number of degrees of freedom (the
number of independent observations in the sample minus
one) specifies a particular curve. As the sample size (and
thus the degrees of freedom) increases, the t distribution
approaches the bell shape of the standard normal distribu-
tion. In practice, for tests involving the mean of a sample
of size greater than 30, the normal distribution is usually
applied.
First, a null hypothesis is usually formulated, which
states that there is no effective difference between the
observed sample mean and the hypothesized or stated
population mean (i.e., that any measured difference is only
caused by chance). In an agricultural study, for example,
the null hypothesis could be that an application of fertil-
izer has had no effect on crop yield, and an experiment
would be performed to test whether it has increased the
harvest. In general, a t-test may be either two-sided (also
termed two-tailed), stating simply that the means are not
equivalent, or one-sided, specifying whether the observed
mean is larger or smaller than the hypothesized mean. The
test statistic t is then calculated. If the observed t-statistic
is more extreme than the critical value determined by the