Grace Robert. Advanced Blowout and Well Control
Подождите немного. Документ загружается.

256
reasons, the effective hydrostatic cannot
be
less
than
the reservoir
pressure. At the lower surface pressures, the
gas
hydrostatic gradlent is
less and the
final
surface pressure must be higher
to
reflect the difference
in gas gradient and prevent additional influx.
The analysis is continued
until the well
is
dead. Rudimentary analysis suggests higher mud weights
for well control.
Advanced
Blowout
and
Well
Control
DYNAMIC
KILL
OPERATIONS
Simply put, to kill
a
well dynamically is
to
use frictional pressure
losses to control the flowing bottomhole pressure and, ultimately, the
static bottomhole pressure of the blowout.
Dynam~c Kill implies the use of a kill fluid whose density results
in a hydrostatic column which is less
than
the static reservoir pressure.
Therefore, the frictional pressure loss of the kill fluid is required to stop
the flow of reservoir fluids. Dynamic Kill in the purest sense
was
intended
as
an intermediate step in the well control procedure.
Procedurally, after the blowout
was
dynamically controlled with
a
fluid of
lesser density, it was ultimately controlled with a fluid of greater density,
which resulted
in
a hydrostatic greater
than
the reservoir pressure.
Generically and in
this
text, Dynamic Kill includes control procedures
utilizing
fluids
with densities less
than
and much greater than
that
required
to balance the static reservoir pressure.
In
reality, when the density of the
kill fluid is equal
to
or greater
than
that required
to
balance the static
reservoir pressure, the fluid dynamics are more properly described
as
a
Multiphase Kill Procedure.
Dynamically controlling
a
well using
a
Multiphase Kill Procedure
is one of the oldest and most widely used fluid control operations.
In
the
past,
it
has
been
a
“seataf-the-pants” operation with little or no technical
evaluation. Most of the time, well control specialists had some arbitrary
rules of thumb, e.g. the kill fluid
had
to be
2
pounds per gallon heavier
than
the mud used to drill the zone or the kill fluid had to achieve some
particular annular velocity. Usually,
that
all translated into manifolding
together all the pumps
in
captivity, weighting the mud up
as
high
as
possible, pumping like hell and hoping for the best. Sometimes it worked
and sometimes it didn’t.
Fluid
Dynamics
in
Well
Control
257
r
Figwe
5.4
-
Dynamic
Kill
Schematic
9
t
258
of the
kill
fluid along with the increased fiction pressure resulting from
the kill fluid controls the well.
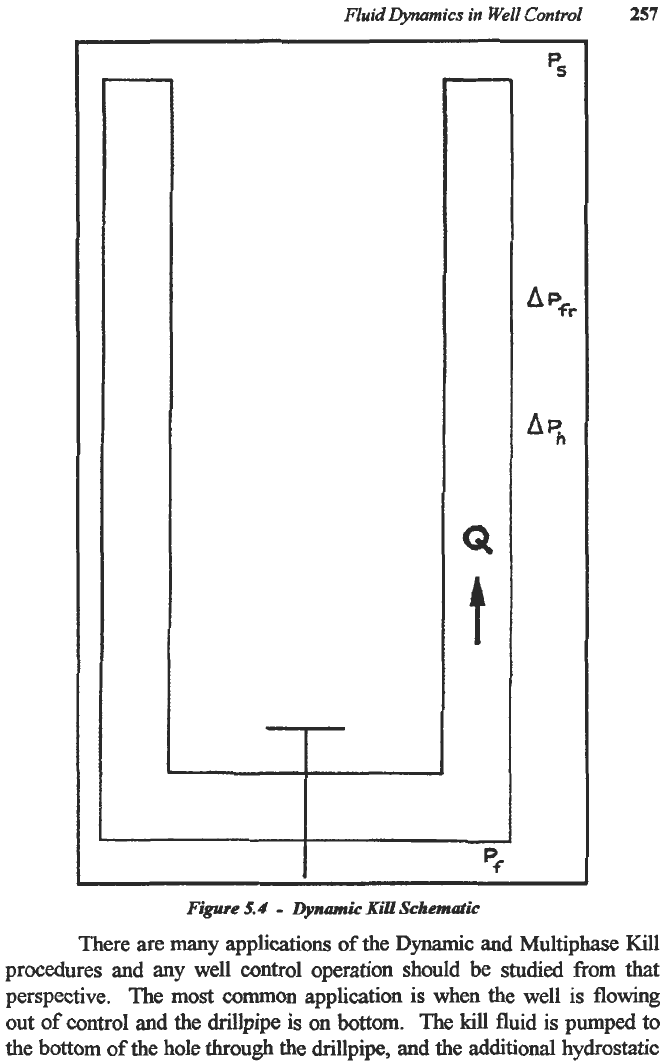
Multiphase Kill operations were routine
in the Arkoma Basin
in
the early 1960s.
In air drilling
operations, every productive well is a blowout. Under different
circumstances, some of them would have made the front page of the
New
York
Times.
At one location just
east
of McCurtain,
Oklahoma,
the fire
was coming out of an 8-inch blooie line and was
almost
as
high
as
the
crown of the 141-foot derrick. The blooie line was
300
feet long, and you
could
toast
marshmallows on the rig floor. The usual procedure
was
the
seat-of-the-pants Multiphase Kill and it killed the well.
The most definitive work on the pure Dynamic Kill was done by
Mobil
Oil
Corporation and reported by
Elmo
Blount and Edy Soeiinah.2
The biggest
gas
field in the world is Mobil’s
Arun
Field in
North
Sumatra, Indonesia.
On 4 June, 1978, Well
No.
C-11-2 blew out while
drilling and caught fire. The
rig
was immediately consumed. The well
burned for 89 days at an approximate rate of 400 million standard cubic
feet per day.
Due to the well’s high deliverability and potential, it was
expected to be extremely difficult
to
kill. The engineering was
so
precise
that only one relief well
was
required. That
a
blowout of
this
magnitude
was
completely dead one hour and
50
minutes after pumping operations
commend is
a
tribute
to
all
involved. One of the most significant
contributions resulting from
this
job
was the insight into the fluid
dynamics of
a
Dynamic Kill.
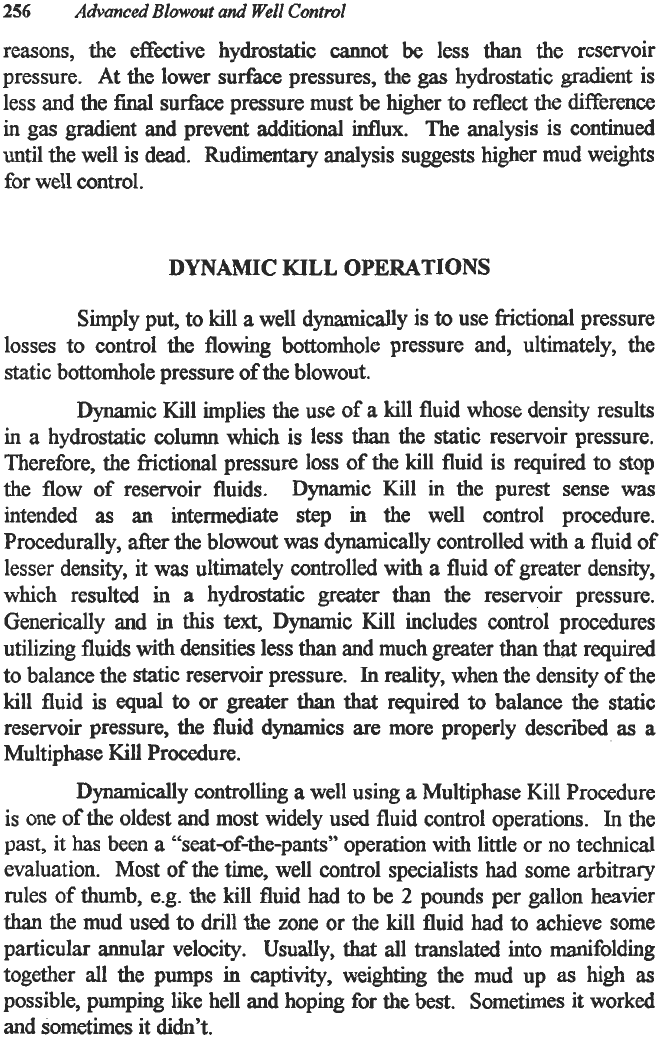
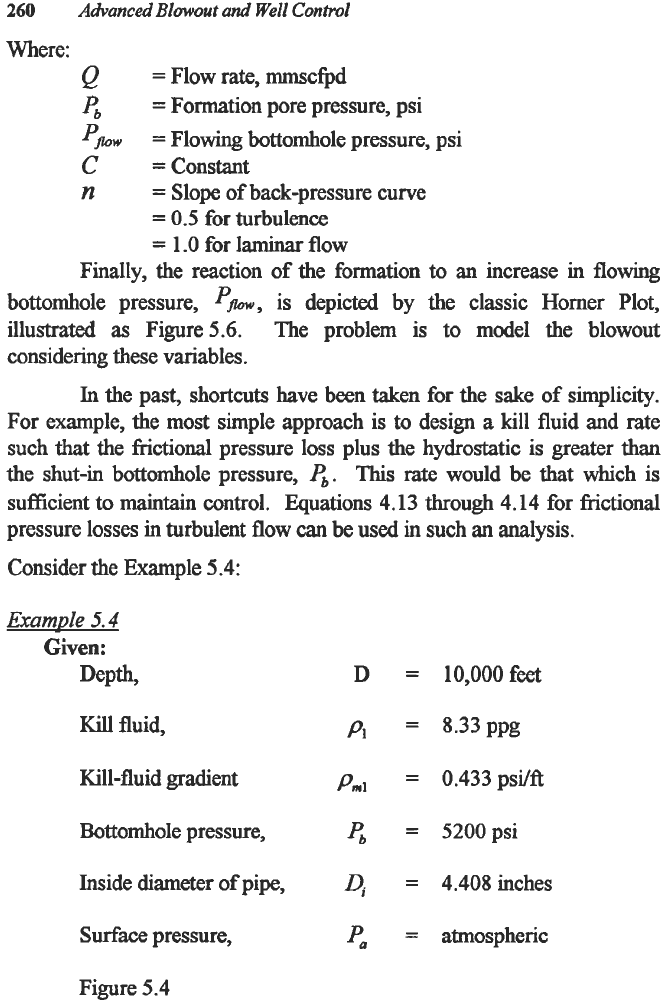
The
engineering
concepts of a Dynamic Kill
are
best understood
by considering the
familiar U-tube
of
Figure
5.4.
The left side of the U-
tube may represent
a
relief well and the right side
a
blowout,
as
was the
case just discussed, or the left side
may
represent drillpipe while the right
side would correspond
to
the annulus,
as
is the case in many well control
situations. The connecting interval may be the formation in the case of a
relief well with the valve representing the resistance due
to
the flow of
fluids through the formation.
In
the case of the drillpipe
-
annulus
scenario,
the valve may represent the
friction
in the drill string or the
nozzles in the bit, or the situation
may
be completely different. Whatever
the
situation,
the technical
concepts
are basically the same.
Advanced
Blowout
and
Well
Cmtrol
There, air drilling was popular.
Fluid
DyMnrics
in
Well
Control
259
Figure
5.5
-
TVpial Open
Flow
Potential
Curve
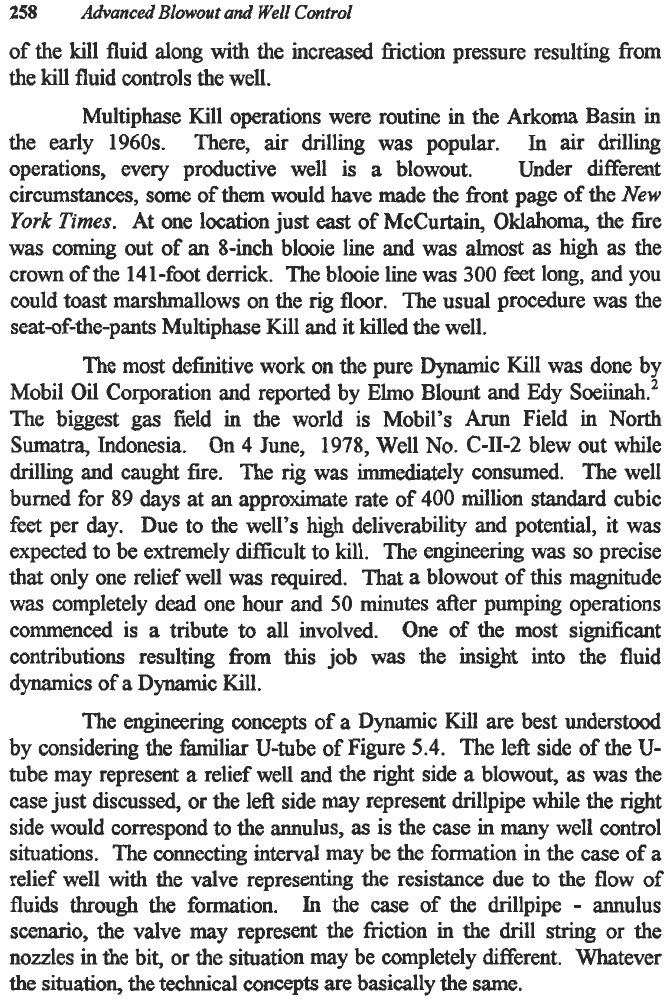
The formation
is
represented
as
flowing
up
the
right side
of
the
U-
tube with
a
flowing
bottomhole pressure,
paw,
which
is
given by the
following equation:
(5.11)
Where:
pa
=
Sufice pressure, psi
pp
=
~rictiod
pressure, psi
APh
=
Hydrostatic pressure, psi
The capability
of
the
formation
to
deliver hydrocarbons to the
wellbore is governed by the familiar back-pressure curve illustrated
in
Figure
5.5
and
described by the Equation
5.12:
Q
=
C(
pb2
-
Pflo,2)n
(5.12)
260
Where:
Advanced
Blowout
and
Well
Control
Q
=
Flow rate, mmscfpd
e
pfi~
C
=Constant
n
=
Formation pore pressure, psi
=
Flowing bottomhole pressure, psi
=
Slope of back-pressure curve
=
0.5
for turbulence
=
1.0 for laminar flow
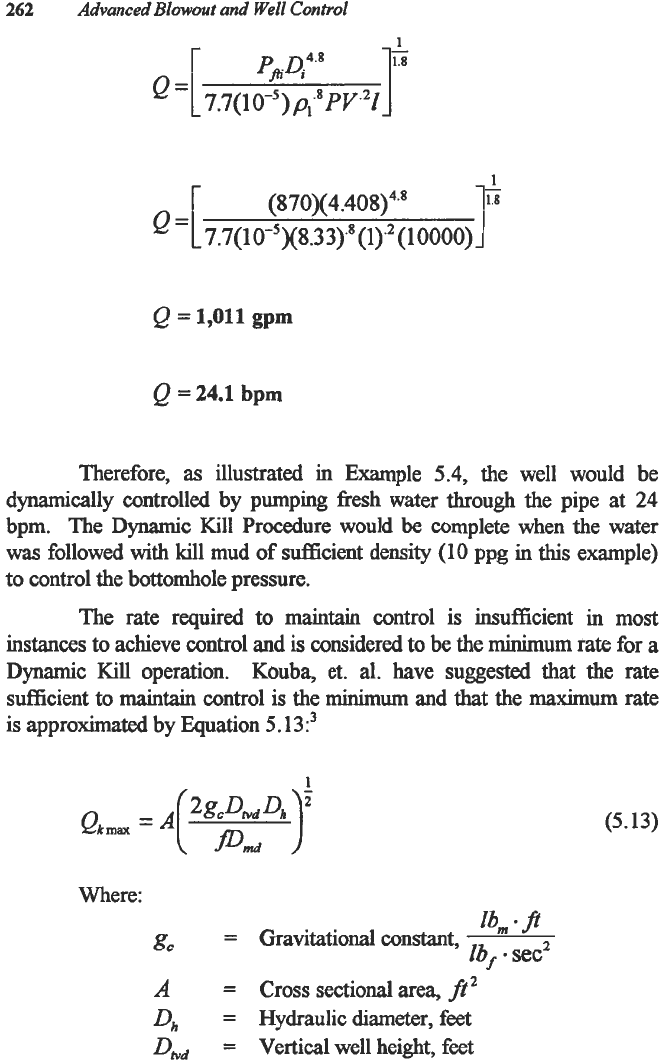
Finally, the reaction of the formation
to
an increase in flowing
bottomhole pressure,
p~,
is depicted by the classic Homer Plot,
illustrated
as
Figure
5.6.
The problem is to model the blowout
considering these variables.
In
the past, shortcuts have been taken for the sake of simplicity.
For example, the
most
simple approach is
to
design
a
kill fluid and rate
such
that
the
frictional
pressure loss plus the hydrostatic is greater than
the shut-in bottomhole pressure,
e.
This
rate
would be
that
which is
sufficient
to
maintain
control. Equations 4.13
through
4.14 for
frictional
pressure losses in turbulent flow
can
be
used
in
such
an
analysis.
Consider the Example 5.4:
Example
5.4
Given:
Depth,
D
Kill
fluid,
h
Kill-fluid gradient
Pm1
Bottomhole pressure,
4
Inside diameter of pipe,
0,
Surface
pressure,
P,
Figure 5.4
=
10,000
feet
=
8.33ppg
=
0.433psUft
=
5200psi
=
4.408 inches
=
atmospheric
FluidL?ynamics
in
Well
Control
261
Figure
5.6
-
Typical
Pressure
Build
Up
Curve
Required:
Determine the
rate
required
to
kill the well
dynamically
with
water.
Solution:
APfi
=
870
psi
Rearranging Equation
4.14
where
Dfi
=
Pp.
:
262
Advanced
Blowout
and
Well
Control
1
r
(870)(
4.40f1)~.'
1l.s
=L
7.7(1
0-5)(8.33).8
(1).2
(1
0000)
1
Q
=
1,011
gpm
Q
=
24.1
bpm
Therefore,
as
illustrated
in
Example
5.4,
the well would be
dynamically controlled by pumping fresh water through the pipe at
24
bpm. The Dynamic Kill Procedure would
be
complete when the water
was
followed with kill mud of sufficient density
(10
ppg
in
this
example)
to control the bottomhole pressure.
The rate required to
maintain
control is insufficient
in
most
instances
to achieve control and is considered to be the minimum rate for a
Dynamic
Kill
operation. Kouba,
et.
al. have suggested
that
the rate
sufficient to
maintain
control
is
the
minimum
and
that
the maximum rate
is
approximated by Equation
5.
13:3
Where:
lbm
*
P
Zb/
-
sec2
=
Gravitational constant,
gc
(5.13)
A
=
Cross sectional area,
ft2
D,,
=
Hydraulic diameter, feet
DMd
=
Vertical well height, feet
Fluid
Dynamics
in
Well
Control
263
Dmd
=
Measured well length,
feet
f
=
Moody friction factor, dimensionless
Consider
Example
5.5:
Example
5.5
Given:
Same
conditions
as
Example
5.4
Required:
Calculate the
maximum
kill
rate using Equation
5.13.
Solution:
Solving
Equation
5.13
gives
Qk,
=
0.106 (2(32.2)(10000)(.3673)
.
0
19(
10000)
fr’
Q,,
=
3.74
-
sec
As
illustrated
in
Examples
5.4
and
5.5,
the
minimum
kill
rate
is
24
bpm and
the
maximum
kill
rate
is
40
bpm.
The rate
required to
kill
the
well is somewhere
between
these
values and is
very
difficult
to
determine.
Multiphase flow analysis is required.
The methods
of
multiphase
flow
264
analysis are very complex and based upon empirical correlations obtained
from laboratory research.
The
available correlations and research are
based upon gas-lift models describing the flow of gas, oil and water inside
small pipes. Precious little research
has
been
intended
to
describe annular
flow much less the multiphase relationship between
gas,
oil, drilling mud
and water flowing up
a
very large, inclined annulus. The conditions and
boundaries describing most blowouts are very complex
to
be described by
currently available multiphase models. It is beyond the scope of
this
work
to offer an indepth discussion of multiphase models.
Further complicating the problem is the fact that, in most
instances, the productive interval does not react instantaneously
as
would
be implied by the strict interpretation of Figure
5.5.
Actual reservoir
response is illustrated by the classical Horner Plot illustrated in Figure
5.6.
As
illustrated in Figure 5.6, the response by the reservoir to the
introduction of
a
kill
fluid
is
non-linear. For example, the multiphase
fiictional pressure loss (represented by Figure5.6) initially required to
control the well is not that which will control the static reservoir pressure.
The multiphase frictional pressure loss required to control the well is
that
which will control the flowing bottomhole pressure. The flowing
bottomhole pressure
may
be
much less
than
the static bottomhole
pressure. Further, several minutes
to
several hours may be required for
the reservoir to stabilize
at
the reservoir pressure. Unfortunately, much of
the
data
needed to understand completely the productive capabilities of the
reservoir in a particular wellbore are not available until after the blowout
is controlled. However,
data
from
similar offset wells
can
be
considered.
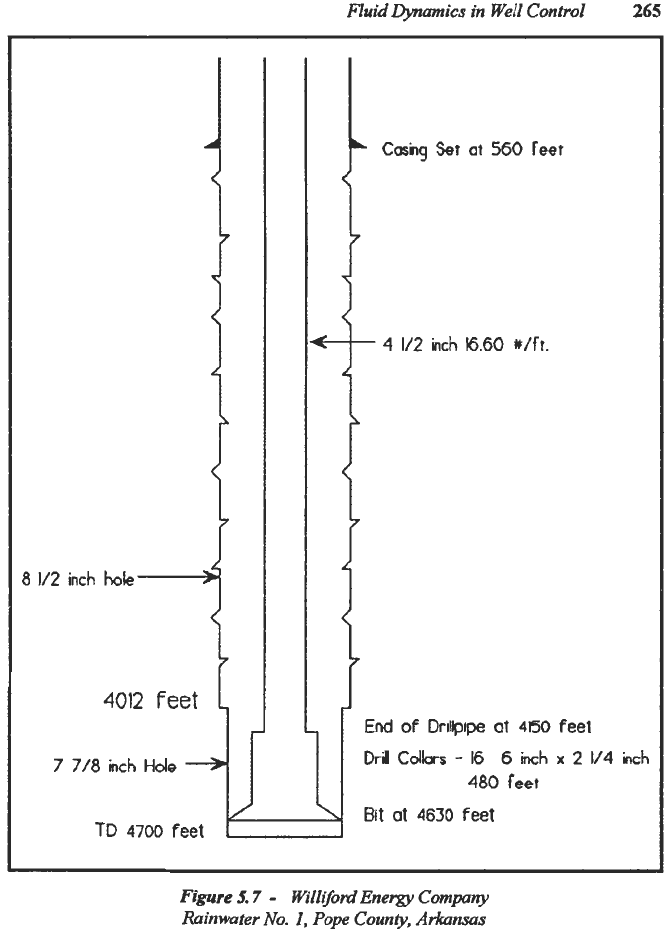
Consider the well control operation at the Williford Energy
Company Rainwater
No.
2-14 in Pope County near Russellville,
Arkansas4 The wellbore schematic is presented
as
Figure
5.7.
A
high-
volume gas zone
had
been
penetrated at 4,620 feet. On the trip out
of
the
hole, the well kicked. Mechanical problems prevented the well from being
shut in and it was soon flowing in excess of 20 mmscfpd through the
rotary table. The drillpipe was stripped
to
bottom and the well was
diverted through the choke manifold. By pitot
tube,
the well was
determined
to
be
flowing at a
rate
of 34.9 mmscfpd with a manifold
pressure of 150 psig. The wellbore schematic, Open Flow Potential Test
and Homer Plot are presented
as
Figures
5.7,
5.8
and
5.9,
respectively.
Advanced
Blowout
and
Well
Control
Fluid
l?ynamics
in Well
Control
265
ai
560
feet
16.60
Wfr.
8
1/2
inch
7 7/8
End
of
Drillpipe
at
460
feel
Dril
Cdkrr
-
16
6
inch
x
2
1/4
inch
480
feet
-y
Bit
at
4630
feet
Figure
5.7
-
Willford
Energy
Company
Rainwnter No.
I,
Pope
County,
Arkansas