Franc J-P. Fundamentals of Cavitation
Подождите немного. Документ загружается.

6 - SUPERCAVITATION 113
For small values of s, a and g, the main results are the following:
C
C
L
D
@+ +
Ê
Ë
Á
ˆ
¯
˜
++
Ê
Ë
Á
ˆ
¯
˜
+
È
Î
Í
Í
˘
˚
˙
˙
@+ +
Ê
Ë
Á
ˆ
¯
˜
++
Ê
Ë
Á
ˆ
¯
˜
+
È
Î
Í
Í
˘
˚
˙
˙
Ï
Ì
Ô
Ô
Ó
Ô
Ô
-
p
sa
g
s
a
g
p
sa
g
s
a
g
2
1
7
8
3
16 4
2
1
4
3
16
7
4
2
1
2
2
[ ] ...
[ ] ...
(6.31)
l
c
C
e
c
C
D
D
@+ =+ +
Ê
Ë
Á
ˆ
¯
˜
@
Ï
Ì
Ô
Ô
Ó
Ô
Ô
1
80
1
4
4
40
22
2
()
()
ps s
a
g
ps
(6.32)
6.3.4. VARIATION OF LIFT AND DRAG COEFFICIENTS
WITH CAVITY UNDERPRESSURE
In the various cases considered above, corresponding to supercavity flows in
an infinite medium, the drag and lift coefficients appear to obey the following
asymptotic law, for small s-values:
CC
CC
DD
LL
() ()[ ]
() ()[ ]
ss
ss
@+
@+
Ï
Ì
Ó
01
01
(6.33)
This means that, starting from an infinite cavity, if the cavity underpressure s is
increased, resulting in a finite although long cavity, the relative velocity distribution
around the body is unchanged. To first order of approximation in s, the velocity on
the body and the cavity is simply multiplied by
1 +s
, so that the drag and lift
coefficients are multiplied by
1 +s
. In particular, the position of the stagnation
point is unchanged.
If the flow is limited by solid or free external boundaries, this result no longer
holds since the position of the stagnation point changes together with the velocity
distribution. Then, a change in s-value strongly modifies the variations of the global
force coefficients with the cavity underpressure.
The effect of solid walls on the force coefficients is an essential topic in the literature
due to its importance in testing
facilities. It was studied by B
IRKHOFF et al. (1950, 1952),
F
ABULA (1964), WU et al. (1971), and numerically calculated by BRENNEN (1969) in the
case of a disk and a sphere. An empirical method of correction was proposed by
M
EIJER (1967).
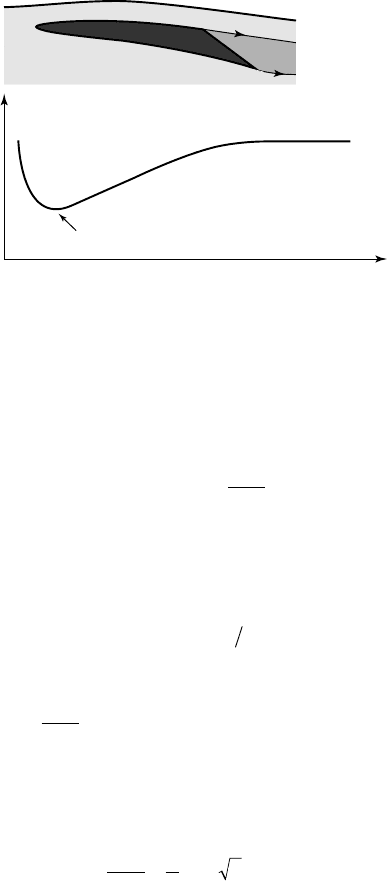
In the case of a supercavitating foil with wetted upper side and truncated base held
under a free surface, the evolution of the lift-curve with the cavity underpressure is
schematically given in figure 6.18. It starts with a negative slope for small s-values,
FUNDAMENTALS OF CAVITATION114
which is very different from the classical law discussed above [ROWE et al. 1975]. A
close examination of the leading edge region showed that this is actually due to the
displacement of the stagnation point which is correlated to a change in circulation
around the body. Let us note that, in the present case of a truncated hydrofoil, the
two detachment conditions are equivalent to the classical J
OUKOWSKI condition in
non-cavitating flow, which determines the circulation around the foil and its lift.
C
L
Non-cavitating
l
<1
c
h
or
d
l ≅
1 chord
6.18 - Typical evolution, with the cavitation number, of the lift coefficient
of a supercavitating foil in a free surface channel
6.3.5. EFFECT OF SUBMERSION DEPTH ON THE SLOPE OF THE CURVE C
L
(
␣))
))
Within the framework of the linearized theory and for infinite cavities (
s=0
),
M
ICHEL and ROWE (1974) computed the slope
∂
∂
C
L
a
of the lift coefficient C
L
versus
the angle of attack a. The calculation was made for hydrofoils with a truncated
base (as shown on figure 6.18) under a free surface and for different submersion
depths. The chord length of the lower side is taken as unity whereas the chord
length e of the upper side is variable from 0 to 1.
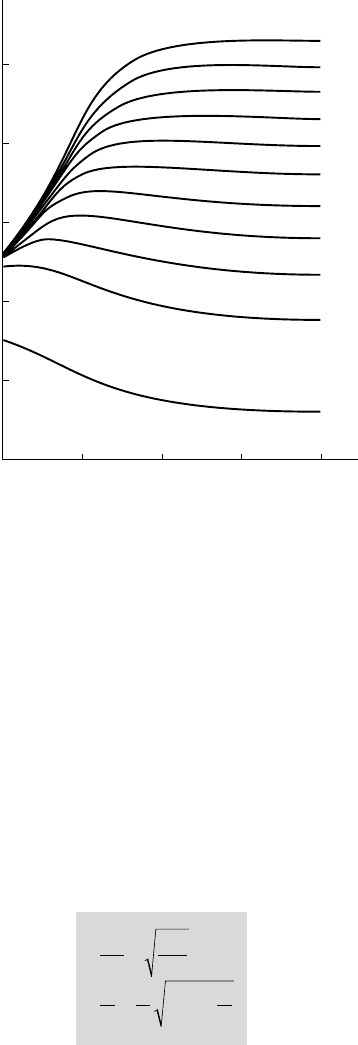
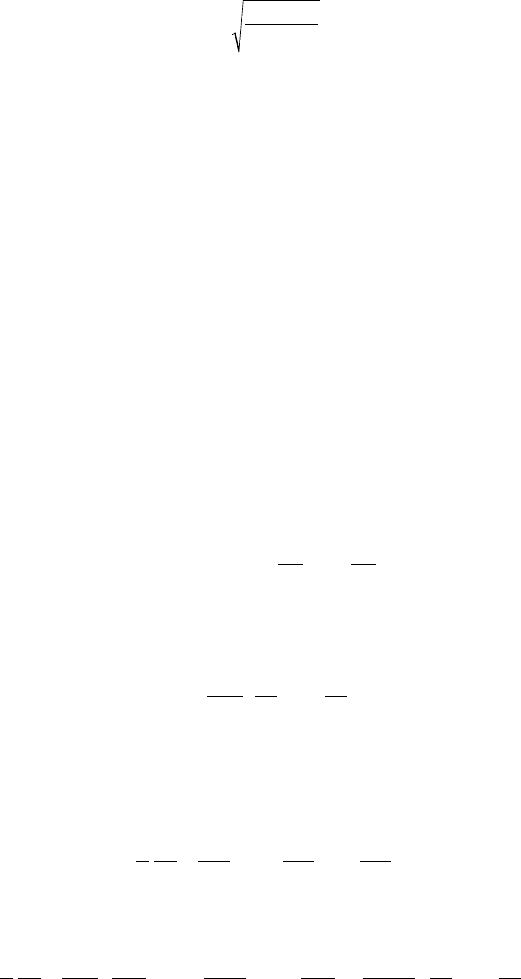
Figure 6.19 shows the evolution of the slope
∂∂aC
L
versus the submersion depth h,
for different values of the upper side chord length e. The theoretical results agree
fairly well with the experimental ones. For example, with
h =1
and
e = 1
, the
experimental value of
∂
∂
C
L
a
is 5.23, in good agreement with the theoretical
prediction 5.32.
For small values of the submersion depth, the slope tends to the limit value p. On
the other hand, for an infinite submersion depth, the asymptotic trend is given by:
∂
∂a
p
C
e
L
=+
()
2
1
2
(6.34)
from which the classical value 2p is found for
e = 1
.
6 - SUPERCAVITATION 115
1
10 10
2
10
–
1
10
3
1
2
3
4
5
6
e = 1
e = 0.9
e = 0.8
e = 0.7
e = 0.6
e = 0.5
e = 0.4
e = 0.3
e = 0.2
e = 0.1
e = 0
∂C
L
––––
∂α
h
6.19 - Evolution of the slope of the lift coefficient curve
with the submersion depth h for various lengths e of the upper side
(the chord length of the lower side is taken as unity)
6.4. AXISYMMETRIC CAVITIES
6.4.1.THE GARABEDIAN ASYMPTOTIC SOLUTION FOR STEADY SUPERCAVITIES
In most cases of axisymmetric supercavitation, the shape of the forebody (or
cavitator) can be approximated by a disc or a cone. In that case, if gravity is
neglected and for small enough values of the relative underpressure s of the cavity
(typically for
s<01.
), the shape of the cavity is close to an ellipsoid whose length l
and maximum diameter d
c
are expressed versus s by the following asymptotic
formulae [G
ARABEDIAN 1956]:
d
d
C
d
C
cD
D
=
=
Ï
Ì
Ô
Ô
Ó
Ô
Ô
s
ss
l 11
ln
(6.35)
FUNDAMENTALS OF CAVITATION116
in which d stands for the cavitator diameter. The drag coefficient C
D
defined by:
C
D
V
d
D
=
•
1
24
2
2
r
p
(6.36)
is connected to its value C
D
(0) for
s=0
by the classic relation (6.33):
CC
DD
() ( ) ()ssª+10
(6.37)
For a disc, we have
C
D
() .0082@
.
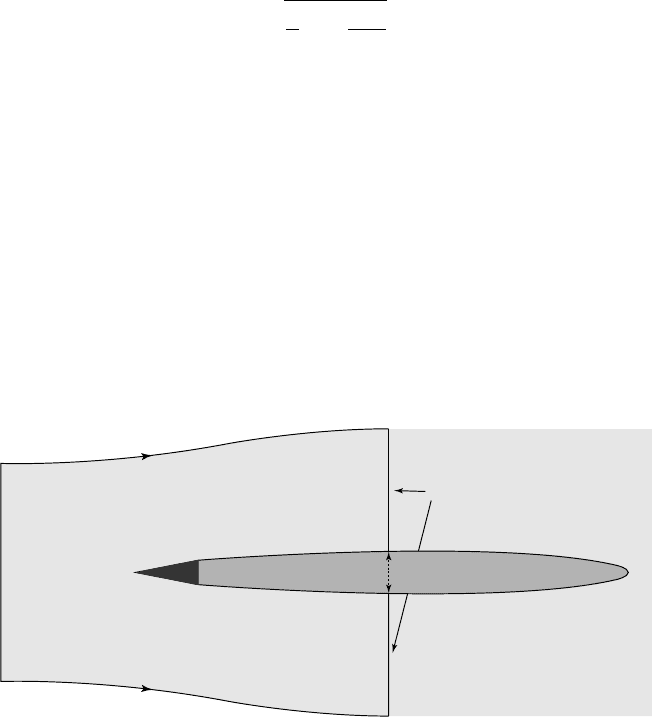
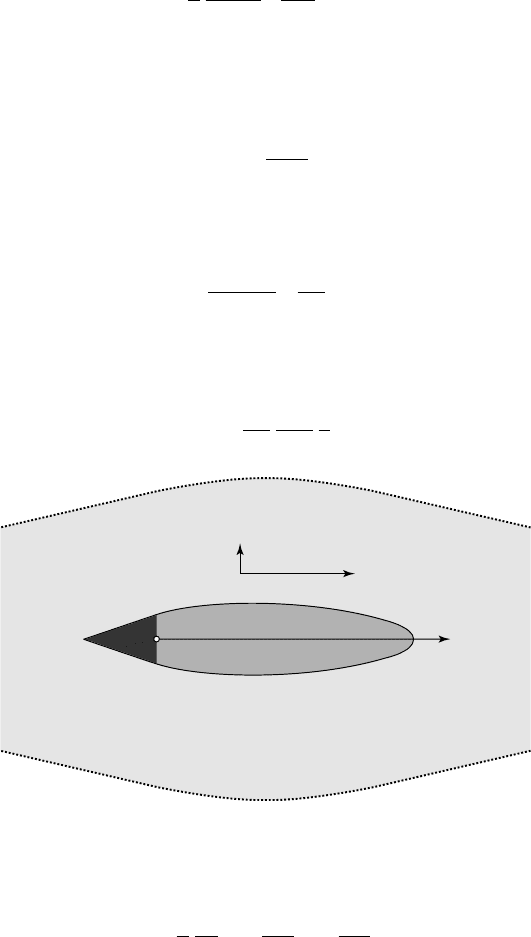
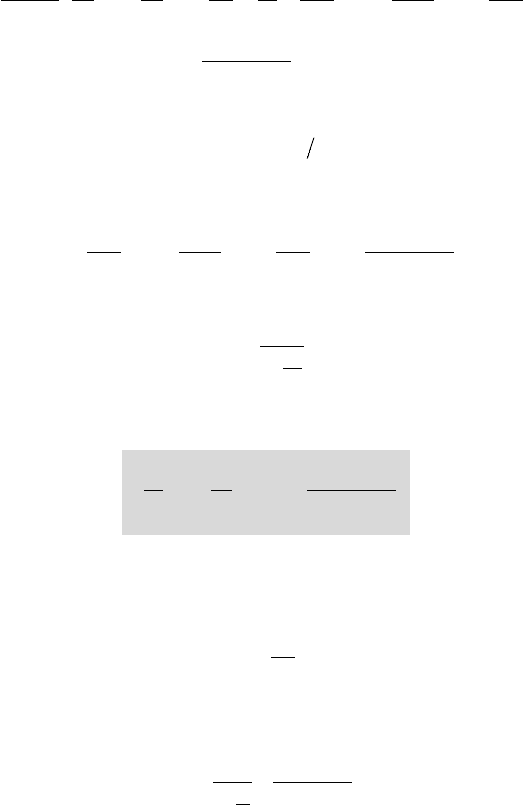
6.4.2. MOMENTUM BALANCE AND DRAG
The first equation of (6.35) can be obtained from the momentum balance of the liquid
contained in the domain shown in figure 6.20 limited by a surface S
u
at upstream
infinity, the surface S
•
made up of a tube of streamlines at infinity and the annular
surface S corresponding to an arbitrary cross-section along the cavity. This liquid
domain is closed by the cavitator and part of the cavity interface.
S
S
•
S
u
S
c
6.20
The momentum balance in this domain leads to the calculation of the drag D:
D p p S p p dS V S v dS
cc
S
ux
S
=- - - + -
•••
ÚÚ ÚÚ
()()rr
22
(6.38)
In this equation, S
c
is the cross-sectional area of the cavity and p and v
x
the pressure
and axial velocity respectively. By introducing the mass conservation equation
between cross-sections S
u
and S:
rrVS vdS
ux
S
•
=
ÚÚ
(6.39)
6 - SUPERCAVITATION 117
the momentum balance becomes:
D p p S p p dS v V v dS
cc
S
xx
S
=- - - + -
•••
ÚÚ ÚÚ
()() ()r
(6.40)
From the BERNOULLI equation, we can calculate the pressure:
pp V v v
xr
-= -
()
-
••
1
2
1
2
22 2
rr
(6.41)
where v
r
is the radial velocity. The momentum balance finally gives:
D p p S V v dS v dS
cc x
S
r
S
=- - -
ÚÚ
+
ÚÚ
••
() ()
1
2
1
2
2
2
rr
(6.42)
Now, if the cross-section S is chosen to be at the location of the maximum cavity
thickness, so that S
c
is the maximum cavity area, then, it follows that the radial
velocity v
r
is zero on the cavity and zero everywhere on S as will be seen later from
equation (6.47). Hence, the last integral vanishes. As for the first integral, it is usually
negligible with respect to the first term since the axial velocity v
x
is close to the
velocity at infinity V
•
. Hence, the drag can be estimated by the following formula:
Dp pS
cc
@-
•
()
(6.43)
By introducing the drag coefficient and the usual cavity underpressure s, this
equation appears to be strictly equivalent to the first equation of the G
ARABEDIAN
solution (6.35). The second one which gives the cavity length is not so easy to get. It
will be obtained in next section, on the basis of an approximate method.
Finally, let us note that, near the body, matching formulae are required to connect
the cavitator to the ellipsoid (see e.g. L
OGVINOVICH 1969, SEMENENKO 2001).
6.4.3. APPROXIMATE, ANALYTIC SOLUTION FOR STEADY SUPERCAVITIES
The GARABEDIAN solution was obtained on the basis of important mathematical
developments. An effort was made, especially in Russia and Ukraine, but also in
Japan and in US, to look for approximate but efficient methods of calculation of
axisymmetric cavities. When necessary, empirical coefficients are introduced to
meet the experimental results. Purely numerical methods of solution were also
used in the past (for example, B
RENNEN 1969). We present here the method derived
by S
EREBRYAKOV (1972), LOGVINOVICH and SEREBRYAKOV (1975), VASIN (2001) and
S
EMENENKO (2001).
FUNDAMENTALS OF CAVITATION118
Derivation of the solution
Assuming that the velocity field has only radial and axial components v
r
and v
x
respectively but no tangential component (fig. 6.21), the mass conservation equation,
in steady conditions, is:
1
0
r
rv
r
v
x
r
x
∂
∂
+
∂
∂
=
()
(6.44)
The calculation of the flow around a slender body consists in approximating the
axial component v
x
by the velocity at infinity V
•
, so that the second term in the
previous equation is neglected. Hence, the radial velocity behaves as 1/r:
v
Cx
r
r
@
()
(6.45)
The function C(x) is determined from the boundary condition on the cavity
interface
rRx= ()
where the radial velocity is:
vRx
V
dR
dx
r
(,)
•
=
(6.46)
This condition simply means that the velocity on the cavity is tangential to the
interface. Therefore, the radial velocity is given by:
v
V
dR
dx r
r
=
•
2
1
2
(6.47)
x
v
r
v
x
ψ (x)
O
6.21
The steady state EULER equation in the radial direction is written:
-
∂
∂
=
∂
∂
+
∂
∂
1
r
p
r
v
v
r
v
v
x
r
r
x
r
(6.48)
6 - SUPERCAVITATION 119
Using equation (6.47) for the radial velocity v
r
and again assuming that
vV
x
@
•
,
equation (6.48) becomes:
1
1
2
21
2
2
2
3
22
2
rV
p
r
R
dR
dx
r
dR
dx
r
•
∂
∂
=
Ê
Ë
ˆ
¯
-
(6.49)
This equation is integrated between the radius R of the cavity where the pressure
is equal to the cavity pressure p
c
and a radius Y (x) far from the cavity which
corresponds to an external hypothetical surface on which the pressure at infinity p
•
(x)
is applied. The introduction of this function Y(x) is necessary in an axisymmetric
flow because of the emergence of a logarithmic singularity (see eq. 6.50) which
prevents us letting Y tend to infinity. The integrated equation is:
dR
dx
dR
dx
R
pp
V
c
Ê
Ë
ˆ
¯
-=
-
•
•
2
22
2
2
1
2
ln
Y
r
(6.50)
In the first term on the left-hand side, Y was set equal to infinity, which does not
pose any mathematical difficulty.
The flow appears to be formed by the piling-up of liquid annular layers which
evolve with an internal radius R(x) and an external radius Y(x) under the pressure
difference
pp
c•
-
. The liquid particles which are outside the surface Y(x) have no
influence on the flow. The parameter:
m=ln
Y
R
(6.51)
characterizes the inertial properties of the liquid annular layer and plays the role of
an added mass.
For small values of the slenderness parameter measured by the ratio of the maximum
diameter of the cavity d
c
to its length l:
d=
d
c
l
(6.52)
the parameter m can be considered as constant and dependent only upon the cavity
slenderness d.
Returning to equation (6.50), the first term on the left-hand side is of the order d
2
. It
will be shown later (eq. 6.57) that Y is of the order of the cavity length, so that the
second term of equation (6.50) is of the order
dd
2
1ln ( / )
. Then, the first term can
be neglected and the equation simplifies to [S
EREBRYAKOV 1972]:
m
r
dR
dx
pp
V
c
22
2
2
1
2
0+
-
=
•
•
(6.53)
FUNDAMENTALS OF CAVITATION120
The second term of this equation is the cavity underpressure s. Assuming that the
cavity radius is zero at both ends of the cavity
x = 0
and
x = l
, the solution of this
differential equation, with m constant, is the ellipsoid given by:
R
x
2
2
2
2
24
2
4
1
s
m
l
l
l
+
-
Ê
Ë
ˆ
¯
=
(6.54)
The origin of the x coordinate is taken at the middle of the cavitator base (fig. 6.21).
The agreement with experimental results improves as s is made smaller.
The cavity slenderness is given by:
d
s
m
=
2
(6.55)
This parameter, which can easily be measured, is used for the determination of the
m-value and therefore of the external radius Y.
Asymptotic behavior
The m-parameter, which is assumed constant here for a given cavity, can be
estimated on the basis of the maximum cavity diameter d
c
using equation (6.51)
combined with equations (6.52) and (6.55) to give:
m
d
m
s
===
Ê
Ë
Á
ˆ
¯
˜
ln ln ln
22 2
2
YY Y
d
c
ll
(6.56)
By comparison with experiments, it is found that the c-parameter defined by:
c=
2Y
l
(6.57)
lies in the range 0.54-0.64 [S
EREBRYAKOV 1972]. Introducing this c-parameter in
equation (6.56), one obtains:
mc
m
ss
mc=
Ê
Ë
Á
ˆ
¯
˜
=++
()
ln ln ln ln
2
1
2
11
2
2
(6.58)
Hence, when s approaches zero, m tends to infinity and the term in ln m can be
neglected with respect to m. It is similar for the last term
ln c 2
()
as c is almost
constant. Hence, we have the following asymptotic behavior:
2
1
m
s
ª ln
(6.59)
6 - SUPERCAVITATION 121
From equation (6.55), for small values of the cavity underpressure, the cavity
slenderness d behaves as:
d
s
s
ª
ln ( / )1
(6.60)
It can easily be checked that the present approximate solution is strictly equivalent
to the G
ARABEDIAN solution expressed by equation (6.35).
6.4.4. UNSTEADY AXISYMMETRIC SUPERCAVITIES
Unsteady, axisymmetric supercavity flows are encountered especially when the
relative cavity underpressure is time-dependent, either because of external pressure
changes (as in the case of vertical motion of the cavitator in a gravity field), or
because the pressure inside the cavity is time-dependent, which is generally the case
for ventilated cavities. The approach already used in the previous section 6.4.3 and
based on the slender body approximation can be generalized to the unsteady case.
Derivation of the solution
The mass conservation equation for an incompressible liquid (6.44) is unchanged.
In this equation, the axial velocity is still approximated by the velocity at infinity so
that the radial velocity still behaves as 1/r. It is determined from the boundary
condition on the cavity interface, where the kinematic condition is:
vr Rxt
R
t
V
R
x
r
(,,)==
∂
∂
+
∂
∂
•
(6.61)
Here R(x,t) is the radius of the cavity at station x and time t. Hence, the radial
velocity
vrxt
r
(,,)
is given by:
v
r
S
t
V
S
x
r
@
∂
∂
+
∂
∂
È
Î
Í
˘
˚
˙
•
1
2p
(6.62)
where
Sxt R(,)=p
2
is the cross-sectional area of the cavity.
Introducing the above expression for the velocity in the unsteady radial E
ULER
equation:
-
∂
∂
=
∂
∂
+
∂
∂
+
∂
∂
Ê
Ë
Á
ˆ
¯
˜
1
r
p
r
v
t
v
v
r
v
v
x
r
r
r
x
r
(6.63)
and again approximating the axial velocity v
x
by V
•
, one obtains:
-
∂
∂
=
∂
∂
+
∂
∂∂
+
∂
∂
È
Î
Í
˘
˚
˙
-
∂
∂
+
∂
∂
È
Î
Í
˘
˚
˙
•• •
11
2
2
1
4
2
2
2
2
2
223
2
rp
p
p
rr
S
t
V
S
xt
V
S
xr
S
t
V
S
x
(6.64)
FUNDAMENTALS OF CAVITATION122
By integrating this equation between the radius R of the cavity where the pressure
is assumed to be p
c
(t) and a radius Y far from the cavity (see § 6.4.3 for details),
one has:
1
8
1
2
2
22
2
2
2
2
2
2
2
p
p
r
R
S
t
V
S
xR
S
t
V
S
xt
V
S
x
ppt
c
∂
∂
+
∂
∂
È
Î
Í
˘
˚
˙
-
È
Î
Í
˘
˚
˙
∂
∂
+
∂
∂∂
+
∂
∂
È
Î
Í
˘
˚
˙
=
-
•••
•
ln
()
Y
(6.65)
This equation, which governs the time-dependent evolution of the cavity, reduces
to equation (6.50) for the steady state flow (
∂∂ =t0
). As in the steady state case,
the first term on the left-hand side is neglected in comparison with the second one,
so that this equation finally reduces to:
∂
∂
+
∂
∂∂
+
∂
∂
È
Î
Í
˘
˚
˙
=-
-
••
•
2
2
2
2
2
2
2
S
t
V
S
xt
V
S
x
ppt
c
k
r
()
(6.66)
where the parameter k is defined by:
k
p
=
2
ln
Y
R
(6.67)
Equation (6.66) can be rewritten in the following form:
∂
∂
+
∂
∂
È
Î
Í
˘
˚
˙
=-
-
•
•
t
V
x
S
ppt
c
2
k
r
()
(6.68)
As in the steady state case for which the m-parameter was considered constant, it is
usually assumed that the k-parameter is constant for elongated cavities. The k- and
m-parameters are connected by:
k
p
m
=
2
(6.69)
Using equations (6.59) and the second equation of (6.35), the asymptotic value of k
is given by:
k
p
s
p
s
ªª
4
1
4
2
22
ln
Cd
D
l
(6.70)
Lagrangian approach
Equation (6.68) is more easily interpreted using a Lagrangian system of coordinates.
Consider a given cross-section of the cavity and suppose that it is convected by
the axial flow at the velocity V
•
. For this cross-section, the origin of time t
0
is
chosen as the instant when it coincides with the cavitator base. At time t, this