Everitt B.S. The Cambridge Dictionary of Statistics
Подождите немного. Документ загружается.

Sequential importance sampling (SIS): A method for approximating the
posterior distribu-
tion
of the state vector for a possible nonlinear dynamic system. Used for prediction and
smoothing of nonlinear and non-Gaussian state space models. [Journal of the American
Statistical Association, 1998, 93, 1032–44.]
Sequential sums of squares: A term encountered primarily in regression analysis for the con-
tributions of variables as they are added to the model in a particular sequence. Essentially the
difference in the residual sum of squares before and after adding a variable. [ARA Chapter 4.]
Seri al corr el a tio n: The correlation often observed between pairs of measurements on the same
subject in a
longitudinal study
. The magnitude of such correlation usually depends on the
time separation of the measurements–typically the correlation becomes weaker as the time
separation increases. Needs to be properly accounted for in the analysis of such data if
appropriate inferences are to be made. [ARA Chapter 10.]
Serial interval: The period from the observation of symptoms in one case to the observation of
symptoms in a second case directly infected from the first.
Serial measurements: Observations on the same subject collected over time. See also longitudi-
nal data . [SMR Chapter 14.]
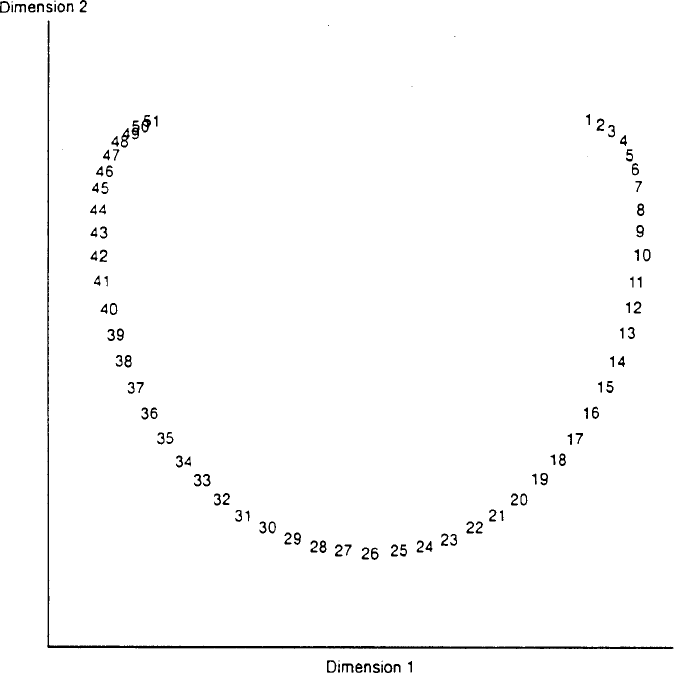
Seri a tio n: The problem of ordering a set of objects chronologically on the basis of dissimilarities or
similarities between them. An example might be a
similarity matrix
for a set of archaeo-
logical graves, the elements of which are simply the number of varieties of artefacts shared
by each pair of graves. The number of varieties in common is likely to decrease as the time
gap between pairs of graves increases and a solution produced by say a
multidimensional
scaling
of the data might be expected to show a linear ordering of graves according to age. In
practice, however, the solution is more likely to show the
horseshoe shape
because for time
intervals above some threshold pairs of graves will have no artefacts in common. Figure 122
shows such a scaling solution. [MV1 Chapter 5.]
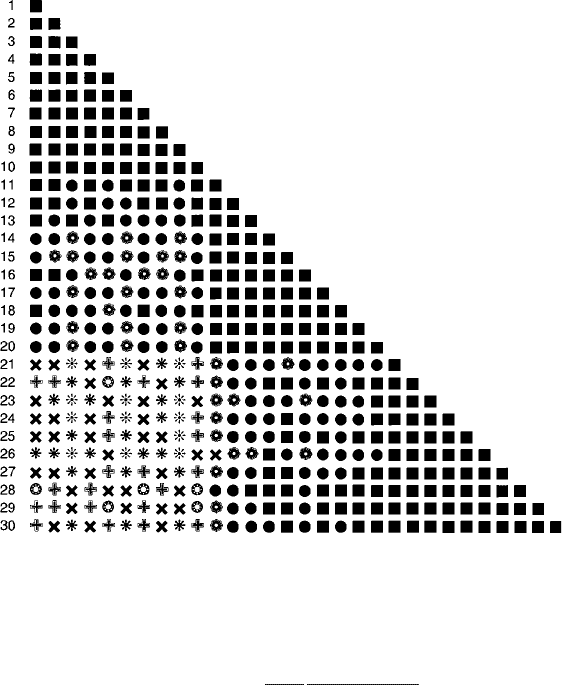
Shadeddistancematrix: A rough but simple way of graphically displaying a solution obtained
from a
cluster analysis
of a set of observations, so that the effectiveness of the solution
can be assessed. The individuals are rearranged so that those in the same cluster are
adjacent to one another in the distance matrix. Distances within a cluster will be small for
tight and well-separated clusters, while the distances between individuals in different
clusters will be large. Coding increasing distance by decreasing gray levels, should result
in a series of dark triangles under each tight well-separated cluster, while clusters that are
simply artifacts of the clustering procedure, will not exhibit such behaviour. See Fig. 123
for an example. [International Journal of Systematic Evolutionary Microbiology, 2004,
54,7–13.]
Shanno n , Cl aude Elwood ( 191 6^2001): Born in Petoskey, Michigan, Shannon obtained a
first degree in mathematics and electrical engineering from the University of Michigan in
1936, and Ph.D. in mathematics from MIT in 1940. After graduating from MIT he took a
job at AT&T’s Bell Laboratories in New Jersey. It was in 1948 that Shannon published
one of the most significant scientific contributions of the twentieth century, ‘A
Mathematical Theory of Communication’, which considered how to transmit messages
while keeping them from becoming garbled by noise. Shannon proposed that the infor-
mation content of a message had nothing to do with its contents but simply with the
number of 1’s and 0’s that it takes to transmit it. In 1958 he moved to MIT and his ideas
spread beyond communications engineering and computer science to the mathematics of
probability, DNA replication and cryptography. Shannon died in Medford, Massachusetts
on 24 February 2001.
389
Shannon’s information measure: A measure of the average information in an event with
probability P, given by
ðlog PÞ
The measure is intuitively reasonable in the sense that the more unlikely the event, the more
information is provided by the knowledge that the event has occurred. The presence of a
logarithm ensures that the information is additive. The logarithmic base is arbitrary and
determines the unit of information. Usually base 2 is used so that information is measured in
bits
. See also information theory and entropy index.[A First Course in Information
Theory, 2006, R. W. Yeung, Springer New York.]
Shape parameter: A general term for a parameter of a probability distribution function that
determines the ‘shape’ (in a sense distinct from location and scale) of the distribution within
a family of shapes associated with a specified type of variable. The parameter, γ,ofa
gamma
distribution
, for example.
Shapiro^Wilks W test: Tests that a set of random variables arise from a specified probability
distribution. Most commonly used to test for depatures from the normal distribution and the
exponential distribution
. For the latter, the
test statistic
is
Fig. 122 Horseshoe effect.
390
W ¼
n
n 1
ð
x x
ð1Þ
Þ
2
P
n
i¼1
ðx
ðiÞ
xÞ
2
where x
ð1Þ
x
ð2Þ
x
ðnÞ
are the ordered sample values and
x is their mean. Critical
values of W based on
simulation
studies are available in many statistical tables. [ARA
Chapter 10.]
Shattuck, Lemuel (1793^1859): Born in Ashby, Massachusetts, Shattuck studied in Detroit,
Michigan. At the age of 30 he returned to Concord, Massachusetts to operate a store, but
eventually moved to Boston where he became a bookseller and publisher. Shattuck became
interested in statistics while preparing a book, A History of the Town of Concord, one of the
chapters of which deals with statistical history. He became very influential in publicizing the
importance of high standard population statistics, and also founded the American Statistical
Association.
Shepard diagram: A type of plot used in
multidimensional scaling
in which observed
dissimilarity
coefficients
are plotted against the distances derived from the scaling solution. By joining
together consecutive points in the diagram insight can be gained into the transformation
needed to convert the observed dissimilarities into distances. [Analysis of Proximity Data,
1997, B. S. Everitt and S. Rabe-Hesketh, Edward Arnold, London.]
Sheppard’scorrections: Corrections to the sample
moments
when those are calculated from the
values of a grouped frequency distribution as if they were concentrated at the mid-points of
Fig. 123 An example of a shaded distance matrix.
391

the chosen class intervals. In particular the variance calculated from such data should be
corrected by subtracting from it h
2/12
where h is the length of the interval. [KA1 Chapter 2.]
Shewhart chart: A control chart designed to identify the time at which a significant deviation in a
process occurs. See also cusum and exponentially weighted moving average control
chart.[Clinical Chemistry, 1981, 27, 493–501.]
Shewhart,W a lterA ( 1 891-1 967): Born in New Canton, Illinois, Shewhart received his Ph.D in
physics from the University of California, Berkeley in 1917. He began his professional life
as an engineer with the Western Electric Company and joined Bell Laboratories in 1925.
Most remembered for his invention of the statistical control of quality, Shewhart died on 13
March 1967.
Shi fted hats proced ure: A hybrid approach to classification that uses both
kernel estimation
techniques and
finite mixture models
, essentially alternating between the two. [Pattern
Recognition, 1993, 26, 771–85.]
Shi ft outli er: An observation than needs a ‘shift’ of a particular magnitude for it to be consistent
with the rest of the sample. [Annals of the Institute of Statistical Mathematics, 1994, 46,
267–78.]
Shi ft tables: Tables used to summarize and interpret laboratory data usually showing, by treatment,
the number of patients who have ‘shifted’ from having ‘normal’ to having ‘abnormal’ values
during the trial and vice versa. [Analysis of Clinical Trials using SAS, A Practical Guide,
2005, A.Dmitrienko, G. Molenberghs, C. Chuang-Stein and W. Offen, SAS Publishing.]
Shock models: Probabilistic models of importance in the analysis of different risks in which the
effects of instantaneous harmful random events that represent danger to human beings, the
environment or to economic value are assessed. [Statistics and Probability Models, 2005,
74, 187–204.]
Shri nkage: The phenomenon that generally occurs when an equation derived from, say, a
multiple regression
, is applied to a new data set, in which the model predicts much less
well than in the original sample. In particular the value of the
multiple correlation
coefficient
becomes less, i.e. it ‘shrinks’. See also shrinkage formulae .[Biometrics,
1976, 32,1–49.]
Shrinkage estimators: Estimators obtained by some common method of estimation such as
maximum likelihood estimation
or
least squares estimation
, modified in order to minimize
(maximize) some desirable criterion function such as
mean square error
. See also ridge
regression and James–Stein estimators.[Biometrics, 1976, 32,1–49.]
Shri nkage formulae: Usually used for formulae which attempt to estimate the amount of ‘shrink-
age’ in the
multiple correlation coefficient
when a regression equation derived on one set of
data is used for prediction on another sample. Examples are Wherry’s formula,
^
R
2
s
¼ 1 ðn 1Þ=ðn k 1Þð1 R
2
Þ
and Herzberg’s formula,
^
R
2
s
¼ 1
n 1
n k 1
n 2
n k 2
n þ 1
n
ð1 R
2
Þ
where R
2
is the multiple correlation coefficient in the original sample, n is the sample size, k
is the number of variables in the equation and
^
R
2
s
is the estimated value of the multiple
392
correlation coefficient when the regression equation is used for prediction in the new sample.
[Statistical Methods in Medical Research, 1997, 6, 167–83.]
Sibling estimators: Estimators based on sibling data that are designed to control for common
genetic and environmental family variables using sibling-specific effects. [International
Economic Review, 1975, 16, 422–449.]
Siegel^Tukey test: A
distribution free
test for the equality of variance of two populations having
the same median. See also Ansari–Bradley test, Conover test and Klotz test.[Handbook
of Parametic and Nonparametric Statistical Procedures, 3rd edn. D. J. Sheskin, Chapman
and Hall/CRC Press, Boca Raton.]
Sigmoid: A description of a curve having an elongated ‘S’-shape. [Modelling Binary Data, 2nd
edition, 2003, D. Collett, Chapman and Hall/CRC Press, London.]
Signedrank test: See Wilcoxon’s signed rank test .
Signed root transformation: A useful procedure for constructing
confidence intervals
when the
observed
likelihood function
is noticeably non-normal. The transformation is
z
n
ðÞ¼
ffiffiffiffiffiffiffiffiffiffiffiffiffiffiffiffiffiffiffiffiffiffiffiffiffiffiffiffiffiffiffiffiffiffiffiffiffiffiffiffiffiffiffiffiffiffiffiffiffiffiffiffiffiffiffiffiffi
½2fl
n
ð
^
Þl
n
ðÞgsignð
^
Þ
q
where l
n
ðÞ is the log-likelihood for n observations and
^
is the maximum likelihood
estimator of . The quantity z
n
is approximately standard normal for n large for each fixed .
[Biometrika, 1973, 60, 457–65.]
Significance level: The level of probability at which it is agreed that the null hypothesis will be
rejected. Conventionally set at 0.05. [SMR Chapter 8.]
Significance test: A statistical procedure that when applied to a set of observations results in a
p-value
relative to some hypothesis. Examples include
Student’s t-test
,
z-test
and
Wilcoxon’s signed rank test
. [SMR Chapter 8.]
Signtest: A test of the null hypothesis that positive and negative values among a series of observations
are equally likely. The observations are often differences between a response variable
observed under two conditions on a set of subjects. [SMR Chapter 9.]
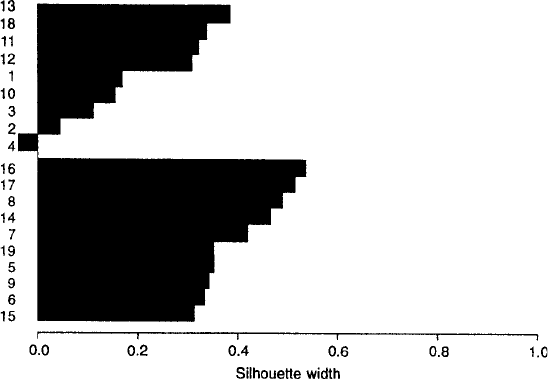
Silhouette plot: A graphical method of assessing the relative compactness and isolation of groups
arising from a cluster analysis. For each object i an index s(i) [–1, 1] is defined measuring
the (standardized) difference between the average dissimilarity (distance) of object i to all
other objects in its own cluster and the average dissimilarity (distance) of object i to all
objects in the nearest cluster to the one it is in. When s(i) is close to the value 1, object i is
nearer its own cluster than a neighbouring cluster and so is ‘well classi fied’. When the
opposite is the case and s(i) is close to –1 the object i is taken to be ‘misclassified’. In the
silhouette plot the s(i) are dispalyed as horizontal bars, ranked in decreasing order for each
cluster. An example is shown in Fig. 124. See also icicle plot [Computational Statistics and
Data Analysis, 2006, 51, 526–544.]
Simes modified Bonferroni procedure: An improved version of the
Bonferroni correction
for conducting multiple tests of significance. If H ¼fH
1
; H
2
; ...; H
n
g is a set of null
hypotheses with corresponding test statistics T
1
; T
2
; ...; T
n
, P-values, P
1
; ...; P
n
and
H
0
is the hypothesis that all H
i
; i ¼ 1; 2; ...; n are true, the suggested procedure rejects
H
0
if and only if there exists some value of j (1 j n) such that P
ðjÞ
jα=n where
P
ð1Þ
P
ðnÞ
are the ordered values of P
1
; ...; P
n
.[Biometrika, 1996, 83, 928–33.]
393
SIMEX: Abbreviation for simulation and extrapolation procedure.
Simi larity coefficient: Coefficients ranging usually from zero to one used to measure the similarity
of the variable values of two observations from a set of multivariate data. Most commonly
used on binary variables. Example of such coefficients are the
matching coefficient
and
Jaccard’s coefficient
. [MV1 Chapter 5.]
Simi larity matrix: A
symmetric matrix
in which values on the main diagonal are one and off-
diagonal elements are the values of some
similarity coefficient
for the corresponding pair of
individuals. [MV1 Chapter 5.]
Simplerandom sampling: A form of
sampling design
in which n distinct units are selected from
the N units in a finite population in such a way that every possible combination of n units is
equally likely to be the sample selected. With this type of sampling design the probability
that the ith population unit is included in the sample is p
i
¼ n=N , so that the inclusion
probability is the same for each unit. Designs other than this one may also give each unit
equal probability of being included, but only here does each possible sample of n units have
the same probability. [SMR Chapter 8.]
Simple structure: See factor analysis.
Simplex algorithm: A procedure for maximizing or minimizing a function of several variables. The
basic idea behind the algorithm is to compare the values of the function being minimized at
the vertices of a simplex in the parameter space and to move this simplex gradually towards
the minimum during the iterative process by a combination of reflection, contraction and
expansion. See also Newton–Raphson method. [MV2 Chapter 12.]
Simplex models: Models for the analysis of relationships among variables that can be arranged
according to a logical ordering. [Psychometrika, 1962, 27, 155–62.]
Simpson’sparadox: The observation that a measure of association between two variables (for
example, type of treatment and outcome) may be identical within the levels of a third
variable (for example, sex), but can take on an entirely different value when the third
variable is disregarded, and the association measure calculated from the pooled data. Such
Fig. 124 Silhouette plot.
394

a situation can only occur if the third variable is associated with both of the other two
variables. As an example consider the following pair of
two-by-two contingency tables
giving information about amount of pre-natal care and survival in two clinics.
Clinic A
Infant’s survival
Died Survived Total
Less 3 176 179
Amount of Care
More 4 293 297
Total 7 469 476
Clinic B
Infant’s survival
Died Survived Total
Less 17 197 214
Amount of Care
More 2 23 25
Total 19 220 239
In both clinics A and B, the
chi-squared statistic
for assessing the hypothesis of independ-
ence of survival and amount of care leads to acceptance of the hypothesis. (In both cases the
statistic is almost zero.) If, however, the data are collapsed over clinics the resulting chi-
squared statistic takes the value 5.26, and the conclusion would now be that amount of care
and survival are related. See also collapsing categories and log-linear models.[Applied
Categorical Data Analysis, 1987, D. H. Freeman, Jr., Marcel Dekker, New York.]
Simulated annealing: An
optimization
technique, which is based on an analogy with the physical
process of annealing, the process by which a material undergoes extended heating and is
slowly cooled. Can be helpful in overcoming the local minimum problem by allowing some
probability of change in parameter values that lead to a local increase. [MV1 Chapter 4.]
Simulation: The artificial generation of random processes (usually by means of
pseudorandom
numbers
and/or computers) to imitate the behaviour of particular statistical models. See
also Monte Carlo methods. [SMR Chapter 7.]
Simulation and extrapolation (SIMEX) procedure: A procedure for calibration that is
computationally intensive but is applicable to highly
non-linear models
. The method can
be most clearly illustrated in simple
linear regression
when the explanatory variable is
subject to measurement error. If the regression model is
E ð Y jX Þ¼α þβX
but with W ¼ X þ U observed rather than X, where U has mean zero and variance 1 and
the measurement error variance
2
is known. For any fixed l
4
0 suppose that one repeatedly
‘adds on’ via simulation, additional error with mean zero and variance
2
l to W, computes
the ordinary least squares slope each time and then takes the average. The simulation
estimator consistently estimates
gðlÞ¼
2
x
2
x
þ
2
ð1 þlÞ
β
where
2
x
is the variance of X. Plotting gðlÞ against l 0, fitting a suitable model and then
extrapolating back to l ¼1 will yield a consistent estimate of β.[Measurement Error in
Nonlinear Models,: A Modern Perspective, 2nd edn, 2006, R. J. Carroll, D. Ruppert, L. A.
Stefanski, and C. Crainiceau, Chapman and Hall/CRC, Boca Raton,]
395
Simulation envelope: A
confidence interval
about the expected pattern of
residuals
if the fitted
model is true, constructed by simulating the distribution of the residuals taking estimated
model parameters as true values. [Statistical Inference, 2nd edn, 2002, P. H. Garthwaite, I. T.
Joliffe and B. Jones, Oxford. University Press, Oxford.]
Simultaneous confidence interval: A
confidence interval
(perhaps more correctly a region)
for several parameters being estimated simultaneously. [KA2 Chapter 20.]
Simultaneous inference: Inference on several parameters simultaneously, when the parameters
are considered to constitute a family in some sense. See also multiple comparisons.
[Biometrical Journal, 2008, 50, 346–363.]
Sinclair, John(1754^1835): Born in Thurso Castle, Caithness, Scotland, Sinclair was educated at
the high school of Edinburgh and at Edinburgh, Glasgow and Oxford universities where he
read law. His lifelong enthusiasm for collecting ‘useful information’ led to his work The
Statistical Account of Scotland which was published between 1791 and 1799 in 21 volumes
each of 600–700 pages. One of the first data collectors, Sinclair first introduced the words
‘statistics’ and ‘statistical’ as now understood, into the English language. He died on 21
December 1835 in Edinburgh.
Single-blind: See blinding.
Single-case study: Synonym for N of 1 clinical trial.
Sing le index model: A generalization of the linear regression model and given by EðyjxÞ¼gðxÞ
where g is an unknown function. Often used in the finance industry to measure risk and return
of a stock. [Biometrika, 2007, 94,217–229.]
Sing l e-l inkage cl uste ring: A method of
cluster analysis
in which the distance between two
clusters is defined as the least distance between a pair of individuals, one member of the
pair being in each group. [Cluster Analysis, 4th edition, 2001, B. S. Everitt, S. Landau and
M. Leese, Arnold, London.]
Sing le-masked: Synonym for single-blind.
Si ngl e sample t-test: See Student’s t-tests.
Singly censored data:
Censored observations
that occur in
clinical trials
where all the patients
enter the study at the same time point, and where the study is terminated after a fixed time
period. See also progressively censored data.[Applied Life Data Analysis, 2004,
W. Nelson, Wiley, New York.]
Sing u la r mat rix: A square matrix whose determinant is equal to zero; a matrix whose inverse is not
defined. See also Moore–Penrose inverse.
Singular value decomposition: The decomposition of an r c matrix, A into the form
A ¼ USV
0
where U and V
0
are orthogonal matrices and S is a diagonal matrix. The basis of several
techniques of multivariate analysis including
correspondence analysis
. [MV1 Chapter 4.]
Sinh-normal distribution: The probability distribution, f(x), given by
f ðxÞ¼½2=ðα
ffiffiffiffiffiffi
2p
p
Þcosh½ðx γÞ=expfð2=α
2
Þsinh
2
½ðx γÞ=g
The distribution is symmetric about the location parameter γ, is strongly unimodal for α 2
and bimodal for α
4
2. The distribution of the logarithm of a random variable having a
396
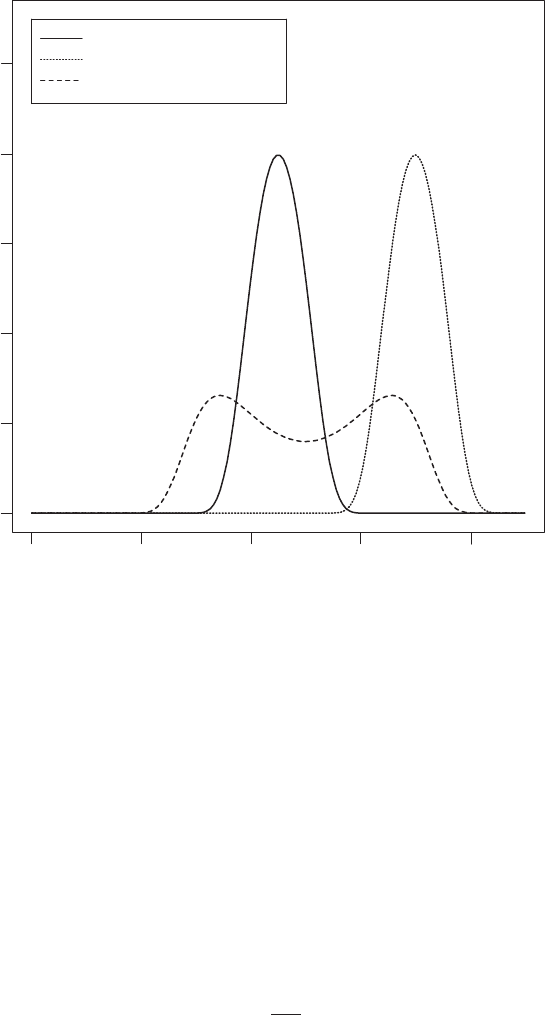
Birnbaum–Saunders distribution
. Some examples are given in Fig. 125.[International
Maths Forum, 2006, 35, 1709–1727.]
Six sigma initiative: A programme aimed at the near elimination of defects from every product,
process and transaction within a company by adopting a highly disciplined and statistically
based approach. [Quality Progress, 1988, May, 60–4.]
SiZer map: A graphical device for use in association with smoothing methods in data analysis, that
helps to answer which observed features are ‘really there’ as opposed to being spurious
sampling artifacts. [Journal of the American Statistical Association, 1999, 94, 807–23.]
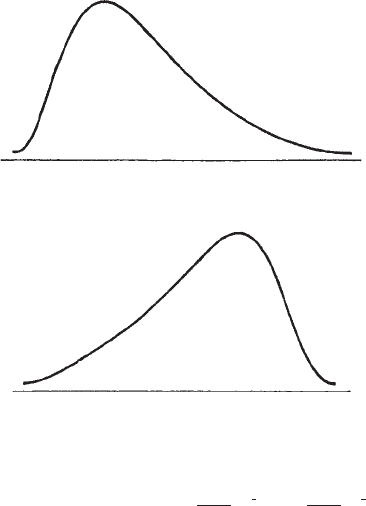
Skewness: The lack of symmetry in a probability distribution. Usually quantified by the index, s,
given by
s ¼
3
3=2
2
where µ
2
and µ
3
are the second and third
moments
about the mean. The index takes the value
zero for a
symmetrical distribution
. A distribution is said to have positive skewness when it
has a long thin tail to the right, and to have negative skewness when it has a long thin tail to
the left. Examples appear in Fig. 126. See also kurtosis. [KA1 Chapter 3.]
Skew -no rmal distr i buti o n: A probability distribution, f(x), given by
x
f(x)
−4 −2 0 2 4
0.0 0.2 0.4 0.6 0.8 1.0
alpha = 1.0,gamma = 0.5
alpha = 1.0,gamma = 3.0
alpha = 5.0,gamma = 1.0
Fig. 125 Sinh-normal distributions for several values of α and γ.
397
f ðxÞ¼2
1
ffiffiffiffiffiffi
2p
p
e
1
2
x
2
Z
lx
1
1
ffiffiffiffiffiffi
2p
p
e
1
2
u
2
du; 1
5
x
5
1
For l ¼ 0 this reduces to the standard normal distribution. [Biometrika, 1996, 83, 715–26.]
Skew-symmet ric matrix: A matrix in which the elements a
ij
satisfy
a
ii
¼ 0; a
ij
¼a
ji
i 6¼ j
An example of such a matrix is A given by
A ¼
013
10 2
3 20
0
@
1
A
Sl iced i nverse reg ressio n: A data-analytic tool for reducing the number of explanatory variables
in a regression modelling situation without going through any parametric or nonparametric
model-fitting process. The method is based on the idea of regressing each explanatory
variable on the response variable, thus reducing the problem to a series of one-dimensional
regressions. [Journal of the American Statistical Association, 1994, 89, 141–8.]
Sli ding square plot: A graphical display of
paired samples
data. A scatterplot of the n pairs of
observations ðx
i
; y
i
Þ forms the basis of the plot, and this is enhanced by three
box-and-
whisker plots
, one for the first observation in each pair (i.e. the control subject or the
measurement taken on the first occasion), one for the remaining observation and one for
the differences between the pairs, i.e. x
i
y
i
. See Fig. 127 for an example. [The American
Statistician, 1994, 48, 249–253.]
Sli me plot: A method of plotting
circular data
recorded over time which is useful in indicating changes
of direction. [Statistical Analysis of Circular Data, 1995, N. I. Fisher, Cambridge University
Press, Cambridge.]
Sloperatioassay: A general class of biological assay where the
dose–response
lines for the standard
test stimuli are not in the form of two parallel regression lines but of two different lines with
Distribution with positive skewness.
Distribution with ne
g
ative skewness.
Fig. 126 Examples of skewed
distributions.
398