Everitt B.S. The Cambridge Dictionary of Statistics
Подождите немного. Документ загружается.

Modeller and Predictor, 1995, S. J. Koopman, A. C. Harvey, J. A. Doornik and N. Shephard,
Chapman and Hall/CRC Press, London.]
Standa rd curve: The curve which relates the responses in an assay given by a range of standard
solutions to their known concentrations. It permits the analytic concentration of an unknown
solution to be inferred from its assay response by interpolation.
Standard design: Synonym for Fibonacci dose escalation scheme.
Standard deviation: The most commonly used measure of the spread of a set of observations.
Equal to the square root of the variance. [SMR Chapter 3.]
Standard error: The standard deviation of the
sampling distribution
of a statistic. For example, the
standard error of the sample mean of n observations is =
ffiffiffi
n
p
, where
2
is the variance of the
original observations. [SMR Chapter 8.]
Standard gamble: An alternative name for the von Neumann–Morgensten standard gamble.
Standa rd ga mma d ist ri buti o n: See gamma distribution.
Standa rd izati on: A term used in a variety of ways in medical research. The most common usage is
in the context of transforming a variable by dividing by its standard deviation to give a new
variable with standard deviation 1. Also often used for the process of producing an index of
mortality, which is adjusted for the age distribution in a particular group being examined.
See also standardized mortality rate, indirect standardization and direct standardiza-
tion. [SMR Chapter 2.]
Standardizedmortalityrate (SMR): The number of deaths, either total or cause- specific, in a
given population, expressed as a percentage of the deaths that would have been expected if
the age and sex-specific rates in a ‘standard’ population had applied. [SMR Chapter 2.]
Standard ized range p roced ure: See many outlier detection procedures.
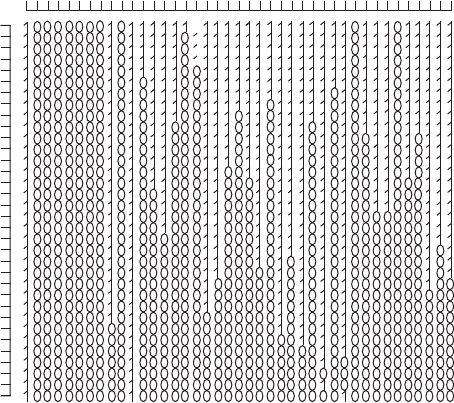
Observation
1 4 7 10 13 16 19 22 25 28 31 34 4037
41 38 3235 29 26 23 20 17 14 811
N of observations used for estimation
Fig. 131 Stalactite plot of seven climate and ecology variables measured on 41 cities in the USA.
409
Standar d ized reg ressio n coeff ic ient: See beta coefficient.
Standardizedresidual: See residual.
Standard logistic distribution: See logistic distribution.
Standard normal variable: A variable having a normal distribution with mean zero and variance
one. [SMR Chapter 4.]
Standard scores: Variable values transformed to zero mean and unit variance.
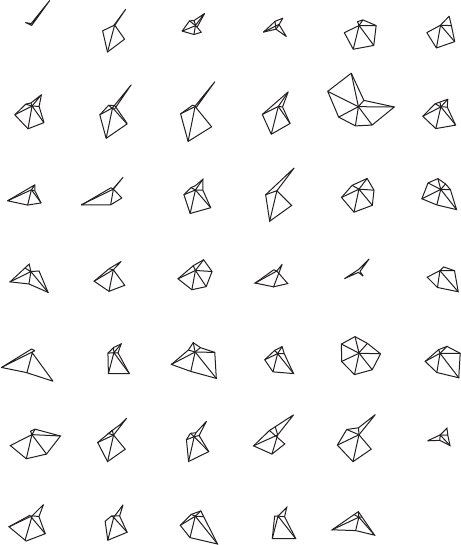
Star pl ot: A method of representing
multivariate data
graphically. Each observation is represented
by a ‘star’ consisting of a sequence of equiangular spokes called radii, with each spoke
representing one of the variables. The length of a spoke is proportional to the value of the
variable it represents relative to the maximum value of the variable across all the
observations in the sample. The star plots for each of the 41 cities in the USA constructed
from seven climate and ecology variables measured on each city are shown in Fig. 132.
Chicago is clearly identified as being very different from the other four cities.
STATA: A comprehensive software package for many forms of statistical analysis; particularly useful
for epidemiological and
longitudinal data
. [STATA Corporation, 4905 Lakeway Drive,
College Station, TX 77845, USA; Timberlake Consultants, Unit B3, Broomsley Business
Park, Worsley Bridge Rd., London SE26 5BN, UK; www.stata.com.]
Phoenix
Washington
Des Moines
Wichita
Kansas City
St. Louis
Buffalo
Providence
Norfolk
Memphis
Richmond
Seattle
Charleston
Milwaukee
Nashville
Dallas
Houston
Salt Lake Cit
y
Cincinnati
Columbus
Pittsburgh
PhiladelphiaCleveland
Minneapolis-St. Paul
Louisville
New Orleans
Baltimore
Detroit
AlbanyOmaha
Alburquerque
Jacksonville
Miami
Atlanta
Chicago
Indianapolis
Little Rock
San Francisco
Denver
Wilmington
Haitford
Fig. 132 Star plots for 41 cities in the United States.
410
State space: See stochastic process.
State-space representati o n o f ti me ser ies: A compact way of describing a
time series
based on the result that any finite-order linear difference equation can be rewritten as a first-
order vector difference equation. For example, consider the following autoregressive model
X
t
þ a
1
X
t1
þ a
2
X
t2
¼
t
and write X
ð2Þ
t
¼ X
t
, X
ð1Þ
t
¼a
2
X
t1
ð¼ a
2
X
ð2Þ
t1
Þ then the model may be rewritten as
X
ð1Þ
t
X
ð2Þ
t
!
¼
0 a
2
1 a
1
X
ð1Þ
t1
X
ð2Þ
t1
!
þ
0
1
t
To recover X
t
from the vector ½X
ð1Þ
t
; X
ð2Þ
t
0
we use
X
t
¼½0; 1
X
ð1Þ
t
X
ð2Þ
t
!
The original model involves a two-stage dependence but the rewritten version involves only
a (vector) one-stage dependence. [Applications of Time Series Analysis in Astronomy and
Meterology, 1997, edited by T. Subba Rao, M. B. Priestley and O. Lessi, Chapman and Hall/
CRC Press, London.]
Stationarity: A term applied to
time series
or
spatial data
to describe their equilibrium behaviour. For
such a series represented by the random variables, X
t
1
; X
t
2
; ...; X
t
n
, the key aspect of the term
is the invariance of their joint distribution to a common translation in time. So the require-
ment of strict stationarity is that the joint distribution of fX
t
1
; X
t
2
; ...; X
t
n
g should be
identical to that of fX
t
1
þh
; X
t
2
þh
; ...; X
t
n
þh
g for all integers n and all allowable h,
1
5
h
5
1. This form of stationarity is often unnecessarily rigorous. Simpler forms are
used in practice, for example, stationarity in mean which requires that EfX
t
g does not
depend on t. The most used form of stationarity, second-order stationarity, requires that the
moments up to the second order, EfX
t
g; varfX
t
g and covfX
t
i
þh
; X
t
j
þh
g,1 i; j n do not
depend on translation time. [TM2 Chapter 2.]
Stationary distribution: See Markov chain.
Stationary point process: A
stochastic process
defined by the following requirements:
(a) The distribution of the number of events in a fixed interval ðt
1
; t
2
Þ is invariant under
translation, i.e. is the same for ð t
1
þ h; t
2
þ h for all h.
(b) The joint distribution of the number of events in fixed intervals ðt
1
; t
2
; ðt
3
; t
4
is
invariant under translation, i.e. is the same for all pairs of intervals
ðt
1
þ h; t
2
þ h; ðt
3
þ h; t
4
þ h for all h.
Consequences of these requirements are that the distribution of the number of events in an
interval depends only on the length of the interval and that the expected number of events in
an interval is proportional to the length of the interval. [Spatial Statistics, 2nd edition, 2004,
B. D. Ripley, Wiley, New York.]
Statistic: A numerical characteristic of a sample. For example, the sample mean and sample variance.
See also parameter.
Statistical d iscl osure l im itati o n: Procedures whose purpose is to ensure that the risk of
disclosing confidential information about identifiable persons, businesses etc., will be very
small. The goal of disclosure limitation is to achieve an acceptable balance between data
utility and disclosure risk. Data utility is a measure of the usefulness of a dataset for making
accurate inferences and disclosure risk measures the degree to which a dataset and its
411
realised statistics reveal sensitive information. A variety of methodologies have been
developed for this data protection task, for example, adding random noise to the original
data (data perturbation) and choosing random pairs of respondents and exchanging a
fraction of their data (data swapping). [Statistical Science, 2006, 21, 143–154.]
Statistical expert system: A computer program that leads a user through a valid statistical
analysis, choosing suitable tools by examining the data and interrogating the user, and
explaining its actions, decisions, and conclusions on request.
Statist icalgra p h ics: Graphics that display measured quantities by means of the combined use of
points, lines, a coordinate system, numbers, symbols, words, shading and colour.
Graphical displays are very popular; it has been estimated that between 900 billion
(9 × 10
11
) and 2 trillion (2 × 10
12
) images of statistical graphics are printed each year.
Perhaps one of the main reasons for such popularity is that graphical presentation of data
often provides the vehicle for discovering the unexpected; the human visual system is very
powerful in detecting patterns, although the following caveat from the late Carl Sagan
should be kept in mind namely, ‘Humans are good at discerning subtle patterns that are
really there, but equally so at imagining them when they are altogether absent.’ The prime
objective of a graphical display is to communicate to ourselves and others. Graphic design
must do everything it can to help people understand. In some cases a graphic is required to
give an overview of the data and perhaps to tell a story about the data. In other cases a
researcher may want a graphical display to suggest possible hypotheses for testing on new
data and after some model has been fitted to the data a graphic that criticizes the model
may be what is needed (for example, a plot of
residuals
.) Examples of statistical graphics
are given in the following entries;
histogram, bar chart, pie chart, dot plot, scatterplot,
scatterplot matrix
, and
coplot
. See also graphical deception.[Visual Revelations, 1997,
H. Wainer, Springer, New York.]
Statist ical j ou rn al s: A list of journals which publish articles in statistical science is given on the
web site, www.statsci.org/jourlist.html. Amongst these are journals that publish primarily
theoretical papers, for example, Biometrika, Journal of the Royal Statistical Society, Series B
and Annals of Statistics, journals that also publish more applied papers like Journal of the
Royal Statistical Society, Series C and Journal of the American Statistical Association and
journals that publish papers in one particular area, for example medical statistics with
journals like Statistics in Medicine and Statistical Methods in Medical Research.
Statistical quality control (SPC): The inspection of samples of units for purposes relating to
quality evaluation and control of production operations, in particular to:
(1) determine if the output from the process has undergone a change from one point in
time to another;
(2) make a determination concerning a finite population of units concerning the overall
quality;
(3) screen defective items from a sequence or group of production units to improve the
resulting quality of the population of interest.
[Statistical Methods for Quality Improvement, 1989, T. P. Ryan, Wiley, New York.]
Statisti calquotat i o ns: These range from the well known, for example, ‘a single death is a tragedy,
a million deaths is a statistic’ (Joseph Stalin) to the more obscure ‘facts speak louder than
statistics’ (Mr Justice Streatfield). Other old favourites are ‘I am one of the unpraised,
unrewarded millions without whom statistics would be a bankrupt science. It is we who
are born, marry and who die in constant ratios.’ (Logan Pearsall Smith) and ‘thou shalt not sit
with statisticians nor commit a Social Science’ (W. H. Auden).
412
Statistical societies: A list of professional societies with statistical interests and links to their
respective web sites is given on www.statsci.org/soc.html.
Statistical software: Computer programs that implement a wide range of statistical techniques
and which are reasonably easy to use even for non-statisticians. The use of statistical
computer packages by statisticians and other started in the 1950s and today there is a
plethora of packages, all of which can be used on a researchers PC. Perhaps the most widely
used are SAS, STATA, SPSS and STATISTICA, although R is favoured by many statis-
ticians. Such software enables even naive researchers to apply sophisticated statistical
methodology to their data which is, of course, not without its dangers. In all current
statistical software there is a heavy emphasis on graphical methods. See also BMDP,
GLIM, GENSTAT, MINITAB, S-PLUS, EGRET, BUGS, STATXACT and
LOGXACT .[American Statistician, 1994, 48, 254–255.]
Statistical surveillance: The continual observation of a
time series
with the goal of detecting an
important change in the underlying process as soon as possible after it has occurred. An
example of where such a procedure is of considerable importance is in monitoring foetal heart
rate during labour. [Journal of the Royal Statistical Society, Series A, 1996, 159,547–63.]
Statistics: Either the plural of statistic or the name of a discipline that many have tried to define; some
examples are
*
Statistics may be regarded as (i) the study of populations, (ii) as the study of variation,
(iii) as the study of methods for the reduction of data.
*
Statistics is concerned with the inferential process, in particular with the planning and
analysis of experiments or surveys, with the nature of observational errors and sources
of variability that obscure underlying patterns, and with the efficient summarizing of
sets of data.
*
The technology of the scientific method
*
Statistics is a general intellectual method that applies wherever data, variation, and
chance appear. It is a fundamental method because data, variation and chance are
omnipresent in modern life. It is an independent discipline with its own core ideas,
rather than, for example, a branch of mathematics...Statistics offers general, funda-
mental and independent ways of thinking.
There is clearly no consensus but certain elements appear in most definitions namely, variation,
uncertainty, and inference. One thing that statistics is not is simply a branch of mathematics.
STATISTI CA: A comprehensive package for many forms of statistical analysis. [StatSoft, Inc., 2300
East 14th Street, Tulsa OK 74104, USA; www.statsoft.com.]
Statistics fo r the terri fied: A computer-aided learning package for statistics. See also Activ
Stats.[Statistics for the Terrified, version 3.0, 1998, Radcliffe Medical Press, Oxford.]
STAT/TRA N SFE R: Software for moving data from one proprietary format to another. [Circle
System, 1001 Fourth Ave., Suite 3200, Seattle, WA 98154.]
STATXACT: A specialized statistical package for analysing data from
contingency tables
that pro-
vides exact p-values, which, in the case of sparse tables may differ considerable from the
values given by
asymptotic statistics
such as the
chi-squared statistic
. [www.Cytel.com/
products/statxact/]
Steepest descent: A procedure for finding the maximum or minimum value of several variables by
searching in the direction of the positive (negative) gradient of the function with respect to the
parameters. See also simplex method and Newton–Raphson method. [MV1 Chapter 4.]
413
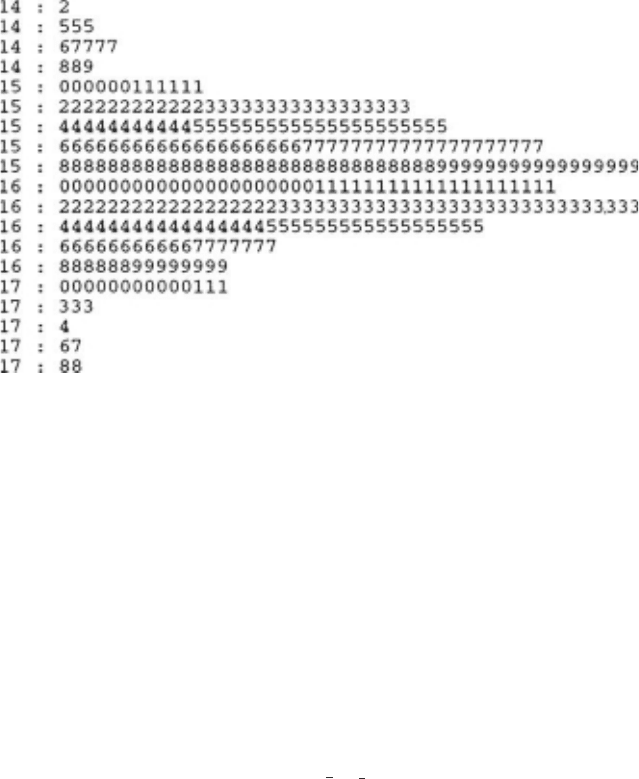
Stem-and -leaf plot: A method of displaying data in which each observation is split into two parts
labelled the ‘stem’ and the ‘leaf’. A tally of the leaves corresponding to each stem has the
shape of a
histogram
but also retains the actual observation values. See Fig. 133 for an
example. See also back-to-back stem-and-leaf plot. [SMR Chapter 3.]
Stepwise reg ressi o n: See selection methods in regression.
Stereology: The science of inference about three-dimensional structure based on two-dimensional or
one-dimensional probes. Has important applications in mineralogy and metallurgy.
[Quantitative Stereology, 1970, E. E. Underwood, Addison-Wesley, Reading.]
Stieltjes integral: See Riemann–Stieltjes integral.
Stirling’sformula: The formula
n! ð2pÞ
1
2
n
nþ
1
2
e
n
The approximation is remarkably accurate even for small n. For example 5! is approximated
as 118.019. For 100! the error is only 0.08%. [Handbook of Mathematical and
Computational Science, 1998, J. W. Harris and H. Stocker, Springer, New York.]
Stochastic approximation: A procedure for finding roots of equations when these roots are
observable in the presence of statistical variation. [Stochastic Approximation, 2004, M. T.
Wasson, Cambridge University Press, Cambridge.]
Stochasticfrontiermodels: Models that postulate a function hðÞrelating a vector of explanatory
variables, x, to an output, y
y ¼ hðxÞ
where the function hðÞ is interpreted as reflecting best practice, with individuals typically
falling short of this benchmark. For an individual i , who has a measure of this shortfall, τ
i
with 0
5
τ
i
5
1
y
i
¼ hðxÞτ
i
Fig. 133 A stem-and-leaf plot for the heights of 351 elderly women.
414
The model is completed by adding measurement error (usually assumed to be normal)
choosing a particular functional form for hðÞ and a distribution for τ
i
.[Journal of
Econometrics, 1977, 6,21–37.]
Stochastic matrix: See Markov chain.
Stochastic ordering: See univariate directional ordering.
Stochastic process: A series of random variables, fX
t
g, where t assumes values in a certain range
T. In most cases x
t
is an observation at time t and T is a time range. If T ¼f0; 1; 2; ...g the
process is a discrete time stochastic process and if T is a subset of the nonnegative real
numbers it is a continuous time stochastic process. The set of possible values for the process,
T, is known as its state space. See also Brownian motion, Markov chain and random
walk.[Theory of Stochastic Processes, 1977, D. R. Cox and H. D. Miller, Chapman and
Hall/CRC Press, London.]
Stoppi ng rules: Procedures that allow
interim analyses
in
clinical trials
at predefined times, while
preserving the type I error at some pre-specified level. See also sequential analysis.
Stop screen design: See screening studies.
Strata: See stratification.
Stratification: The division of a population into parts known as strata, particularly for the purpose of
drawing a sample. In addition in
epidemiology
for example, stratification may be used to
asses associations between exposure and disease in strata of a third variable or possibly strata
defined by several variables in an investigation of confounding and effect modification.
Strat i f i ed Cox models: An extension of
Cox’s proportional hazards model
which allows for
multiple strata which divide the units into distinct groups, each of which has a distinct
baseline hazard function but common values for the coefficient vector β.[Modelling
Survival Data, 2000, T. M. Therneau and P. M. Grambsch, Springer, New York.]
Stratifiedlogrank test: A method for comparing the survival experience of two groups of subjects
given different treatments, when the groups are stratified by age or some other prognostic
variable. [Modelling Survival Data in Medical Research, 2nd edition, 2003, D. Collett,
Chapman and Hall/CRC Press, London.]
Stratifiedrandomization: A procedure designed to allocate patients to treatments in
clinical trials
to achieve approximate balance of important characteristics without sacrificing the advan-
tages of random allocation. See also minimization.[Journal of Clinical Epidemology, 1999,
52,19–26.]
Stratifiedrandom sampling: Random sampling from each strata of a population after
stratifica-
tion
.[Survey Sampling Principles, 1991, E. K. Foreman, Marcel Dekker, New York.]
Streaky hypothesis: An alternative to the hypothesis of independent
Bernoulli trials
with a constant
probability of success for the performance of athletes in baseball, basketball and other sports. In
this alternative hypothesis, there is either nonstationarity where the probability of success does
not stay constant over the trials or autocorrelation where the probability of success on a given trial
depends on the player’s success in recent trials. [The American Statistician, 2001, 55,41–50.]
Stress : A term used for a particular measure of goodness-of-fitin
multidimensional scaling
.[Analysis
of Proximity Data, 1997, B. S. Everitt and S. Rabe-Hesketh, Arnold, London.]
Strict stationarity: See stationarity.
415

Stripes plots: A simple but effective plot for visualizing the distance of each object for its closest and
second-closest cluster centroids after applying a
k-means cluster analysis
. For each cluster,
k ¼ 1; ...; K there is a rectangular area which is vertically divided into K smaller rectangles
and horizontal lines are plotted for the distances of each object to its own cluster and then for
the distances to the nearest other cluster. An example where the clusters are well separated is
show in Figure 134 and one where the clusters are not so well separated in Figure 135
[Computational Statistics and Data Analysis, 2006, 51, 526–544.]
Stri p-pl ot designs: A design sometimes used in agricultural field experiments in which the levels of
one factor are assigned to strips of plots running through the block in one direction. A
separate randomization is used in each block. The levels of the second factor are then applied
to strips of plots that are oriented perpendicularly to the strips for the first factor. [The Design
of Experiments, 1988, R. Mead, Cambridge University Press, Cambridge.]
Structural equation model: A statistical model where exogenous variables (explanatory varia-
bles) can potentially affect endogenous variables (response variables) both directly and
indirectly via intervening variables. There could also be feedback effects although this is
uncommon. A structural equation model for a vector of observed endogenous variables y
and a vector of observed exogenous variables x is usually specified as
y ¼ By þGx þ
Here B, which governs the relations among the endogenous variables, has zeros on the
diagonal and is of full rank. The regression parameter matrix G governs the regressions of
endogenous on exogenous variables and is a vector of random disturbances. The “reduced
form” of a structural equation model is obtained by solving for endogenous variables in
terms of exogenous variables to give
y¼ðI BÞ
1
Gx þðI BÞ
1
2
3
1
8
6
4
2
0
distance from centroid
Fig. 134 Stripes plot for data containing three well separated clusters.
416

where P ¼ðI BÞ
1
G gives the reduced form regression parameters.
Structural equation models with latent rather than observed variables are also of great
importance. In this case the model is composed of two submodels:
(1) a “structural model” specifying how different latent variables affect one another;
explicitly the submodel is
h ¼ Bh þ G þ
where now h is a vector of latent endogenous variables, is a vector of latent exogenous
variables and is again a vector of random disturbances.
(2) a “measurement model” specifying how the latent variables are measured by
observed variables or indicators x and y; explicitly this second submodel is
specified as
x ¼ L
x
x þ d
y ¼ L
y
h þ
i.e., two con firmatory
factor models
in which L
x
and L
y
are factor loading matrices and d
and vectors of unique factors. [Structural Equations with Latent Variables, 1989, K. A.
Bollen, Wiley, New York]
Structural nested model: A model for estimation of the causal effect of a time-dependent
exposure in the presence of
time-dependent covariates
that may simultaneously be con-
founders and intermediate variables. Causal effects are estimated using the
G-estimator
.
More complex but also more generally applicable approach than
marginal structural model
.
[Epidemiology, 1992, 3, 319–336.]
1
23
5
4
3
2
1
0
distance from centroid
Fig. 135 Stripes plot for data where the clusters are not so well separated.
417
Structural time series models: Regression models in which the explanatory variables are
functions of time, but with coefficients which change over time. Thus within a regression
framework a simple trend would be modelled in terms of a constant and time with a random
disturbance added on, i.e.
x
t
¼ α þ βt þ
t
; t ¼ 1; ...; T
This model suffers from the disadvantage that the trend is deterministic, which is too
restrictive in general so that flexibility is introduced by letting the coefficients α and β
evolve over time as
stochastic processes
. In this way the trend can adapt to underlying
changes. The simplest such model is for a situation in which the underlying level of the series
changes over time and is modelled by a
random walk
, on top of which is superimposed a
white noise
disturbance. Formally the proposed model can be written as
x
t
¼
t
þ
t
t
¼
t1
þ
t
for t ¼ 1; ...; T;
t
N ð0;
2
Þand
t
N ð0;
2
Þ. Such models can be used for
forecasting
and also for providing a description of the main features of the series. See also STAMP.
[Statistical Methods in Medical Research, 1996, 5,23–49.]
Structural zeros: Zero frequencies occurring in the cells of
contingency tables
which arise because
it is theoretically impossible for an observation to fall in the cell. For example, if male and
female students are asked about health problems that cause them concern, then the cell
corresponding to say menstrual problems for men will have a zero entry. See also sampling
zeros.[The Analysis of Contingency Tables, 2nd edition, 1992, B. S. Everitt, Chapman and
Hall/CRC Press, London.]
Stua rt, Ala n ( 1922^1 998): After graduating from the London School of Economics (LSE), Stuart
began working there as a junior research officer in 1949. He spent most of his academic
career at the LSE, working in particular on nonparametric tests and sample survey theory.
Stuart is probably best remembered for his collaboration with
Maurice Kendall
on the
Advanced Theory of Statistics.
Stuart^Maxwell test: A test of
marginal homogeneity
in a
square contingency table
. The test
statistic is given by
X
2
¼ d
0
V
1
d
where d is a column vector of any r–1 differences of corresponding row and column marginal
totals with r being the number of rows and columns in the table. The (r–1)×(r–1) matrix V
contains variances and covariances of these differences, i.e.
v
ii
¼ n
i:
þ n
:j
2n
ij
v
ij
¼ðn
ij
þ n
ji
Þ
where n
ij
are the observed frequencies in the table and n
i.
and n
.j
are marginal totals. If the
hypothesis of marginal homogeneity is true then X
2
has a
chi-squared distribution
with r-1
degrees of freedom. [SMR Chapter 10.]
Studentization: The removal of a
nuisance parameter
by constructing a statistic whose
sampling
distribution
does not depend on that parameter.
Studentizedrange statistic: A statistic that occurs most often in
multiple comparison tests
.Itis
defined as
418