Dunn Colin E. Biogeochemistry in Mineral Exploration
Подождите немного. Документ загружается.

Results of the Athabasca survey showed that within an area of 10,000 km
2
all
trees sampled yiel ded concentrations of at least 10 ppm U. Inside this vast area, the
50 ppm U contour encompassed 3000 km
2
, and the 100 ppm contour extended over
an area of 1000 km
2
, reaching a maximum concentration of 2270 ppm U at Rabbit
Lake (Dunn, 1982). In hindsight, this unique occurrence of a massive biogeochemical
uranium province near the eastern margin of the Athabasca Sandstone could have
been identified by sampling just 1 tree per 1000 km
2
. There is further discussion of
this U anomaly in Chapter 11.
The extraordinary size of the Wollaston U anomaly appears to be rare, although a
regional Mo ‘province’ approaching this size has been identified in Russia (Kovalevsky,
pers. comm., 1983). Subsequently, a large Mo anomaly defined by lodgepole pine bark
(Pinus contorta) has been established around the Endako molybdenum mine in central
British Columbia. The contour of 20 ppm Mo in bark ash (approximately ten times
background) extends for over 5000 km
2
(Dunn, 1999). In the Endako area, although
dust from the mining operations contributes to the high levels encountered, historical
records indicate similar levels in plants collected from the mine site in the 1960s during
the early days of mining operations (Warren et al., 1953; Warren and Delavault, 1965;
Warren, pers. comm., ca. 1988).
In addition to identifying major geochemical provinces, low-density surveys can be
undertaken to outline large geochemical systems and significant mineral ‘camps’. As
part of a regional survey of about 20,000 km
2
of Nova Scotia, focussing primarily on
balsam fir (Abies balsamea), at every fifth fir sample site the outer bark from red
spruce (Picea rubens) was collected at a sample density of just 1 tree per 50 km
2
within
a 5000 km
2
area of eastern Nova Scotia (Dunn, 1989). For this survey, the network of
roads and forestry trails was used for gaining access, and the trees sampled were each
at least 50 m from any roadside or other sign of disturbance. From simply plotting
multiples of the median values of the element concentrations, the distribution patterns
of Au, As, Sb and Se each outlined the main gold camps (Fig. 5-1) of which the north-
easterly trend from Goldenville to Forest Hill was the most notable.
Additional examples of low-density biogeochemical surveys in Canada include
publications from Man itoba (Fedikow et al., 1997a,b, 1998, 1999, 2000, 2002), in
central British Columbia (Dunn et al., 1994c, 1996b; Dunn and Hastings, 1998, 1999,
2000), in Newfoundland (Dunn et al., 1995b) and in Alberta (Seneshen et al., 2005).
In Australia, Cohen et al. (1998, 1999) conducted two reconnaissance surveys that
included the analysis of foliage from several common plant species. The larger of
these surveys encompassed 14,000 km
2
of north-east ern New South Wales and, since
it included a comparison with stream sediments, sample sites were close to streams
(Cohen et al., 1999). Among their conclusions, they found that genera capable of
accumulating high concentrations of trace elements in the vicinity of mineralization
included Co and REE in Eucalyptus,AsinCallistemon (bottle brush) and Au in
Casuarina (River She-oak).
This last-mentioned survey brings up another point for consideration – the pre-
ferred topographic location of sample stations. In some areas, there is sufficient
132
Survey Design and Comparisons with Other Sample Media
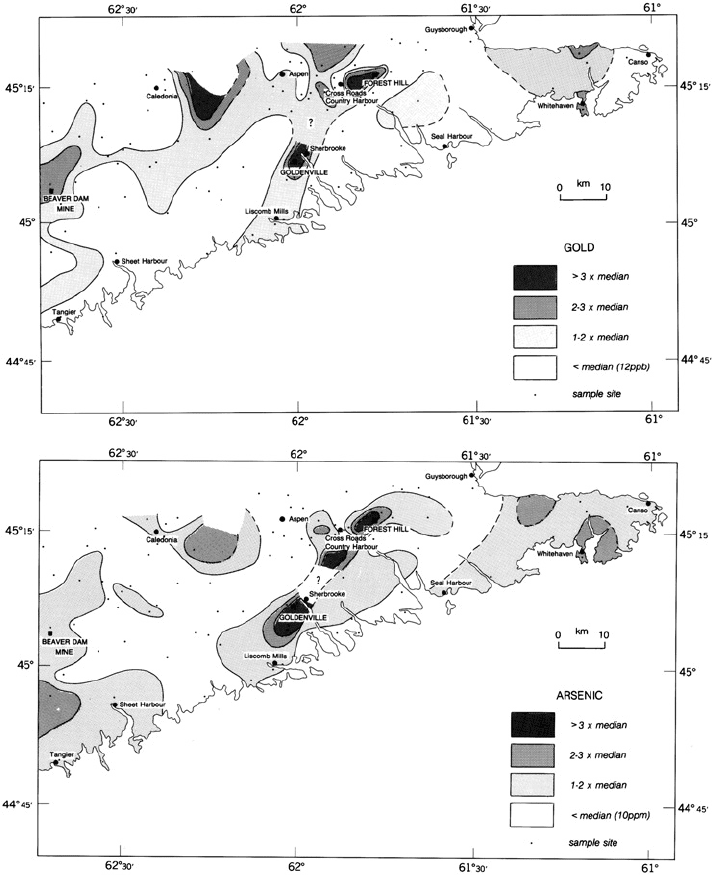
Fig. 5-1. Low-density reconnaissance survey (1 per 50 km
2
over approximately 5000 km
2
)of
eastern Nova Scotia, Canada, showing concentrations of Au and As in ash of red spruce outer
bark (Picea rubens). Similar patterns were shown by Sb and Se (Dunn, 1989). Analysis by
INAA.
133Biogeochemistry in Mineral Exploration
density of streams to permit sample collection from near the base of a slope draining
into a stream valley. In areas with moderately thick surficial cover, it is better to
collect at this break in slope rather than from valley floors, be cause in the stream’s
floodplain plants are likely to be rooted in exotic detritus brought down by streams in
times of high water flow. Consequently, the biogeochemical signature of samples
from a floodplain may provide a subtle signature that reflects an allochthonous
component of material rather than the preferred signature of a nearby source that is
more likely to be obtained from a break-in-slope sample location.
Moderate density (1 site per 1– 10 km
2
)
In the previous section, reference was made to 20,000 km
2
covered by regional
biogeochemical surveys in Nova Scotia. Surveys were conducted in early summer on
five occasions betw een 1987 and 1995 at a sample density of approximately 1 site per
8km
2
using balsam fir twigs (Abies balsamea), because this proved to be the most
ubiquitous tree (e.g., Dunn et al., 1989, 1992a,b, 1994a,b, 1996a,b; Dunn and Balma,
1997). At most of the fir sample sites, there were also spruce present (red spruce and/
or black spruce) and so outer bark of spruce was collected at the same time and
additional datasets were published for comparison (Dunn et al., 1992a,b). At that
time, the optimal analytical procedures involved reduction of tissues to ash by con-
trolled ignition to 475
o
C with analysis by INAA, and by ICP-ES (aqua regia di-
gestion) for those elements not readily determined by INAA.
The Nova Scotia regional biogeochemical surveys generated exploration data that
defined known and previously unknown areas of metal enrichments. As an example
of the signatures obtained, Fig. 5-2 shows U and W in balsam fir twigs (concen-
trations in ash) from a survey of the south-western part of the Province conducted in
the spring of 1991 (Dunn et al., 1994a). The area of anomalous concentrations
encompasses the East Kemptville tin/tungsten mine that was in production from
1985 to 1992, and several satellite zones of mineralization that were not exploited.
Other elements in the fir twigs that exhibited similar patterns of enrichments included
As, Be, Cs, Li, Rb, Sn and Ta. Although some of this signature was probably related
to airborne dust it was noteworthy that other sites, remote from known mineral-
ization, yielded some anomalous values of similar magnitude.
The fastest way to establish biogeochemical patterns over large tracts of land is by
helicopter. Although the cost of helicopter rental is high, the speed of collecting
samples is sufficiently rapid that the over all economics are favourable. At the time of
writing, the entire cost per sample to run a survey in remote areas of Canada is
around US$120. This is about two-thirds to three-quarters the cost of a regional
helicopter-supported lake sediment or stream sediment survey, and includes all
components of a survey from planning, collection, analysis to a final report . Sample
densities are typically in the range of 1 site per square kilometre to 1 per 4 km
2
.
Examples of results from helicopter-borne surveys are given in Chapter 11.
134
Survey Design and Comparisons with Other Sample Media
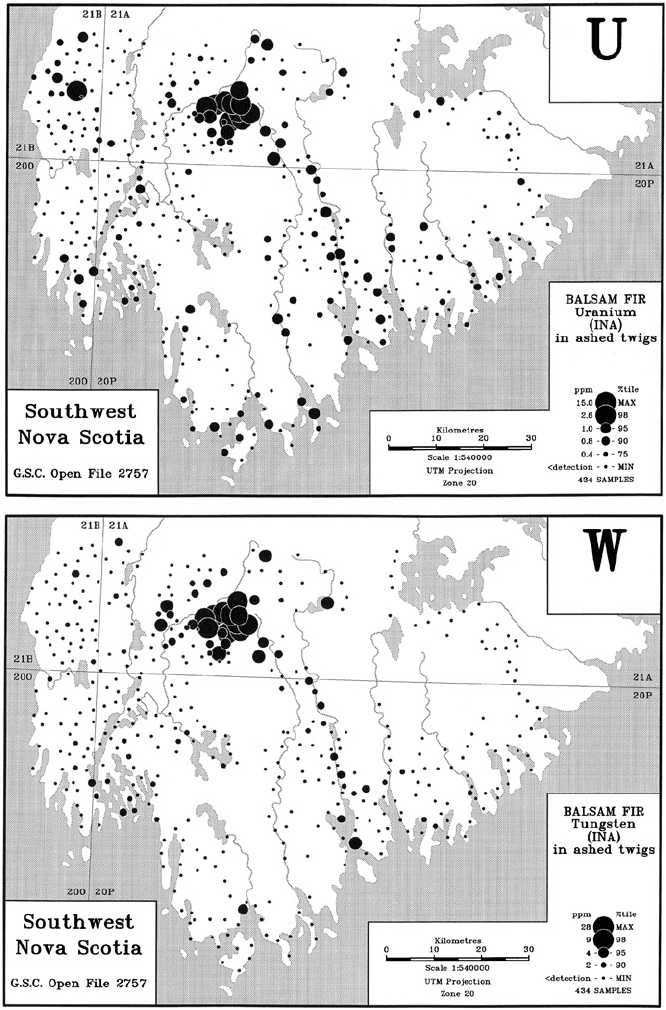
Fig. 5-2. Regional survey of south-western Nova Scotia, Canada, using twigs of balsam fir
(Abies balsamea). Uranium and tungsten shown as ppm in ash, determined by INAA. Location
of disused East Kemptville Sn/W mine centred in area of anomalous metal enrichments (Dunn
et al., 1994a).
135Biogeochemistry in Mineral Exploration
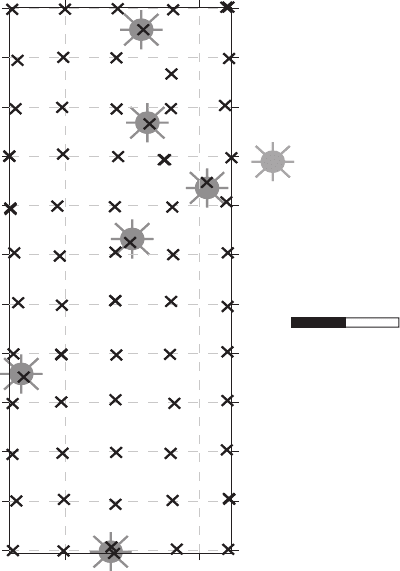
A survey designed to locate kimberlites beneath a Quaternary cover in central
Alberta involved the collection of white spruce (Picea glauca) tops at a sample
spacing of 2 km (i.e., 1 site per 4 km
2
). An added component to this study was the
collection of an additional five samples over known kimberlites, in order to establish
their biogeochemical signatures (Seneshen et al., 2005 ). The resulting sample grid
pattern and the locations of the principal kimberlites known at the time of the survey
are shown in Fig. 5-3.
In retrospect, the basic sample spacing of 2 km proved too coarse for clearly
defining the locations of kimberlites, and 1-km spacing would have been preferable.
Some results of this survey are discussed in Chapter 11.
Semi-detailed surveys (1 site per 0.25– 1 km
2
)
Surveys at this scale can be undertaken by helicopter in difficult terrain, or ground
traverses – either on foot, by truck or four-wheel drive vehicles in open arid terrain,
SAMPLE SITES
White Spruce
Top Stems
metres
K14
K7
K6
K5
TQ155
Kimberlite:
[5 additional
samples over
each known
kimberlite]
0 2000 4000
K4
Fig. 5-3. Sample pattern established for collection of tree tops (2 km grid) to assist in locating
concealed kimberlites in central Alberta (Seneshen et al., 2005).
136 Survey Design and Comparisons with Other Sample Media
by all-terrain vehicles (‘quads’) on rough forest trails, or by snow-mobiles along trails
during the long cold winter months of the northern continental masses. Biogeo-
chemical sampling may be the only feasible geoch emical sampling method in north-
ern climates during the half of the year that experiences snow-co vered terrain and
frozen ground.
In the rugged Cordillera del Co
´
ndor region of the western Amazon, close to the
border between Peru and Ecuador, a survey programme included the collection of
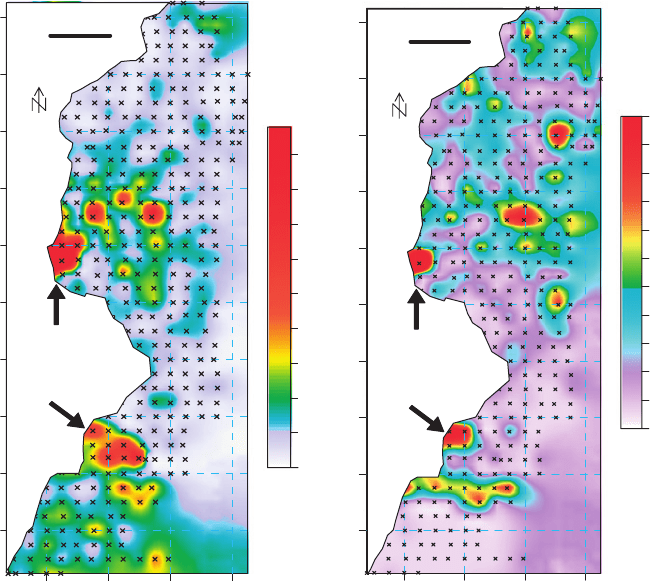
foliage from 366 tree ferns (Chonta con Espinas – Cyathea spp.) on an even grid of
sample stations spaced at intervals of 500 m (i.e., 1 site per 0.25 km
2
). Figure 5-4
shows plots of Au and As with the 98th percentile of the dataset selected as the
maximum for plotting, such that values above this value are all shown as the same
intensity of shading. The former artisanal Au workings at Chinapintza (epithermal
Au/Ag) are clearly evident, and a second area (Anomaly A) farther south also
shows a Au/As relationship. A strong mercury anomaly was associated with the
0
0.5
1
1.5
2
2.5
3
3.5
4
4.5
GOLD in Tree Fern Foliage
Cordillera del Condor
Au ppb
Max. 16.8
Ecuador
Peru
Chinapintza
Anomaly A
2 km
0
0.1
0.2
0.3
0.4
0.5
0.6
0.7
0.8
0.9
1
1.1
As ppm
Max. 2.9
ARSENIC in Tree Fern Foliage
Cordillera del Condor
Ecuador
Peru
Chinapintza
Anomaly A
2 km
Fig. 5-4. Western Amazon – Au and As in dry foliage of tree fern. Data courtesy of An-
gloGold-Ashanti. Determinations by ICP-MS on aqua regia digestion of dry tissues.
137Biogeochemistry in Mineral Exploration
Chinapintza Au, and Ag anomalies were peripheral to Anomaly A, indicating zoning
of the mineralization. Details of this survey are provided in Chapter 11.
In northern Saskatchewan the small but high-grade Rottenstone Ni-PGM deposit
was mined out between 1965 and 1968, but there are indications of additional de-
posits in the area. There is no all-weather road access and the heavily forested terrain
has a veneer of glacial deposits. It is cut by streams and rivers and is dotted with
many lakes such that geochemical surveys are difficult and very time-consuming to
undertake.
To provide a rapid and broad reconnaissance geochemical survey of a 130 km
2
area that had been staked by Uravan Minerals Inc., about 800 black spruce (Picea
mariana) tops were collected from a helicopter during a five-day period in September
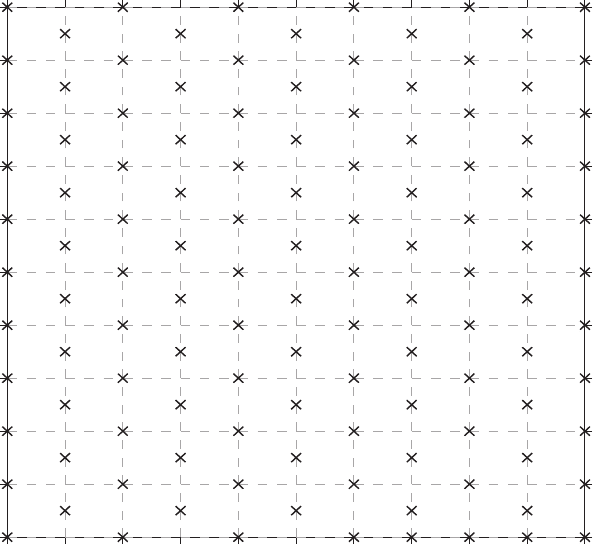
1999. Samples were collected at 500-m spacing, with alternating offset lines to pro-
vide minimum distance between sample points in accord with an idealized grid shown
in Fig. 5-5.
In practice, this sampling pattern was easy to achieve, and digressions from the
designated sample locations were mostly only a few metres in order to locate an
appropriate tree or to avoid a lake. Many of the larger lakes had islands on which
0 500 1000 1500 2000 2500 3000 3500 4000 4500 5000
0
500
1000
1500
2000
2500
3000
3500
4000
4500
5000
1
2
3
4
5
6
7
8
9
10
11
12
13
14
15
16
17
18
19
20
21
22
23
24
25
26
27
28
29
30
31
32
33
34
35
36
37
38
39
40
41
42
43
44
45
46
47
48
49
50
51
52
53
54
55
56
57
58
59
60
61
62
63
64
65
66
67
68
69
70
71
72
73
74
75
76
77
78
79
80
81
82
83
84
85
86
87
88
89
90
91
92
93
94
95
96
97
98
99
100
101
102
103
104
105
106
107
10
8
10
9
11
0
111
11
2
11
3
11
4
11
5
11
6
11
7
11
8
Fig. 5-5. Idealized offset grid sampling pattern to provide minimum distances between sam-
ple points.
138 Survey Design and Comparisons with Other Sample Media
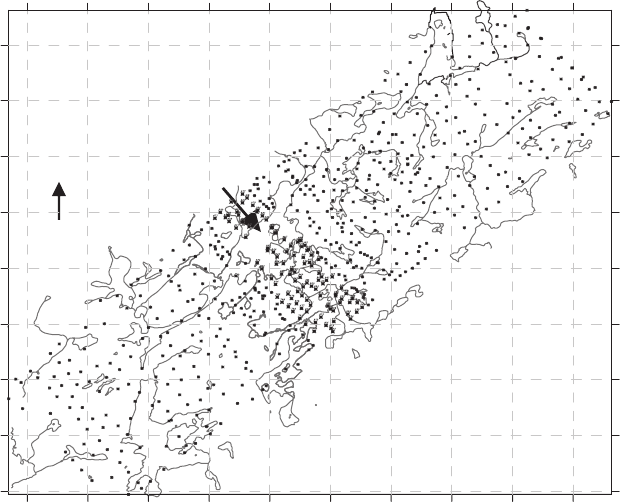
trees were available for sampling, and the extensive drainage network required that
sample sites only be shifted a short distance from the desired grid. The sample
interval was reduced to 250 m over a 48 km
2
area of primary interest around Rot-
tenstone Lake that is outlined in the centre of Fig. 5-6. The results of this survey are
discussed in Chapter 11.
Detailed surveys (25– 200 m spacing)
In desert areas, such as the south-western United States, detailed surveys using
widespread species (e.g., sagebrush [Artemisia tridentata]) can be undertaken by
sampling on a predetermined grid pa ttern. However, surveys in the dense temperate
and boreal fores ts of North America and the densely vegetated tropical areas of the
world are often controlled by logistics – access by road, foot, boat, float-plane or
helicopter. In these areas, a sample spacing of about 200 m has proven effective and
feasible, even though sampling on a regular grid pattern may be precluded by the
presence of streams, bogs, or perhaps the absence of the desired species. In Pre-
cambrian Shield terrain of many parts of the world there is commonly a preferred
Kenyon
Taylor C
r.
Lake
Rottenstone
Lake
502000
504000 506000 508000 510000 512000 514000 516000 518000
520000
6236000
6238000
6240000
6242000
6244000
6246000
6248000
6250000
6252000
Albert
Lake
Fig. 5-6. Sample pattern achieved for the collection of black spruce tops around Rottenstone
Lake, Saskatchewan.
139Biogeochemistry in Mineral Exploration
trend to metamorphic grade and to structure, such that an effective compromise is to
sample across strike at 200 m intervals along lines spaced 1 km apart. Extensive
surveys at this sample spacing in northern Saskatc hewan have used bark of black
spruce (Picea mariana) and twigs of mountain alder (Alnus crispa). Among several
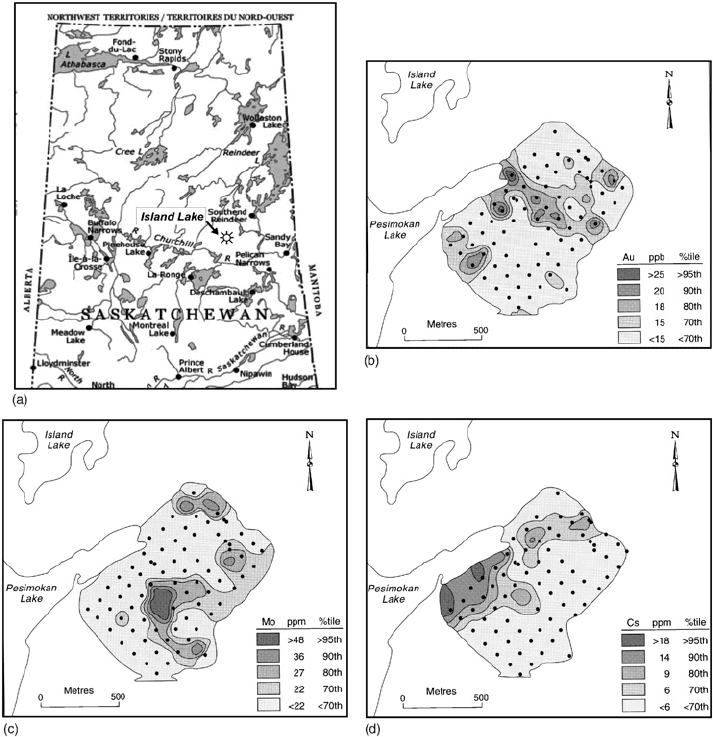
zones of anomalous Au concentrations that wer e identified, one was in an area
dominated by alder, and follow up work using alder at closer sample spacing (mostly
a 100 m 100 m grid) identified the spatial relationship among Au, Mo and Cs
(Fig. 5-7) in alder twig ash (most recent three years of growth). These three elements
Fig. 5-7. Metals in ashed twigs of alder (Alnus crispa) – ash yield approximately 2%: (a)
Location of survey area, (b) Gold, (c) Molybdenum and (d) Cesium. La Ronge gold belt of
northern Saskatchewan, Canada (Dunn et al., 1990). Analysis by INAA.
140 Survey Design and Comparisons with Other Sample Media

in plant tissues quite commonly exhibit a spatial relationship to gold mineralization.
Subsequent drilling intersected gold mineralization, but to date only sub-economic
grades have been found.
In an area with known or suspected mineralization, a simple orientation survey
can be co nducted to determine if a biogeochemical response is obtained in common
plants. A single line is inadvisable, since the validity of any anomaly that arises may
be doubtful. By sampling along two lines oriented normal to the presumed strike of
mineralization, a positive signature on both lines would provide an indication of the
strike of the mineralized body. It is an expeditious procedure to collect along one
line going away from a base camp and a second returning to it. If time permits,
of course, greater substantiation of anomalous trends can be obtained from a
four-line sampling program. Figure 5-8 shows examples of iodine anomalies in cedar
foliage (western redcedar) along two lines that traversed a suspected zone of breccia-
hosted Cu porphyry at the Boundary Zone, Mount Polley, in central British
Columbia. The trend of the mineralization can be determined from the locations of
the anomalies.
From these profi les, a sketch map could be plotted outlining the predicted lo-
cation and trend of mineralization (Fig. 5-9 ).
The plot shown in Fig. 5-9 shows sample spacing at 100 m, closing down to 50 m
then 25 m over the zone of interest. Similarly, quartz-hosted vein-type gold may
require sample spacing at 50 m or as close as 25 m. To sample more closely than this
may be impractical or not possible because of the generally lower density of plant
distributions, although on occasion, according to local geological conditions, spacing
at 10 m may be warranted. In a situation where a narrow quartz vein is known to have
irregularly spaced zones of mineralization along strike, sampling may be spaced at
100 m or 200 m along a vein. However, sampling normal to the strike of the vein may
be reduced locally to 10 m in order to delineate mineralization. Figure 5-10 shows an
idealized situation of an effective sampling pattern over a gold-bearing quartz vein. In
this situation sampling over the vein at 10 m intervals has provided a four-point
I ppm I ppm
0.000
0.002
0.004
0.006
0.008
0.010
0.012
0 500 1000 1500
Western Traverse
South North
Approx. Location of
mineralization
metres
0.000
0.002
0.004
0.006
0.008
0.010
0.012
0.014
0 500 1000 1500
Eastern traverse
South North
Approx. Location of
mineralization
metres
Fig. 5-8. Iodine in dry tissue of western redcedar (Thuja plicata) at the Boundary Zone,
Mount Polley, British Columbia. Analysis by HR-ICP-MS after a warm water leach (Dunn et
al., 2006a,b).
141Biogeochemistry in Mineral Exploration
