Duan C.G., Karelin V.Y. Abrasive Erosion and Corrosion of Hydraulic machinery
Подождите немного. Документ загружается.

324
Abrasive Erosion and Corrosion of Hydraulic Machinery
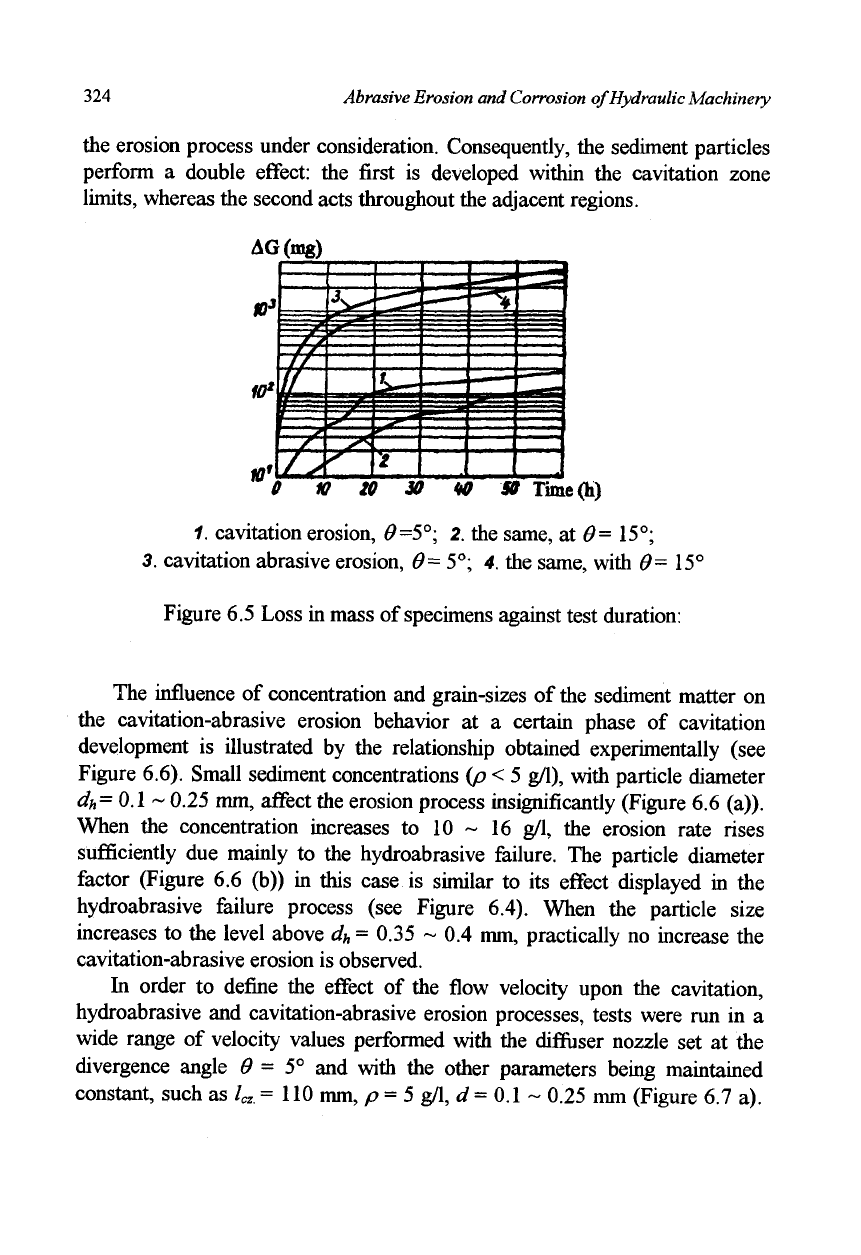
the erosion process under consideration. Consequently, the sediment particles
perform a double effect: the first is developed within the cavitation zone
limits,
whereas the second acts throughout the adjacent regions.
AG(mg)
1.
cavitation erosion, 0=5°; 2. the same, at 6= 15°;
3.
cavitation abrasive erosion, 6= 5°; 4. the same, with Q- 15°
Figure 6.5 Loss in mass of specimens against test duration:
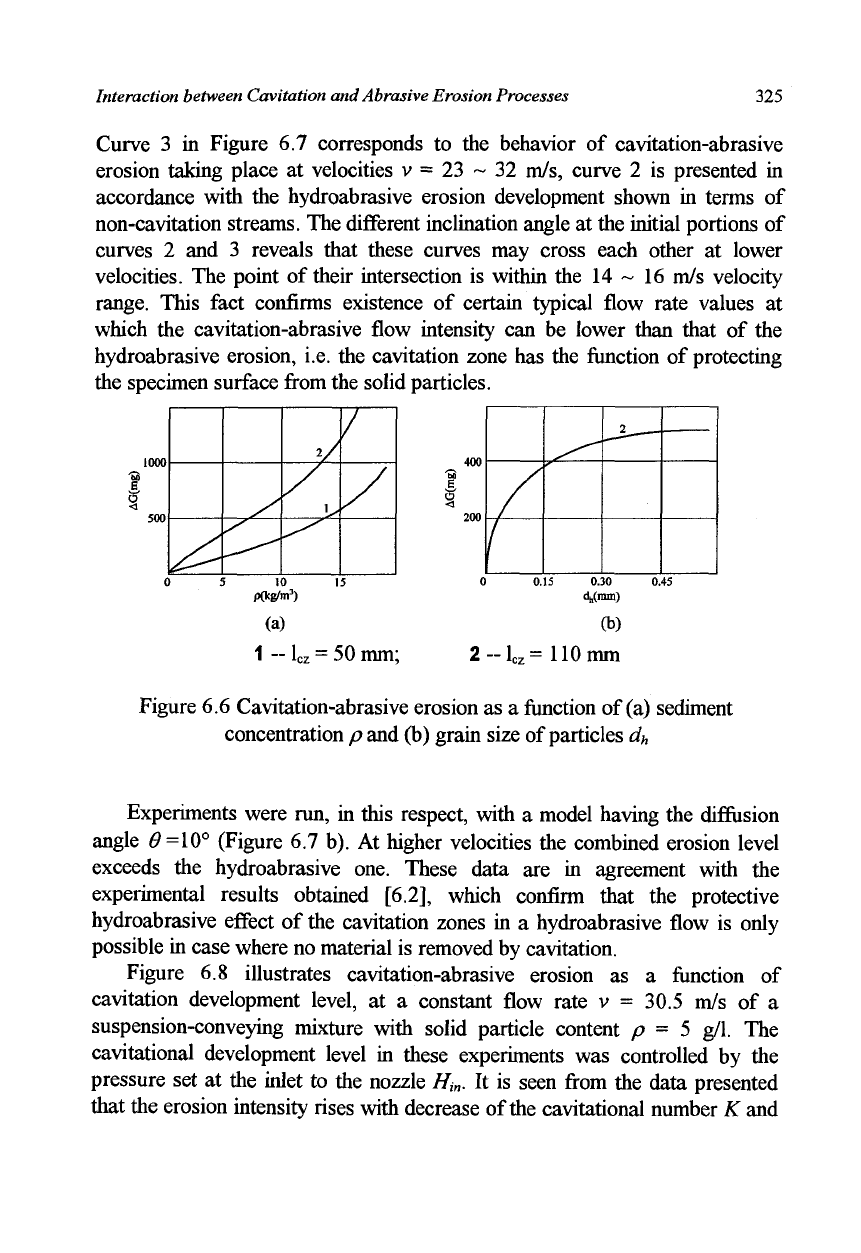
The influence of concentration and grain-sizes of the sediment matter on
the cavitation-abrasive erosion behavior at a certain phase of cavitation
development is illustrated by the relationship obtained experimentally (see
Figure 6.6). Small sediment concentrations (p
<
5 g/1), with particle diameter
d
h
= 0.1 ~ 0.25 mm, affect the erosion process insignificantly (Figure 6.6 (a)).
When the concentration increases to 10 ~ 16 g/1, the erosion rate rises
sufficiently due mainly to the hydroabrasive failure. The particle diameter
factor (Figure 6.6 (b)) in this case is similar to its effect displayed in the
hydroabrasive failure process (see Figure 6.4). When the particle size
increases to the level above d
h
= 0.35 ~ 0.4 mm, practically no increase the
cavitation-abrasive erosion is observed.
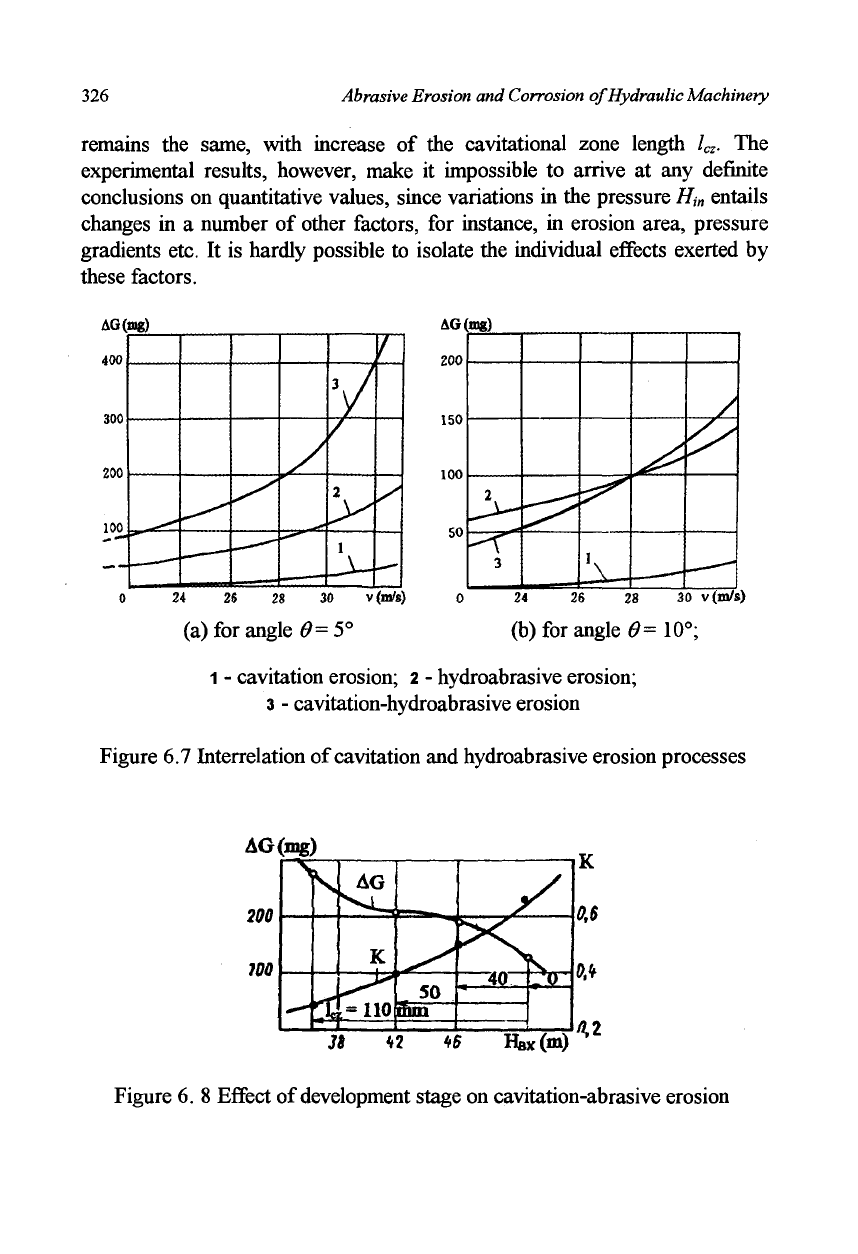
In order to define the effect of the flow velocity upon the cavitation,
hydroabrasive and cavitation-abrasive erosion processes, tests were run in a
wide range of velocity values performed with the diffuser nozzle set at the
divergence angle 0=5° and with the other parameters being maintained
constant, such as /
cz
. = 110 mm, p
=
5 g/1, d = 0.1 ~ 0.25 mm (Figure 6.7 a).
Interaction between Cavitation and Abrasive Erosion Processes
325
Curve 3 in Figure 6.7 corresponds to the behavior of cavitation-abrasive
erosion taking place at velocities v = 23 ~ 32 m/s, curve 2 is presented in
accordance with the hydroabrasive erosion development shown in terms of
non-cavitation streams. The different inclination angle at the initial portions of
curves 2 and 3 reveals that these curves may cross each other at lower
velocities. The point of their intersection is within the 14 ~ 16 m/s velocity
range. This fact confirms existence of certain typical flow rate values at
which the cavitation-abrasive flow intensity can be lower than that of the
hydroabrasive erosion, i.e. the cavitation zone has the function of protecting
the specimen surface from the solid particles.
2/
u
/
V
e
<5
2
5 10 15
P(kg/m
3
)
(a)
1
—
l
cz
= 50 mm;
0 0.15 0.30 0.45
dh(mm)
(b)
2-l
c
, = 110 mm
Figure 6.6 Cavitation-abrasive erosion as a function of (a) sediment
concentration p and (b) grain size of particles d
h
Experiments were run, in this respect, with a model having the diffusion
angle 0=10° (Figure 6.7 b). At higher velocities the combined erosion level
exceeds the hydroabrasive one. These data are in agreement with the
experimental results obtained
[6.2],
which confirm that the protective
hydroabrasive effect of the cavitation zones in a hydroabrasive flow is only
possible in case where no material is removed by cavitation.
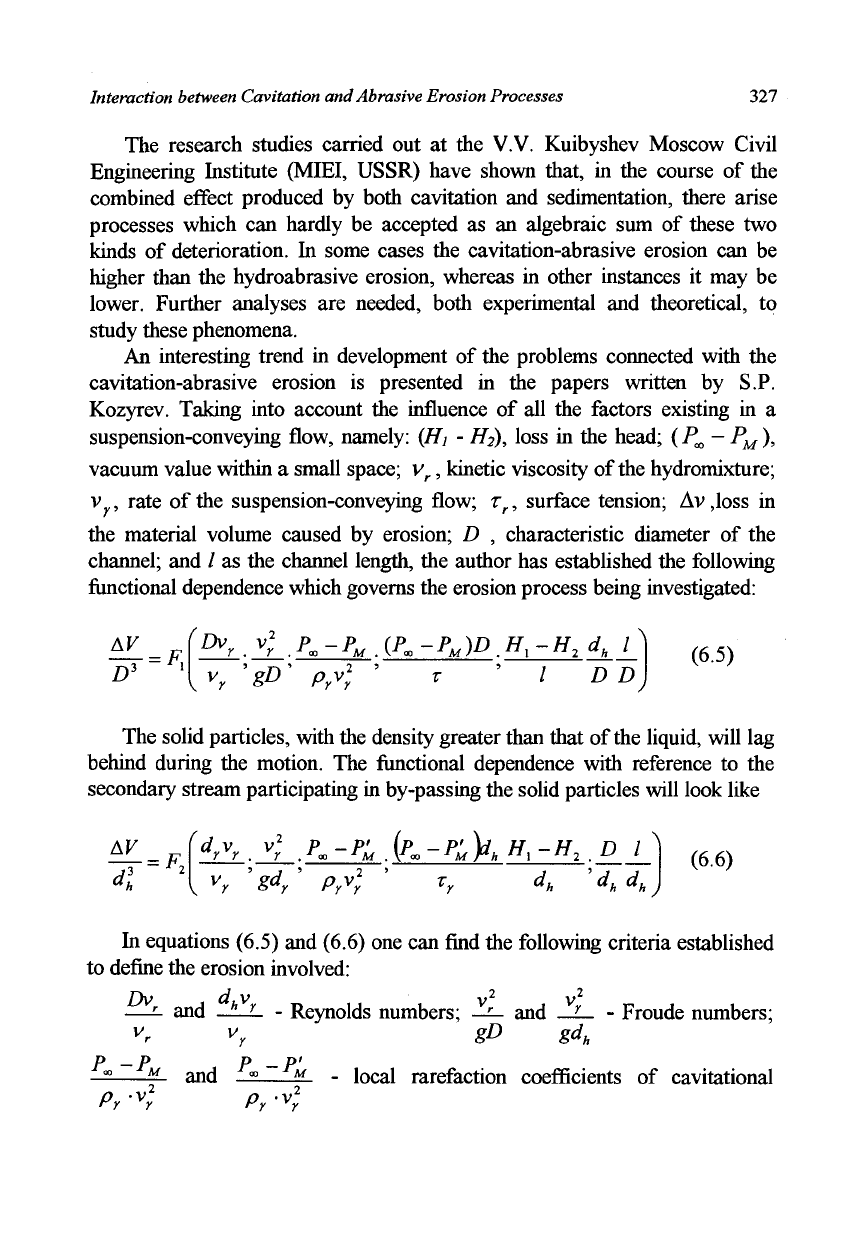
Figure 6.8 illustrates cavitation-abrasive erosion as a function of
cavitation development level, at a constant flow rate v = 30.5 m/s of a
suspension-conveying mixture with solid particle content p = 5 g/1. The
cavitational development level in these experiments was controlled by the
pressure set at the inlet to the nozzle H
in
. It is seen from the data presented
that the erosion intensity rises with decrease of the cavitational number K and
326
Abrasive Erosion and Corrosion of Hydraulic Machinery
remains the same, with increase of the cavitational zone length l
cz
. The
experimental results, however, make it impossible to arrive at any definite
conclusions on quantitative values, since variations in the pressure H
in
entails
changes in a number of other factors, for instance, in erosion area, pressure
gradients etc. It is hardly possible to isolate the individual effects exerted by
these factors.
AG(mg)
3 /
2
1
/
AG(mg)
200
150
100
50
2
-<*
3
I
24 26 28 30 v(m/e)
(a) for angle 9= 5°
24
26
28
30 v(m/s)
(b) for angle 6= 10°;
1 - cavitation erosion;
2
- hydroabrasive erosion;
3 - cavitation-hydroabrasive erosion
Figure 6.7 Interrelation of cavitation and hydroabrasive erosion processes
AG(mg)
38 « 45 Hax(m)
Figure 6. 8 Effect of development stage on cavitation-abrasive erosion
Interaction between Cavitation and Abrasive Erosion Processes
327
The research studies carried out at the V.V. Kuibyshev Moscow Civil
Engineering Institute (MIEI, USSR) have shown that, in the course of the
combined effect produced by both cavitation and sedimentation, there arise
processes which can hardly be accepted as an algebraic sum of these two
kinds of deterioration. In some cases the cavitation-abrasive erosion can be
higher than the hydroabrasive erosion, whereas in other instances it may be
lower. Further analyses are needed, both experimental and theoretical, to
study these phenomena.
An interesting trend in development of the problems connected with the
cavitation-abrasive erosion is presented in the papers written by S.P.
Kozyrev. Taking into account the influence of all the factors existing in a
suspension-conveying flow, namely: (Hj - H
2
), loss in the head; (P^ - P
M
),
vacuum value within a small space; v
r
, kinetic viscosity of the hydromixture;
v , rate of the suspension-conveying flow; r
r
, surface tension; Av,loss in
the material volume caused by erosion; D , characteristic diameter of the
channel; and / as the channel length, the author has established the following
functional dependence which governs the erosion process being investigated:
D
3
'
fDv
r.
v
r .P
x>
-P
M
.{P
X
-P
U
)DH
X
-H
2
d
h
l)
(65)
v
r
'gD'
p
r
v
2
r
' T ' / DD
The solid particles, with the density greater than that of the liquid, will lag
behind during the motion. The functional dependence with reference to the
secondary stream participating in by-passing the solid particles will look like
dl "
2
(
d
r
v
r
.
v
r
.
^ -PL . fe, ~K K ", ~H
2
. D l)
v
r
''
gd
r
' P
r
v
2
r
' r
r
d
h
X d,
(6.6)
In equations (6.5) and (6.6) one can find the following criteria established
to define the erosion involved:
—
r
- and -h-L. - Reynolds numbers; —
r
— and
Y
- Froude numbers;
K v
r
gD gd
h
p -P
1
oo
•*
M
Pr -
v
r
and
P~-
Pr
-PL
-r
local rarefaction coefficients of cavitational
328
Abrasive Erosion and Corrosion of Hydraulic Machinery
numbers, A" at P
M
=-P'
m
=
P
a
cavitation appears respectively on the
component surface and behind a solid particle); D^P
x
- P
M
)r~
x
- parameter
characterizing the rupture strength of the liquid; d
y
(P
B
-P
M
)T~
X
- parameter
characterizing the liquid strength at the moment of its separation from a
particle; (//,
-//
2
)/
_1
- hydraulic gradient or loss in the head within the region
under review; (#,
-H
2
)d~
h
x
-resistance, while a particle is flown around;
d
h
D~
l
and Dd^ - simplexes characterizing degree in lateral freedom of a
particle;
ID~
X
- geometric coefficient of a unit width area being worn; ld^ -
geometric coefficient taking into account the particle-to-surface mechanism of
the contact.
Although the mechanism of the influence produced by all these criteria on
the erosion process is not yet known in its summarized form, the indicated
criteria are most vital for a correct arrangement of researches to be promoted.
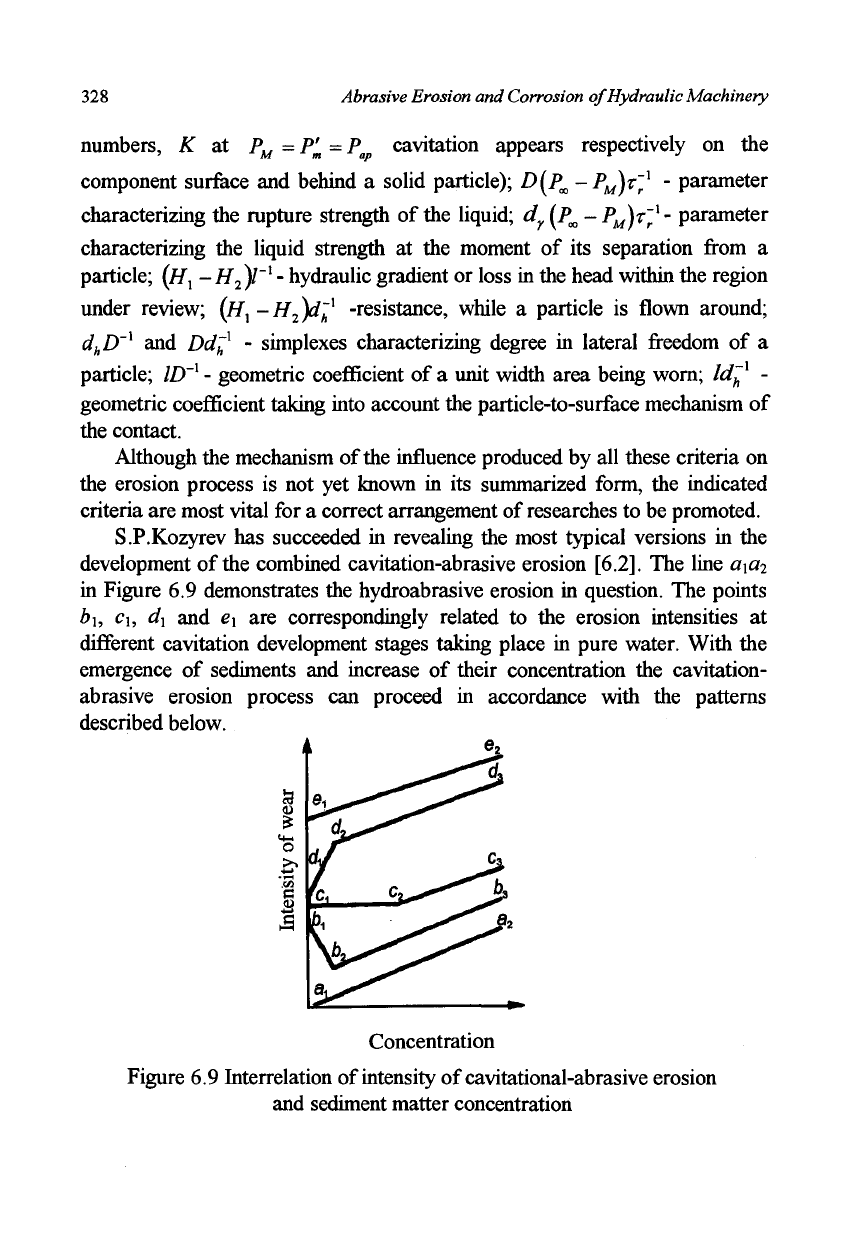
S.P.Kozyrev has succeeded in revealing the most typical versions in the
development of the combined cavitation-abrasive erosion
[6.2].
The line a\a
2
in Figure 6.9 demonstrates the hydroabrasive erosion in question. The points
b\, c\, d] and e\ are correspondingly related to the erosion intensities at
different cavitation development stages taking place in pure water. With the
emergence of sediments and increase of their concentration the cavitation-
abrasive erosion process can proceed in accordance with the patterns
described below.
Concentration
Figure 6.9 Interrelation of intensity of cavitational-abrasive erosion
and sediment matter concentration
Interaction between Cavitation and Abrasive Erosion Processes
329
The erosion rate reduces within the region b\b
2
as the sediment
concentration is raised. This can be attributed to the fact that the cavitation
erosion, provided it develops with a durable "incubation" period, starts with
formation of microcracks in the surface layer of
the
metal, which propagates
further into the metal depth, resulting in chipping out relatively large volumes
of metal. During the hydroabrasive erosion one can observe, however, the
formation of a thin metal "copolishing" layer, which serves to protect the
surface from cavitation cracks and indentations.
A decrease in erosion may take place while cavitation erosion rate is
somewhat greater than that of abrasive erosion. The moment the abrasive
erosion rate starts to exceed that of cavitation erosion, due to increase in
concentration of the suspended matter, there appears a rise of general failure
intensity in the region
b
2
b-$.
Here the abrasive erosion acts ahead of the
cavitational erosion and thereby as though suppresses the latter.
The line c\c
2
characterizes the erosion taking place in the events the
cavitation erosion rate significantly surpasses the rate of the hydroabrasive
erosion. In this rage of fluctuation, the intensity of the sediments is
insufficient to alter the course of the cavitation erosion. It is only later, as the
sediment content proceeds to rise, that the hydroabrasive erosion starts to be
superimposed on the cavitation erosion process and, consequently, to increase
the combined erosion level (region c
2
c
3
).
The line
d
{
d
2
d3
specifies the terms in which the cavitation erosion intensity
is very great and the metals being worn out are of high plasticity (copper,
aluminum, lead etc.). In this case the metal surface affected by cavitation is
covered at random by material squeezed out.
The presence of sediments in the water serves to remove the metal chips,
thus causing a sharp rise of the erosion process (line
d\d
2
).
With the further
increase of the sediment concentration this effect will become weaker (line
d
2
d
i
).
The line e\e
2
corresponds to the highest intensity of the cavitation erosion.
The presence of the suspended sediments results only in superimposing the
hydroabrasive erosion over the cavitation erosion.
Within the operating components of pumps the cavitation erosion
proceeds, as a rule, with a fairly long incubation period; even with the
sediment content in the water equaling 0.1 ~ 0.5%, the hydroabrasive erosion
starts to prevail over the cavitation erosion. Therefore, the pump components,
which have been subjected to cavitation abrasive erosion, are identified
330
Abrasive Erosion and Corrosion of Hydraulic Machinery
mainly by smooth worn-out regions, i.e. the regions with hydroabrasive
erosion only. But on the operating pump components there are also other
areas where cavitation erosion takes the lead over hydroabrasive erosion.
Then the surface under study develops, as a result of cavitation, a sponge-like
structure.
6.2. Effect of Cavitation on Hydroabrasive Erosion
The cavitation phenomena influence on the nature of hydroabrasive erosion,
within the flow-passages of hydraulic machines, will further be considered
with reference to a research study carried out with centrifugal pumps
operating in laboratory conditions.
The analyses accomplished with the use of the simplest equipment, such
as a Venturi nozzle, have demonstrated a complicated dependence of the
cavitation-abrasive erosion process on the hydrodynamic features of the flow
under review, the surface shape of the components as well as the quantity and
composition of the sediments. Although the results available give a general
idea about the basic mechanism of the material failure effected by the
combined action of both the abrasive particles and cavitation, they do not
provide, for the time being, definite conclusions concerning any specific
qualitative recommendations.
It is most probable that things may become even more difficult in an
attempt to establish feasible combinations of hydroabrasive and cavitation
erosion processes taking place in such complicated hydraulic systems as in
pumps. The first experiments in this direction were carried out in the V.V.
Kuibyshev MIEI [6.5, 6.6]. The results obtained have revealed that the
cavitation development level evaluated by, for instance, the size of cavitation
margin, affects significantly the erosion of pumps operating with water which
includes abrasive erosion particles.
To test centrifugal pumps, an experimental jig was used (see Figure 6.1).
The pressure at the inlet to a pump (and, hence, the cavitational margin Ah)
was controlled with a latch fixed in the suction pipe of
the
pump. The content
of
the
sediment matter contained in the water varied for different experiments
in the range of 2 to 16 g/1 (e = 0.13 ~
1.02%).
The particle grain sizes were
within 0.1 ~ 0.25 mm. The experiments were carried out at six different
delivery modes of the pump model 4K-8, ranging from 0.54
Q
opt
to 1.25
Q
opt
,
Interaction between Cavitation and Abrasive Erosion Processes 331
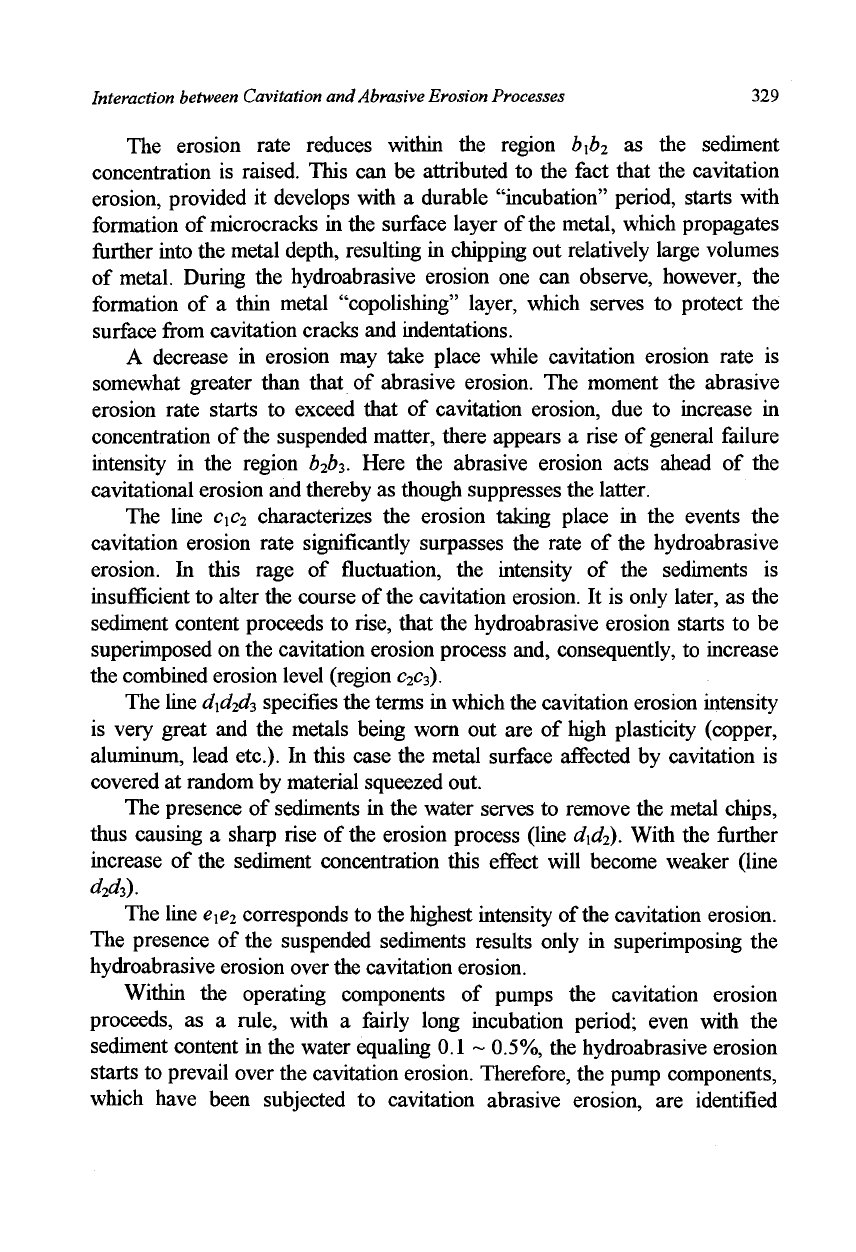
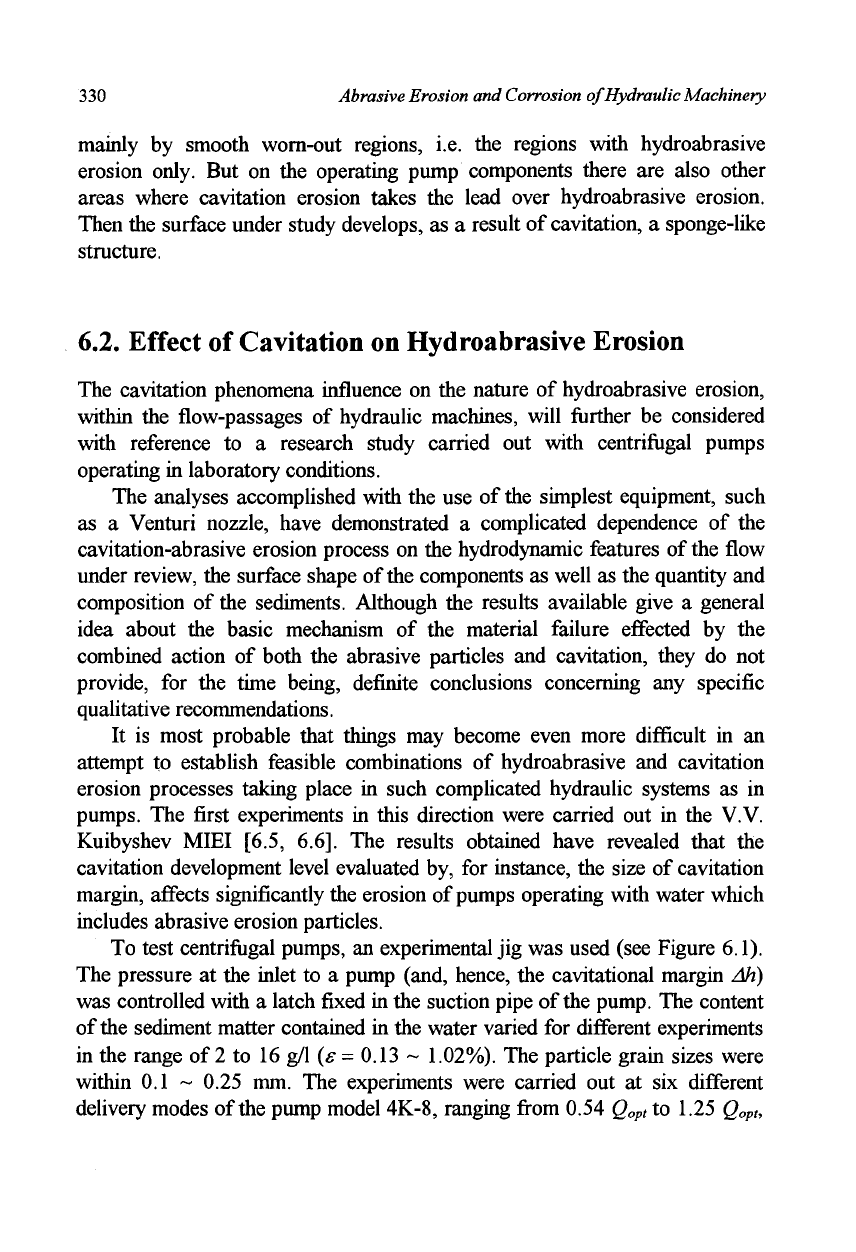
with various values of Ah (see Figure 6.10). At first the chipping-off
cavitational pump characteristics were obtained with the pure water delivered
at a constant flow Q. Then a certain amount of abrasive material was added
to the jig tank and the experiments were continued with a certain number of
typical values, from non-cavitation to chipping-off patterns. After each
measured point a number of experimental points were "scanned" (normally
from 9 to 12). The intervals between Ah values were made shorter when
dealing with well-developed cavitation modes. In the normal pump operation
range such intervals are of no significance since
Ah
values in this range do not
affect energy parameters. The experiment for every Ah value lasted 4 hours.
The erosion was evaluated according to the loss in mass AG of two test-check
silumin blades of an experimental impeller.
" p 5 10 15
2D
x
25 Q (1/s)
0 20 tO SO SO /MQ(m
3
/h)
dashed line - specification provided by manufacturer
solid line - specification obtained by test
Figure 6.10 Specification of experimental centrifugal pump 4K-8
The results of
these
experiments, carried out at different pump discharge
and with various concentrations of sediment are presented in Figures 6.11 ~
6.13.
The corresponding chipping-off cavitational characteristics of pumps
332
Abrasive Erosion and Corrosion of Hydraulic Machinery
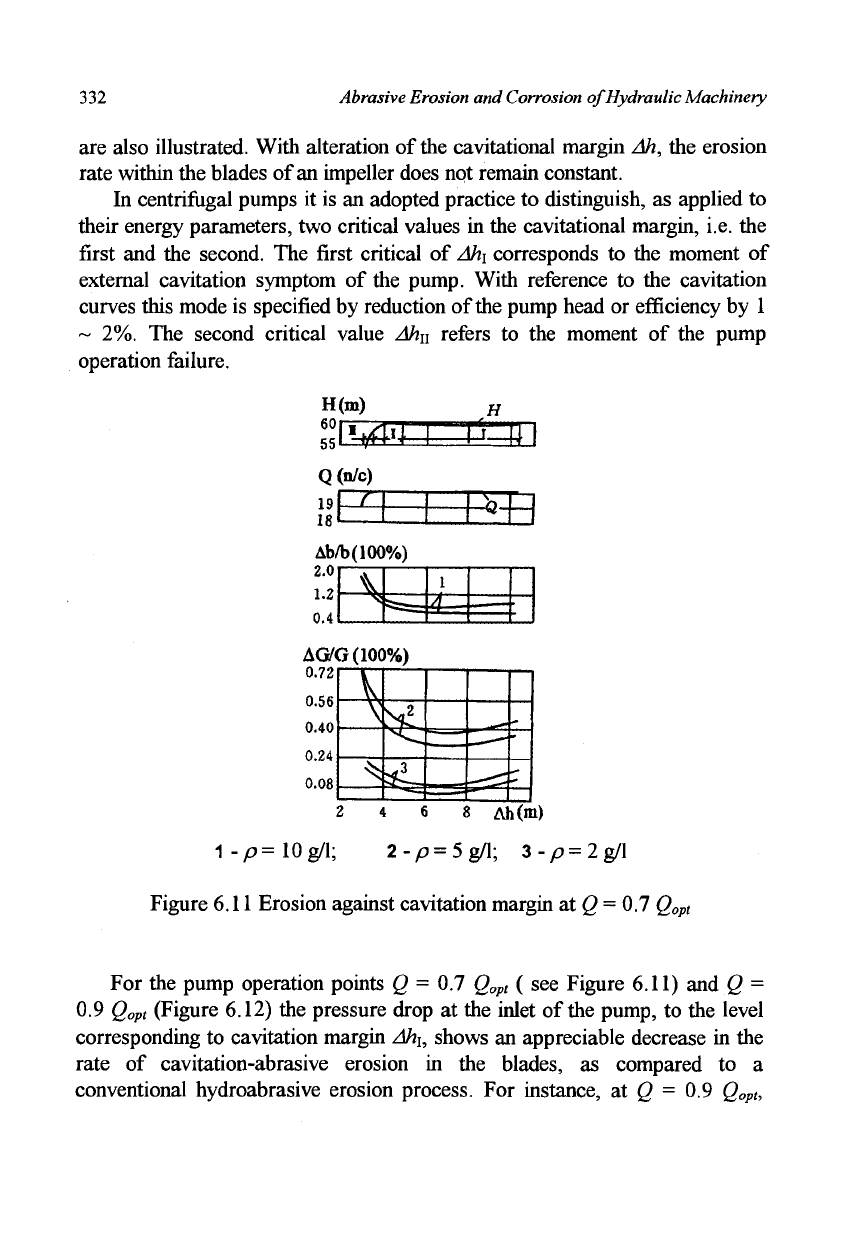
are also illustrated. With alteration of the cavitational margin Ah, the erosion
rate within the blades of an impeller does not remain constant.
In centrifugal pumps it is an adopted practice to distinguish, as applied to
their energy parameters, two critical values in the cavitational margin, i.e. the
first and the second. The first critical of Ah\ corresponds to the moment of
external cavitation symptom of the pump. With reference to the cavitation
curves this mode is specified by reduction of the pump head or efficiency by 1
~ 2%. The second critical value Ah
n
refers to the moment of the pump
operation failure.
H(m)
SEE
H
SfcrD
Q(n/c)
19
18
5H
Ab/b(100%)
2.0 r
1.2
0.4
*=
AG/G(100%)
0.72
0.56
0.40
0.24
0.08
V
\
^
^
<.
^~
■— II !■
— '
1-p=l0g/l;
4 6 8 Ah(m)
2-p = 5g/l; 3-/?=2g/l
Figure 6.11 Erosion against cavitation margin at Q = 0.7
Q
opt
For the pump operation points Q = 0.7
Q
opt
( see Figure 6.11) and Q =
0.9
Q
op
t
(Figure 6.12) the pressure drop at the inlet of the pump, to the level
corresponding to cavitation margin Ah
u
shows an appreciable decrease in the
rate of cavitation-abrasive erosion in the blades, as compared to a
conventional hydroabrasive erosion process. For instance, at Q = 0.9
Q
opt
,
Interaction between Cavitation
and
Abrasive Erosion Processes
333
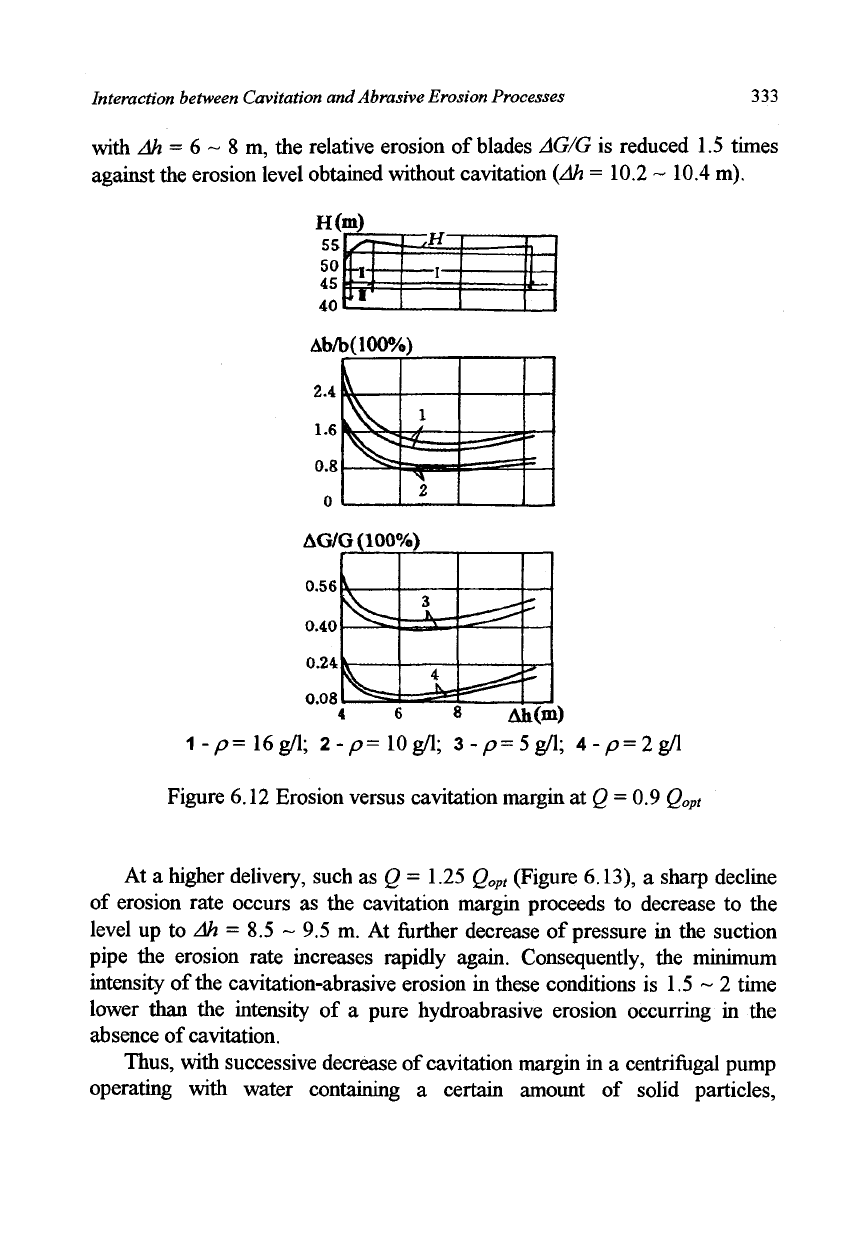
with Ah = 6 ~ 8 m, the relative erosion of
blades
AG/G is reduced 1.5 times
against
the
erosion level obtained without cavitation
{Ah =
10.2 ~ 10.4 m).
AG/G (100%)
4 6 8 Ah(m)
1-/>=l6g/l;
2-/7=
lOg/1;
3-
/
o=5g^; 4-/? = 2g/l
Figure 6.12 Erosion versus cavitation margin at Q
=
0.9
Q
opt
At a higher delivery, such as Q
=
1.25 g
0
^ (Figure 6.13), a sharp decline
of erosion rate occurs as the cavitation margin proceeds to decrease to the
level up to Ah = 8.5 ~ 9.5 m. At further decrease of pressure in the suction
pipe the erosion rate increases rapidly again. Consequently, the minimum
intensity of the cavitation-abrasive erosion in these conditions is 1.5 ~ 2 time
lower than the intensity of a pure hydroabrasive erosion occurring in the
absence of cavitation.
Thus,
with successive decrease of cavitation margin in a centrifugal pump
operating with water containing a certain amount of solid particles,