Daniels M.J., Hogan J.W. Missing Data in Longitudinal Studies: Strategies for Bayesian Modeling and Sensitivity Analysis
Подождите немного. Документ загружается.

260 CASE STUDIES: NONIGNORABLE MISSINGNESS
0.0 0.5 1.0 1.5 2.0
0.0 0.5 1.0 1.5 2.0 2.5
MAR
Mixture
Each expert
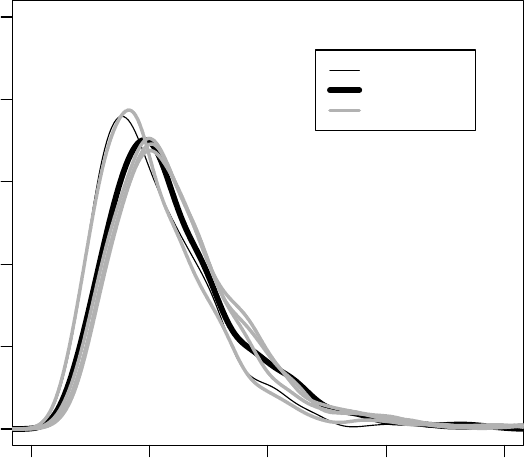
Figure 10.5 OASIS trial: posterior distribution of the treatment odds ratio ϕ under
priors for ∆ corresponding to MAR, expert-specific opinion, and a mixture of expert
opinion. The MAR prior places point mass at (∆
0
, ∆
1
)=(0, 0).
hand, mixture models are well suited because the parameter space is easier
to separate. The various pattern mixture models fit here all have the same
observed-data likelihood.
Second, eliciting informative priors can be complex. A key component of
the elicitation is to develop tools for which expert opinion can be accurately
acquired. Here, experts were asked to condition their opinion about smoking
rate at time j among dropouts using hypothetical smoking rates for non-
dropouts, conditional on smoking status Y
j
at time j − 1. This helped the
experts calibrate their priors.
Finally, we saw that the (ignorable) selection model MAR analysis and
the MAR mixture model analysis were identical. This is not a general phe-

PEDIATRIC AIDS TRIAL 261
Table 10.8 OASIS trial: posterior inferences about time-specific smoking probabil-
ity, derived using informative priors elicited from experts. The MAR inferences are
shown for comparison.
Expert-Specific Posteriors
Treatment Month MAR MNAR 1 2 3 4
1.83.83.83 .83 .83 .83
ET 3 .87 .88 .87 .89 .89 .88
6.82.85.83 .87 .87 .85
12 .78 .84 .83 .87 .87 .83
1.85.85.85 .85 .85 .85
ST 3 .85 .87.86.87.87 .86
6.84.86.86 .87 .86 .86
12 .88 .90 .90 .91 .90 .90
Trt effect ϕ .51 .65 .65 .62 .71 .68
(.2, 1.1) (.2, 1.4)
nomenon. The reason for their equivalence here is that with longitudinal bi-
nary data, a mixture of first-order serial dependence models can also be repre-
sented as a single first-order serial dependence model. Hence inferences about
the full data will be the same under MAR.
10.4 Pediatric AIDS trial: Mixture of varying coefficient models
for continuous dropout
10.4.1 Overview
In this example we use a mixture of varying coefficient models to analyze
data from the pediatric clinical trial described in Section 1.7. Individuals
were scheduled for follow-up every 3 months, but the actual measurement
times varied considerably from individual to individual. Dropout time was
fixed at the timeofthelastobserved measurement. The observed CD4 data,
in the log scale, are shown in Figure 1.5, with several individual trajectories
highlighted. From the small random sample of individuals, we see that those
with longer follow-up tend to have higher overall CD4 counts and less steep
declines over time.
Our objective is to characterize the average CD4 count over time in both
treatment arms, and to draw inference about the difference in mean CD4 at
262 CASE STUDIES: NONIGNORABLE MISSINGNESS
the end of the study period. We assume that the average (log) CD4 is linear
in time with slope and intercept that depend on dropout time. The condi-
tional distributions (given dropout time) are averaged across the distribution
of dropout times separately by treatment, using a mixture of varying coeffi-
cient models (Section 8.4.4). The intercept and slope of CD4 will be given by
smooth but unknown functions β
0
(u)andβ
1
(u)ofdropouttime.
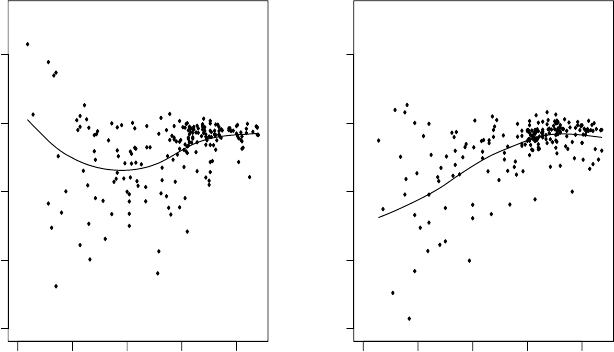
Figure 10.6 is an exploratory plot that can be used to motivate the mix-
ture model. It shows individual-specific OLS slope estimates plotted against
dropout time, and suggests a possibly nonlinear association between slope and
dropout time. However, it should be kept in mind that the slope estimates
for earlier dropoutsarebasedonfewer observations and tend to have higher
variance.
Inference from the mixture of VCM will be compared to inference under a
standard regression model that assumes MAR. Hogan et al. (2004a) analyze
these data using a similar model; the Bayesian formulation given here derives
mainly from Su and Hogan (2007), who provide a more extensive treatment,
including detailed sensitivity analysis.
050100 150 200
−15 −10 −5 0 5
050100 150 200
−15 −10 −5 0 5
Least Squares Slopes
Least Squares Slopes
follow-up time (weeks)follow-up time (weeks)
Figure 10.6 Pediatric AIDS study: OLS slopes vs. follow-up time for each treatment,
with unweighted lowess smoother fit to each set of points.

PEDIATRIC AIDS TRIAL 263
10.4.2 Model specification: CD4 counts
Centering and rescaling the time axis leads to a more interpretable treatment
effect and more stable implementation of posterior sampling. Let t
0
and U
0
,
respectively, denote measurement time and dropout time in the original scale.
We use the shifted and rescaled time variables t =(t
0
− C)/L and U =
(U
0
− C)/L,whereC = U
0
= 139 and L =max
i
U
0
i
.Thelength of the
rescaled time axis is equal to one and it is centered at the (sample) average
follow-up time.
The model used here is described more generally in Section 8.4.4; the spe-
cific formulation is similar to Example 8.8. Treatment assignment is denoted
by Z (1 = high dose AZT, 0 =lowdoseAZT).Lett denote (rescaled) time
elapsed from beginning of follow-up, let Y (t)=log{CD4(t)+1},andletU
denote (rescaled) length of follow-up (i.e., dropout time). Our objective is to
characterize the distribution of Y (t)overthetimeinterval.
Figure 1.5 shows, in the original time axis, a scatterplot of log CD4 counts
vs. time, with individual profiles highlighted. Even in a small sample of indi-
viduals, we see that longer follow-up time tends to be associated with greater
intercept and slope.
As with Example 8.8, weassume the process Y
i
(t)ispotentially observed
at a set of points T
i
= {t
i1
,...,t
i,n
i
},giving rise to the full-data vector
Y
i
=(Y
i
(t
i1
),...,Y
i
(t
i,n
i
))
T
=(Y
i1
,...,Y
i,n
i
)
T
.
Conditional on dropout, we assume the log CD4 trajectory is linear in time.
Let x
ij
=(1,t
ij
), so that X
i
=(x
T
i1
,...,x
T
i,n
i
)
T
is the n
i
× 2designmatrix.
The full-data distribution p(y,u | z)isfactoredasp(y | u, z) p(u | z); the
first factor follows
Y
i
| U
i
= u, Z
i
= z ∼ N(µ
iz
(u), Σ
iz
). (10.20)
The conditional mean µ
iz
(u)isann
i
× 1vector having elements
µ
ijz
(u)=E(Y
ij
| u, z)=β
0z
(u)+β
1z
(u)t
ij
, (10.21)
where β
0z
(u)andβ
1z
(u)aresmooth but unspecified functions of u.When
using the rescaled time axis, the intercept term β
0z
(u)isthefull-data mean
of log CD4 count at time t =
U
0
= 139 among those who drop out at time
u;theslopeβ
1z
(u)isthefull-data mean change in log CD4 from baseline to
end of the study among those dropping out at u.Whenbothβ
0
(u)andβ
1
(u)
are constant in u,wehaveMAR.
The variance Σ
iz
is parameterized using a random effects structure
Σ
iz
= Σ
iz
(Ω,σ)=x
i
Ωx
T
i
+ σ
2
I
n
i
,
where Ω is a 2×2positive definite matrix and I
n
i
is an identity matrix having
dimension n
i
.

264 CASE STUDIES: NONIGNORABLE MISSINGNESS
The smooth functions β
0z
(u)andβ
1z
(u)arerepresented in terms of pe-
nalized splines. We use a low-rank thin-plate spline basis (Crainiceanu et al.,
2005). Suppressing individual-level subscripts for now, we have
β(u; α, ψ)=α
0
+ α
1
u +
k
l=1
ψ
l
|u − s
l
|
3
, (10.22)
where s
l
are fixed knot points, α =(α
0
,α
1
)
T
,andψ =(ψ
1
,...,ψ
k
)
T
.In
the full-data loglikelihood, we introduce a penalty term that shrinks the co-
efficients of (10.22) to induce smoothness; it takes the form λφ
T
Dφ,where
λ>0isasmoothingparameter,φ
T
=(α
T
, ψ
T
), and D is a symmetric
matrix with dimension 2 + k.Following Crainiceanu et al. (2005), we only
penalize higher-order coefficients ψ,sothat
D =
-
0
2×2
0
2×k
0
k×2
Q
k×k
.
,
where the (l, l
)entryofQ is |s
l
− s
l
|
3
.Nowwritev(u)=(1,u)andw(u)=
(|u − s
1
|
3
,...,|u − s
k
|
3
), and let
ψ = Q
1
2
ψ and
w(u)=w(u)Q
−
1
2
.
The penalized splines have a linear model representation as
β(u, φ)=v(u)α +
w(u)
ψ,
where the
ψ ∼ N(0,τ
2
I
k
)areviewed as random effects with variance τ
2
=
1/(2λ). Applying this separately to each of the four functions (intercept and
slope function for each treatment group), we have, for l =0, 1andz =0, 1,
β
lz
(u, φ)=β(u, φ
lz
)=v(u)α
lz
+
w(u)
ψ
lz
,
with
ψ
lz
∼ N(0,τ
2
lz
I
k
).
The conditional distribution of CD4 counts conditional on dropout time
(10.20) can be rewritten as
(Y
i
| u, z) ∼ N ( X
i
β(u; φ
z
, λ
z
), Σ(Ω
z
,σ
z
)),
where φ
T
z
=(α
T
0z
, α
T
1z
,
ψ
T
0z
,
ψ
T
1z
)andτ
2
z
=(τ
2
0z
,τ
2
1z
)
T
.Priorsfor this part of
the model are
α
lz
∼ N(0, 10
4
I
2
),
ψ
lz
| τ
lz
∼ N(0,τ
2
lz
I
k
),
τ
−2
lz
∼ Gamma(.01, 1/.01),
Ω
−1
z
∼ Wishart(3, 3I),
σ
−2
z
∼ Gamma(.01, 1/.01),
for l =0, 1andz =0, 1.
PEDIATRIC AIDS TRIAL 265
10.4.3 Model specification: dropout times
For treatment groups z =0, 1, the distributions p(u | z)areleftessentially
unspecified, and we use Bayesian nonparametric approaches to characterize
them. In particular, we use a Dirichlet mixture of normal distributions (Sec-
tion 3.6), where
U
i
| z ∼ N (α
iz
,ν
z
),
α
iz
∼ G
z
,
G
z
∼ DP(F
0
,a),
with F
0
anormaldistribution. Technical details on sampling can be found in
MacEachern and M¨uller(1998).
10.4.4 Summary of analyses under MAR and MNAR
The primary objective is to draw inference about the difference in mean change
in log CD4 cell count at the end of follow-up; denote this by θ.Inthemixture
model, this corresponds to the difference in integrated slope functions β
1z
(u)
between treatment groups,
θ =
β
11
(u) p(u | z =1)du −
β
10
(u) p(u | z =0)du.
Treatment effect is summarized using the posterior mean and standard devi-
ation for θ andthe posterior probability that θ>0.
In addition to the mixture model, we fit a standard random effects model
that assumes MAR; the latter corresponds to a special case of the mixture
model where the β
lz
(u)areconstantfunctions of u.
Figure 10.7 shows posterior means for the smooth functions β
lz
(u)(for
l =0, 1; z =0, 1), together with posterior estimates of individual-specific in-
tercepts and slopes. The plots of intercept vs. dropout time indicate that mean
CD4 is higher among those with longer follow-up, with a more pronounced
effect in the low dose arm; likewise, CD4slopesarehigheramong those with
longer follow-up times.
Inferences about treatment-specific intercepts and slopes, and treatment
effect, are summarized in Table 10.9. In general, inferences under the mix-
ture model indicate that overall mean (intercept term) and slope over time
arelower under the MNAR assumption. The effect of the MNAR assump-
tion (relative to MAR) ismostpronounced in the low dose arm, where the
association between CD4 count and dropout time is stronger (Figure 10.7).
In fact, the shift in intercepts and slopes from MAR to MNAR exceeds two
posterior standard deviations (PSD) for all parameters except the intercept
on high dose. The PSD is generally greater for the mixture model.
The MNAR assumption also influences the treatment effect; under MAR,
the posterior mean of θ is −.37 (PSD = .21) with P (θ>0) = .96, suggesting
266 CASE STUDIES: NONIGNORABLE MISSINGNESS
superiority of high dose; under MNAR we have posterior mean .01 (PSD =
.25) and P(θ>0) = .49, which is far more equivocal.
10.4.5 Summary
Studies like the Pediatric AIDS trial require methods that can handle con-
tinuous time dropout. The mixture model given here induces an MNAR
dropout process by assuming the full-data response distribution, conditional
on dropout time u,hasmean that is linear in time; the intercept and slope
parameters are smooth but unspecified functions of u.
−0.6 −0.4 −0.2 0.0 0.2
−4 −2 0 2 4 6 8
−0.6 −0.4 −0.2 0.0 0.2
−15 −10 −5 0 5
−0.6 −0.4 −0.2 0.0 0.2
−4 −2 0 2 4 6 8
−0.6 −0.4 −0.2 0.0 0.2
−15 −10 −5 0 5
intercept (low dose)intercept (high dose)
slope (lowdose)slope (high dose)
follow-up time (standardized)follow-up time (standardized)
follow-up time (standardized)follow-up time (standardized)
Figure 10.7 Pediatric AIDS study: posterior (pointwise) mean of intercept function
β
0z
(u) and slope function β
1z
(u),separately by treatment (z =0, 1). Points are
individual-specific posterior mean intercepts and slopes. Tick marks on top edge of
each plot are deciles of the dropout distribution.

PEDIATRIC AIDS TRIAL 267
Table 10.9 Pediatric AIDS trial: posterior means and standard deviations for key pa-
rameters from random effects model (REM) fit under MAR, and mixture of varying
coefficient model (VCM), which assumes MNAR.
Model
Dose Parameter REM (MAR) VCM (MNAR)
Low Intercept 5.6 (.13) 5.2 (.11)
Slope –1.6 (.14) –2.1 (.13)
High Intercept 5.4 (.14) 5.3 (.14)
Slope –1.9 (.16) –2.1 (.19)
Difference (θ)–.37(.21) .01 (.25)
P (θ>0) .96 .49
An advantage of the model is that the functional form of the missingness
mechanism does not have to be known; it is characterized by functions that can
be left unspecified. However, it is necessary to specify the form of E{Y (t) | u}
as a function of t;hereweassume it is linear with intercept β
0
(u)andintercept
β
1
(u). A key consequence is that conditionally on U = u,themean of Y (t)
has the same functional form before and after dropout; for the linear case, the
implication is that the slope is the same prior to and after u.
This property can be relaxed by expanding the model to accommodate
sensitivity parameters that allow (for example) a different slope following
dropout. For example, we can expand (10.21) by introducing a sensitivity
parameter ξ =(ξ
0
,ξ
1
), so that
E(Y
ij
| u, z)=β
0z
(u)+β
1z
(u)t
ij
+ ξ
z
(t
ij
− u)
+
,
where a
+
= aI{a>0} is the positive part of a.Inthisformulation, β
1z
(u)
is the slope prior to dropout time u and β
1z
(u)+ξ
z
is the slope after u.
More generally, ξ
z
can depend on u.Anothergeneralization of the model
allows the variance-covariance structure to vary smoothly with u;thiscan
be accomplished using an appropriate parameterization of Σ.Details can be
found in Su and Hogan (2007).

Distributions
Discrete Distributions
Binomial Y | n, θ ∼ Bin(n, θ)
The binomial model characterizes the number of successes in n independent
trials, where success probability on each trial is θ.Ithasmassfunction
p(y | θ, n)=
n
y
θ
y
(1 − θ)
n−y
,
where y ∈{0, 1,...,n} and 0 <θ<1.
Multinomial with k categories Y | n, θ ∼ Mult(n, θ)
The multinomial model characterizes the distribution of n events across k
mutually exclusive categories labeled j =1,...,k,whereY
j
is the count and
θ
j
is the probability for category j.Themultinomial randomvariable has
mass function
p(y | n, θ)=
n
y
1
y
2
···y
k
θ
y
1
1
θ
y
2
2
···θ
y
k
k
,
where y =(y
1
,...,y
k
)
T
, y
j
≥ 0,
k
j=1
y
j
= n,0<θ
j
< 1, and
k
j=1
θ
j
=1.
Continuous distributions
Dirichlet with k categories θ ∼ Dir(β)
The Dirichlet distribution characterizes the joint distribution of a vector of
random variables θ =(θ
1
,...,θ
k
)havingθ
j
> 0and
j
θ
j
=1.Itisfre-
quently used as a prior for multinomial probabilities. It density function is
p(θ | β)=
Γ(β
1
+ ···+ β
k
)
&
k
j=1
Γ(β
j
)
θ
β
1
−1
1
···θ
β
k
−1
k
,
where β
j
> 0andΓ(·)isthegamma function.
268

DISTRIBUTIONS 269
Gamma Y ∼ Gamma(α, β)
Arandom variable Y having the gamma distribution has density function
p(y | α, β)=
1
Γ(α)β
α
exp(−y/β)y
α−1
,
with y>0, α>0, and β>0. Its mean is E(Y )=αβ.
Normal Y ∼ N(µ, σ
2
)
Arandom variable Y having the normal (Gaussian) distribution with mean
µ and variance σ
2
has density function
p(y | µ, σ)=(2π)
−1/2
σ
−1
exp
−(x − µ)
2
/2σ
2
with −∞ <y<∞, −∞ <µ<∞,andσ>0.
Multivariate normal (q-dimensional) Y ∼ N(µ, Σ)
A q-dimensional normal random variable Y =(Y
1
,...,Y
q
)
T
with mean µ =
(µ
1
,...,µ
q
)
T
and q × q variance matrix Σ has density function
p(y | µ, Σ)=(2π)
−q/2
|Σ|
−1/2
exp
−
1
2
(y − µ)
T
Σ
−1
(y − µ)
,
where −∞ <y
j
< ∞, −∞ <µ
j
< ∞,andΣ is positive definite.
t distribution Y ∼ T
ν
(µ, σ
2
)
Arandom variable Y having the t distribution with mean µ,scaleσ
2
and ν
degrees of freedom has density
p(y | µ, σ
2
,ν)=
Γ((ν +1)/2)
Γ(ν/2)(νσπ)
1/2
1+(y − µ)
2
/νσ
2
−(ν+1)/2
,
where −∞ <y<∞, −∞ <µ<∞, σ
2
> 0, and ν>0.
Multivariate t (q-dimensional) Y ∼ T
ν
(µ, Σ)
A q dimensional vector Y having the multivariate t distribution has density
function
p(y | µ, Σ,ν)=
Γ((ν + p)/2)
Γ(ν/2)(νπ)
p/2
|Σ|
−1/2
1+(y − µ)
T
Σ
−1
(y − µ)/ν
−(ν+p)/2
with −∞ <Y
j
< ∞, −∞ <µ
j
< ∞, ν>0, and Σ positive definite.
Wishart (q-dimensional covariance matrix) S ∼ Wishart(ν, A)
A q dimensional covariance matrix from the Wishart distribution with scale
matrix A and degrees of freedom ν has density function
p(S | A,ν)=c(ν, q) |A|
−ν/2
|S|
(ν−q−1)/2
exp
−tr(A
−1
S)
,