Daniels M.J., Hogan J.W. Missing Data in Longitudinal Studies: Strategies for Bayesian Modeling and Sensitivity Analysis
Подождите немного. Документ загружается.

250 CASE STUDIES: NONIGNORABLE MISSINGNESS
attention here on the effect of priors on the parameters governing departures
from MAR, and the degree to which they may be informed by observed data.
Ful l-data model
For the first factor, we assume the full-data response follows a first-order
Markov model, separately by treatment,
Y
1
∼ Ber(θ
1
)
Y
j
| Y
j−1
∼ Ber(θ
j|j−1
),
with
logit(θ
j|j−1
)=β
0j
+ β
1
y
j−1
.
The missing data mechanism is specifiedintermsofthehazard of dropout,
h
S
(t
j
| y)=P (S = j | S ≥ j, y),j=1, 2, 3, 4
(recall that all participants have at least one measurement, so S ≥ 1). In
general, h
S
(t
j
| Y )candepend on any function of the full-data vector Y .
Here we allow dependence on Y
j−1
and Y
j
via
logit{h
S
(t
j
| y)} = ψ
0
+ ψ
1
y
j−1
+ ψ
2
y
j
+ ψ
3
y
j
y
j−1
. (10.14)
Conditional on Y
j−1
,thelogodds of dropout at t
j
is ψ
0
+ψ
2
y
j
when Y
j−1
=0,
and is (ψ
0
+ψ
1
)+(ψ
2
+ψ
3
)y
j
when Y
j−1
=1.DropoutisMAR(and ignorable)
when ψ
2
= ψ
3
=0.
Priors
Our analysis uses various priors on (ψ
2
,ψ
3
). First, we use the point mass MAR
prior
p(ψ
2
,ψ
3
)=I{ψ
2
= ψ
3
=0}.
Next, we use a series of informative priors that permit departures from MAR.
Rather than use point mass priors, we employ normal priors centered away
from zero and having unit variance. Specifically,
(ψ
2
,ψ
3
)
T
| (d
2
,d
3
)
T
∼ N
//
d
2
d
3
0
,
/
10
01
00
. (10.15)
The mean parameters are varied over the set
(d
2
,d
3
) ∈{−0.5, 0, 0.5, 1.0}
⊗2
.
Priors for (β,ψ
0
,ψ)arespecified as independent diffuse normal priors with
mean zero and variance 100.
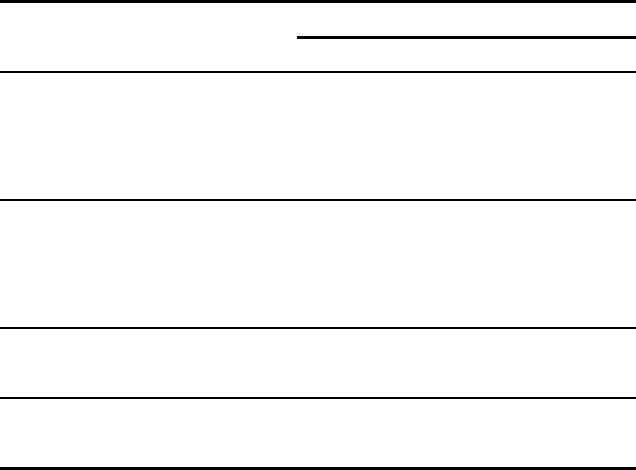
OASIS STUDY 251
Table 10.3 OASIS trial: posterior means (SD) for hazard function parameters,
treatment-specific smoking rates, and treatment effects from selection model analysis
using different priors for (ψ
2
,ψ
3
).Summaries provided here for point mass MAR
prior and for normal priors having mean (d
2
,d
3
) and variance I;see(10.15).
Prior means (d
2
,d
3
)
Trt Parameter MAR (–1,–1) (0,0) (1,1)
ET ψ
0
–2.4 (.50) –2.5 (.64) –2.8 (.69) –3.2 (.80)
ψ
1
1.6 (.50) 1.8 (1.0) .88 (.99) –.02 (1.0)
ψ
2
—–.15(.96) .50 (.86) 1.2 (.90)
ψ
3
—–.16(.99) .56 (.91) 1.2 (.91)
ST ψ
0
–2.0 (.41) –1.7 (.44) –1.8 (.54) –2.6 (.76)
ψ
1
.47 (.43) 2.6 (.60) 1.7 (1.2) –.71 (1.3)
ψ
2
— –2.0 (.86) –1.1 (1.2) .86 (1.1)
ψ
3
— –1.9 (.87) –.95 (1.1) .87 (1.1)
E(Y
4
| ET) .78 (.05) .76 (.07) .83 (.04) .82 (.04)
E(Y
4
| ST) .88 (.03) .77 (.06) .82 (.07) .89 (.04)
Trt effect ϕ .51 1.09 .97 .61
95% interval (.19, 1.06) (.32, 2.53) (.26, 2.38) (.22, 1.38)
10.3.3 Selection model analyses under MAR and MNAR
Results are shown in Table 10.3. Under MAR (ψ
2
= ψ
3
=0),the treatment
odds ratio is .5withacredible interval of (.2, 1.1), indicating a marginally
positive effect of the ET treatment in lowering the rate of smoking.
For the ET arm, subjects smoking the previous week were more likely to
drop out at the current week than those not smoking, with an odds ratio of
about five. A similar relation was seen in the ST arm, but with a smaller odds
ratio (1.6) and a credible interval covering one.
Under MNAR, the posteriors for ψ
2
and ψ
3
were relatively diffuse and
informative priors were needed to stabilize the posterior. In fact, the priors
and posteriors for (ψ
2
,ψ
3
)arevery different for all three informative priors,
indicating that observed data are contributing information.
We therefore do not recommend the MNAR analyses with informative pri-
ors here because the prior and the posterior for (ψ
2
,ψ
3
)arevery different and
therefore do not satisfy the condition (9.12) as recommended in Chapter 9.
252 CASE STUDIES: NONIGNORABLE MISSINGNESS
Semiparametric selection models offer a possible alternative; this is an area of
ongoing work.
10.3.4 Pattern mixture model specification
For the mixture model specification, the full-data response distribution is a
mixture over the follow-up times, factored as
p(y
mis
, y
obs
,s| z)=p(y
mis
| y
obs
,s,z) p(y
obs
| s, z) p(s | z).
We group the patterns S =2andS =3intoasingle pattern and label it
S =(2, 3). Hence for purposes ofthepattern mixture model, the realizations
of S are s ∈{1, (2, 3), 4}.Thecomponent distributions follow
Y
1
| S = s, Z = z ∼ Ber(µ
(s)
1z
),
Y
j
| Y
j−1
,S = s, Z = z ∼ Ber(φ
(s)
jz
),j=2, 3, 4, (10.16)
where
logit(φ
(s)
jz
)=γ
(s)
jz
+ θ
(k)
jz
Y
j−1
. (10.17)
For the dropout distribution, we assume
S | Z = z ∼ Mult(ψ
1z
,ψ
(2,3)z
,ψ
4z
).
This model assumes that within dropout pattern, the joint distribution of
Y can be captured using a first-order serial dependence structure. Table 10.4
shows the structure of the model in the logit scale; empty cells represent
quantities that cannot be identified by observed data.
10.3.5 MAR and MNAR parameterizations
Identifying the model under MAR
As with the Growth Hormone example, model identification under MAR is
based on condition (8.17) in Theorem 8.1. To satisfy MAR under the first-
order dependence structure given by (10.17), we require
p
s
(y
j
| y
j−1
,z)=p
≥j
(y
j
| y
j−1
,z)
for each s<jand for j =2, 3, 4.
∗
Again, this implies that the distribution
(Y
j
| Y
j−1
,Z)isequivalentfor those dropping out prior to j (i.e., s<j)and
those still in follow-up at j (i.e., s ≥ j).
For those still in follow-up at j,define
φ
(≥j)
jz
= E(Y
j
| Y
j−1
,Z = z, S ≥ j),
∗
With the collapsed patterns, if s =(2, 3), then s<jonly when j =4.

OASIS STUDY 253
Table 10.4 OASIS trial: representation, on the logit scale, of full-data component
distributions model given by (10.17). Cell entries are logits of φ
(s)
j
(y)=E(Y
j
|
Y
j−1
= y,S = s).Emptycellscannot be identified by observed data. Treatment
subscripts suppressed for clarity.
yφ
(s)
2
(y) φ
(s)
3
(y) φ
(s)
4
(y)
S =1 0
1
S =(2, 3) 0 γ
(2,3)
2
γ
(2,3)
3
1 γ
(2,3)
2
+ θ
(2,3)
2
γ
(2,3)
3
+ θ
(2,3)
3
S =4 0 γ
(4)
2
γ
(4)
3
γ
(4)
4
1 γ
(4)
2
+ θ
(4)
2
γ
(4)
3
+ θ
(4)
3
γ
(4)
4
+ θ
(4)
4
and let
logit(φ
(≥j)
jz
)=γ
(≥j)
jz
+ θ
(≥j)
jz
Y
j−1
. (10.18)
It can be shown that, in this setting, (10.18) is compatible with the full-data
model (10.17); in fact, the regression parameters in (10.18) are determined by
those in (10.17).
From Theorem 8.1, the MAR constraint is satisfied when, for each j>s,
γ
(s)
jz
= γ
(≥j)
jz
θ
(s)
jz
= θ
(≥j)
jz
.
The MAR identification scheme is shown in Table 10.5.
Parameterizing the full-data model under MNAR
The full-data model can be reparameterized in terms of sensitivity parameters.
Let ξ(ω)=(ξ
S
, ξ
M
), where
ξ
S
=
θ
(1)
j
,γ
(1)
j
j =2, 3, 4
θ
(2,3)
4
,γ
(2,3)
4
ξ
M
=
θ
(2,3)
j
,γ
(2,3)
j
j =2, 3
θ
(4)
j
,γ
(4)
j
j =2, 3, 4
µ
(1)
1
,µ
(2,3)
1
,µ
(4)
1
ψ
(1)
,ψ
(2,3)
,ψ
(4)

254 CASE STUDIES: NONIGNORABLE MISSINGNESS
Table 10.5 OASIS trial: identification of full-data model (10.17) under MAR, on the
logit scale. Cell entries are (logits of ) φ
(s)
j
(y)=E(Y
j
| Y
j−1
= y, S = s).Treatment
subscripts suppressed for clarity.
yφ
(s)
2
(y) φ
(s)
3
(y) φ
(s)
4
(y)
S =1 0 γ
(≥2)
2
γ
(≥3)
3
γ
(4)
4
1 γ
(≥2)
2
+ θ
(≥2)
2
γ
(≥3)
3
+ θ
(≥3)
3
γ
(4)
4
+ θ
(4)
4
S =(2, 3) 0 γ
(2,3)
2
γ
(2,3)
3
γ
(4)
4
1 γ
(2,3)
2
+ θ
(2,3)
2
γ
(2,3)
3
+ θ
(2,3)
3
γ
(4)
4
+ θ
(4)
4
S =4 0 γ
(4)
2
γ
(4)
3
γ
(4)
4
1 γ
(4)
2
+ θ
(4)
2
γ
(4)
3
+ θ
(4)
3
γ
(4)
4
+ θ
(4)
4
(see Table 10.4), where we have suppressed the dependence of these param-
eters on treatment. We also can characterize departures from MAR via the
mapping ξ
S
= h(ξ
M
, ∆), defined as follows.
Among those in patterns s =1ands =(2, 3), define, for each j>sand
for z =0, 1, a pair of parameters (∆
(s)
0jz
, ∆
(s)
1jz
)thatsatisfy
γ
(s)
jz
= h
1
(ξ
M
)=γ
(≥j)
jz
+∆
(s)
0jz
θ
(s)
jz
= h
2
(ξ
M
)=θ
(≥j)
jz
+(∆
(s)
1jz
− ∆
(s)
0jz
). (10.19)
Each ∆ parameter represents a log odds ratio comparing odds of smoking at
time j,conditional on Y
j−1
,between those with s<j(dropped out) and
those with s ≥ j (still in follow-up). Specifically,
∆
(s)
yjz
=log
odds(Y
j
=1| Y
j−1
= y, Z = z, S = s)
odds(Y
j
=1| Y
j−1
= y, Z = z, S ≥ j)
.
Setting each ∆
(s)
yjz
=0implies MAR.
The dimension of ∆ is 16. To reduce the parameter space, we make the sim-
plifying assumption that ∆
(s)
yjz
=∆
y
,leavingthetwo-dimensional parameter
∆ =(∆
0
, ∆
1
). The simplification implies that departures from MAR at time
j may differ depending on Y
j−1
, but conditionally on Y
j−1
are constant across
measurement time, treatment group, and dropout time. The MNAR model
is shown in Table 10.6. Naturally, other simplifications can be considered,
depending on the application.
Prior distributions for parameters can still be specified as
p(ξ
S
, ξ
M
, ∆)=p(ξ
S
| ξ
M
, ∆) p(∆ | ξ
M
) p(ξ
M
),

OASIS STUDY 255
Table 10.6 OASIS trial: full-data model (10.17) under MNAR, with parameters
(∆
0
, ∆
1
) capturing departures from MAR on the logit scale. Cell entries are logits
of φ
(s)
j
(y)=E(Y
j
| Y
j−1
= y, S = s).Treatmentsubscripts suppressed for clarity.
yφ
(s)
2
(y) φ
(s)
3
(y) φ
(s)
4
(y)
S =1 0 γ
(≥2)
2
+∆
0
γ
(≥3)
3
+∆
0
γ
(4)
4
+∆
0
1 γ
(≥2)
2
+ θ
(≥2)
2
+∆
1
γ
(≥3)
3
+ θ
(≥3)
3
+∆
1
γ
(4)
4
+ θ
(4)
4
+∆
1
S =(2, 3) 0 γ
(2,3)
2
γ
(2,3)
3
γ
(4)
4
+∆
0
1 γ
(2,3)
2
+ θ
(2,3)
2
γ
(2,3)
3
+ θ
(2,3)
3
γ
(4)
4
+ θ
(4)
4
+∆
1
S =4 0 γ
(4)
2
γ
(4)
3
γ
(4)
4
1 γ
(4)
2
+ θ
(4)
2
γ
(4)
3
+ θ
(4)
3
γ
(4)
4
+ θ
(4)
4
where, as usual,
p(ξ
S
| ξ
M
, ∆)=I{ξ
S
= h(ξ
M
, ∆)}.
10.3.6 Pattern mixture analysis under MAR
As a starting point, we present analysis under MAR assumption. First we
assign point mass at zero to (∆
0
, ∆
1
)separately by both treatment arms via
p(∆
0
, ∆
1
| ξ
M
)=I{(∆
0
, ∆
1
)=(0, 0)}.
This priorassumes MAR with 100% certainty. Priors for components of ξ
M
are diffuse but proper. Results are shown in Table 10.7, compared side by
side with summaries using available data separately at each time point. The
table suggests that the MAR analysis varies very little from simply computing
smoking rates from available data.
10.3.7 Pattern mixture analysis under MNAR using elicited priors
Under MAR, the probability of smoking at time j,conditional on observed
smoking history up to but not including j,isequivalentbetween dropouts
and those who continue the study. Although research on smoking cessation
has suggested that dropouts are more likely to be smokers after leaving a study
(Lichtenstein and Glasgow, 1992), the data offer no evidence about this.
The mixture model factorization allows assumptions about the missing data
mechanism to be completely encoded in the prior p(∆ | ξ
M
). In this section,

256 CASE STUDIES: NONIGNORABLE MISSINGNESS
Table 10.7 OASIS trial: inference about time-specific smoking rates using available
data at each time point and using a pattern mixture model with an MAR point mass
prior.
Available MAR
Treatment Month Data Prior
1.83.83
ET 3 .84 .87
6.79.82
12 .76 .78
1.85.85
ST 3 .85 .85
6.84.84
12 .88 .88
Trt effect ϕ .43 .51
95% interval (.19, 1.06)
we summarize the use of priors elicited from a panel of experts. Complete
details appear in Lee et al. (2007) and Lee (2006); the process and analyses
are briefly summarized here.
Eliciting information and constructing prior distributions
Lee et al. (2007) convened a panel of four faculty investigators who are ex-
perts in smoking cessation in order to elicit information about ∆ =(∆
0
, ∆
1
).
Elicitation was conducted using a written questionnaire that provided detailed
information about the study and its target population. The sensitivity param-
eters ∆
0
and ∆
1
are measuredontheodds ratio scale, but prior information
waselicited on the probability scale for the sake of transparency.
The main part of the questionnaire asked each expert to provide a best
guess and 90% interval for the probability of smoking at t
j
among those who
dropped out at t
j−1
.Tohelpcalibrate the response, experts were asked to
provide their answer conditionally on hypothetical rates for those who did
not drop out. Formally, eachexpertwasprovided with a range of values for
E(Y
j
| Y
j−1
= y, S ≥ j),y=0, 1
and asked to provide a best guess and 90% interval for
E(Y
j
| Y
j−1
= y, S = j − 1),y=0, 1.
OASIS STUDY 257
Next, each expert’s best guess and lower and upper bounds of their 90%
interval for smoking rates among dropouts at each time j were converted to
the log odds scale, based on the observed smoking rates at each time among
non-dropouts; i.e., based on observed values of E(Y
j
| Y
j−1
= y, S ≥ j). In
that sense we are eliciting priors for ∆ | ξ
M
because E(Y
j
| Y
j−1
,S ≥ j)isa
function of ξ
M
.
The log odds ratios corresponding to the best guess and interval boundaries
were then averaged over time, weighting by sample size, to obtain a summary
guess and summary interval for each expert. This yields, for each expert, a
90% interval and a modal value for both ∆
0
and ∆
1
.
Not surprisingly, the expert-specific intervals for the ∆’s were asymmet-
ric. We therefore assumed a skew-normalpriorforeach expert (Azzalini and
Valle, 1996). The skew-normal distribution p( ·|µ, η, ν)hasthreeparameters:
location µ,scaleη,andshape(or skewness) ν.Twopercentiles and a mode
are sufficient to uniquely determine theparameters. Specifically, using sum-
maries of best guess (mode), 5th percentile, and 95th percentile as inputs,
the following system of equations was solved for (µ, η, ν), separately for each
expert and each of ∆
0
,∆
1
:
arg max
∆
p(∆ | µ, η, ν)=mode,
L
−∞
p(∆ | µ, η, ν) d∆=0.05,
U
−∞
p(∆ | µ, η, ν) d∆=0.95.
Here, L and U are, respectively, the lower and upper bounds of the 90%
interval for ∆, elicited from the experts.
Finally, a four-component mixture (one for each expert) of skew normal
distributions was used for each ∆ parameter, with each expert’s prior con-
tributing equally to the mixture.
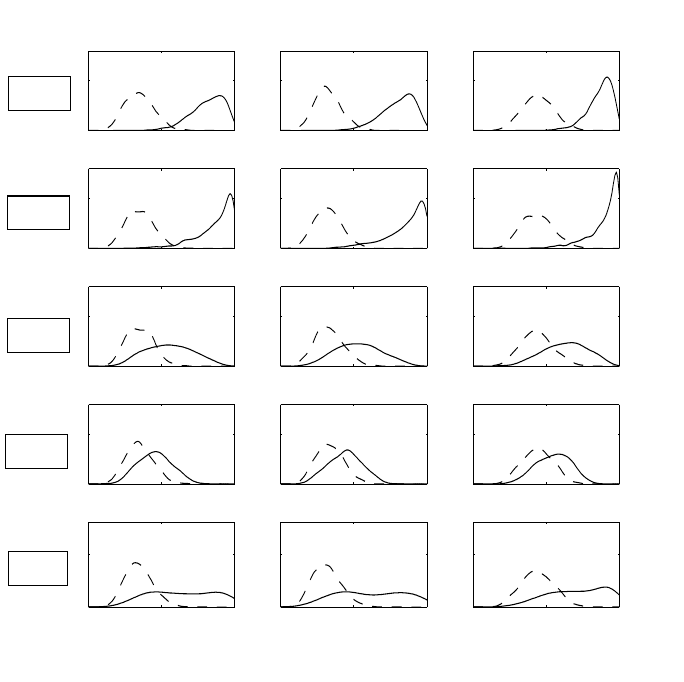
Summary of analysis
Figure 10.3 shows the effect of the informative priors relative to MAR for the
ET armbyexamining the conditional smoking probabilities E(Y
j
| Y
j−1
=
0,S =1),forj =2, 3, 4. In each case, the expert-specific prior shifts the
smoking probabilities toward one. This figure shows that even for participants
who were not smoking at t
j−1
,thosewhodropout after time 1 (S =1)are
believed to have substantially higher smoking probability compared to those
who continue (S ≥ 2).Under MAR, the probabilities would be equal between
dropouts and non-dropouts.
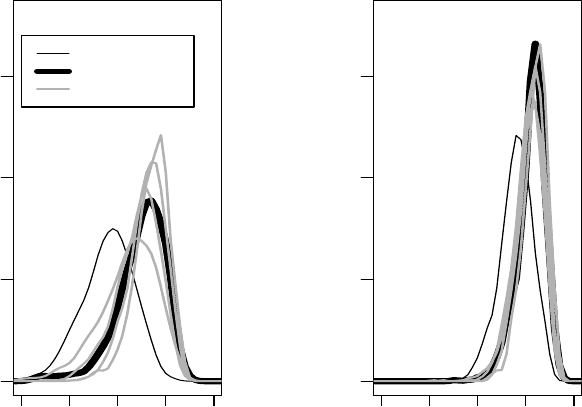
Figure 10.4 shows the distribution of E(Y
4
)foreachtreatment arm; it
separates out posteriors derived by using individual expert-specific priors, the
258 CASE STUDIES: NONIGNORABLE MISSINGNESS
mixture (of experts) prior, and the MAR prior. Again, relative to MAR, we
see E(Y
4
)shiftedtoward one.
The full summary of time-specific smoking rates and the treatment odds
ratio is given in Table 10.8, and the posterior distribution of the treatment
odds ratio is given in Figure 10.5. Using the informative prior, the odds ratio
is attenuated toward 1 relative to MAR, and shows more variability (posterior
mean .5 with 95% interval (.2, 1.1) under MAR; posterior mean .7 with 95%
interval (.2, 1.4) using informative priors). The additional variability can also
be seen in Figure 10.5 as the right tail under MNAR is heavier than under
0 0.5 1
0
5
Expert1
E(Y
2
Y
1
=0)
0 0.5 1
0
5
E(Y
3
Y
2
=0)
0 0.5 1
0
5
E(Y
4
Y
3
=0)
0 0.5 1
0
5
Expert2
0 0.5 1
0
5
0 0.5 1
0
5
0 0.5 1
0
5
Expert3
0 0.5 1
0
5
0 0.5 1
0
5
0 0.5 1
0
5
Expert4
0 0.5 1
0
5
0 0.5 1
0
5
0 0.5 1
0
5
Mixture
0 0.5 1
0
5
0 0.5 1
0
5
Figure 10.3 OASIS trial: for the ET arm, comparison of conditional means E(Y
j
|
Y
j−1
=0,S =1)for j =2, 3, 4 under MNAR using expert-specific and mixture-of-
experts priors (solid lines), and under MAR (dashed line).
OASIS STUDY 259
MAR. Whereas the MAR analysis suggests that ET is moderately superior,
the MNAR analysis incorporating expert opinion — along with uncertainty
stemming from within-expert and between-expert variation — is more equiv-
ocal. Because dropout rate is greater on the ET arm, the relative adjustment
in smoking rates under MNAR also is greater.
10.3.8 Summary: selection vs. pattern mixture approaches
We fit both parametric selection models and mixture models under MAR and
by using informative priors. This analysis has brought out several key issues.
First, the identifiability of all parameters in parametric selection models makes
them ill-suited for sensitivity analysis and constructing informative priors.
Semiparametric selection models would be a possible alternative. On the other
0.6 0.7 0.8 0.9 1.0
051015
Enhancement arm
MAR
Mixture
Each expert
0.6 0.7 0.8 0.9 1.0
051015
Standard arm
Figure 10.4 OASIS trial: posterior distribution of E(Y
4
),smokingrate at month
12, by treatment. Posteriors shown correspond to the following priors for ∆:point
mass at zero (MAR), expert-specific priors, and the mixture of expert-specific priors
(MNAR).