CIMA - C3 Fundamentals Of Business Mathematics
Подождите немного. Документ загружается.


290 11: Forecasting ⏐ Part F Forecasting
3.2 Example: The trend and seasonal variations
Output at a factory appears to vary with the day of the week. Output over the last three weeks has been as follows.
Week 1 Week 2 Week 3
'000 units '000 units '000 units
Monday 80 82 84
Tuesday 104 110 116
Wednesday 94 97 100
Thursday 120 125 130
Friday 62 64 66
Required
Find the seasonal variation for each of the 15 days, and the average seasonal variation for each day of the week
using the moving averages method.
Solution
Actual results fluctuate up and down according to the day of the week and so a moving average of five will be
used. The
difference between the actual result on any one day (Y) and the trend figure for that day (T) will be the
seasonal variation (S)
for the day. The seasonal variations for the 15 days are as follows.
Moving total Seasonal
Actual of five days' Trend variation
(Y) output (T) (Y–T)
Week 1 Monday 80
Tuesday 104
Wednesday 94 460 92.0 +2.0
Thursday 120 462 92.4 +27.6
Friday 62 468 93.6 –31.6
Week 2 Monday 82 471 94.2 –12.2
Tuesday 110 476 95.2 +14.8
Wednesday 97 478 95.6 +1.4
Thursday 125 480 96.0 +29.0
Friday 64 486 97.2 –33.2
Week 3 Monday 84 489 97.8 –13.8
Tuesday 116 494 98.8 +17.2
Wednesday 100 496 99.2 +0.8
Thursday 130
Friday 66
You will notice that the variation between the actual results on any one particular day and the trend line average is
not the same from week to week. This is because Y – T contains not only seasonal variations but
random
variations, and an average of these variations can be taken.
Monday
Tuesday
Wednesday
Thursday
Friday
Week 1
+2.0
+27.6
–31.6
Week 2
–12.2
+14.8
+1.4
+29.0
–33.2
Week 3
–13.8
+17.2
+0.8
Average
–13.0
+16.0
+1.4
+28.3
–32.4

Part F Forecasting ⏐ 11: Forecasting 291
Variations around the basic trend line should cancel each other out, and add up to 0. At the moment they do not.
The average seasonal estimates must therefore be corrected so that they add up to zero and so we spread the
total of the daily variations (0.30) across the five days (0.3
÷ 5) so that the final total of the daily variations goes to
zero.
Monday
Tuesday
Wednesday
Thursday
Friday
Total
Estimated average
daily variation
–13.00
+16.00
+1.40
+28.30
–32.40
0.30
Adjustment to reduce
total variation to 0
–0.06
–0.06
–0.06
–0.06
–0.06
–0.30
Final estimate of average
daily variation
–13.06
+15.94
+1.34
+28.24
–32.46
0.00
These might be rounded up or down as follows.
Monday –13; Tuesday +16; Wednesday +1; Thursday +28; Friday –32; Total 0.
Question
Four-quarter moving average trend
Calculate a four-quarter moving average trend centred on actual quarters and then find seasonal variations from
the following.
Sales in $'000
Spring Summer Autumn Winter
20X7 200 120 160 280
20X8 220 140 140 300
20X9 200 120 180 320
Answe
r
Moving Seasonal
Sales 4-quarter 8-quarter average variation
(Y) total total (T) (Y–T)
20X7 Spring 200
Summer 120
760
Autumn 160 1,540 192.5 –32.5
780
Winter 280 1,580 197.5 +82.5
800
20X8 Spring 220 1,580 197.5 +22.5
780
Summer 140 1,580 197.5 –57.5
800
Autumn 140 1,580 197.5 –57.5
780
Winter 300 1,540 192.5 +107.5
760

292 11: Forecasting ⏐ Part F Forecasting
Moving Seasonal
Sales 4-quarter 8-quarter average variation
(Y) total total (T) (Y–T)
20X9 Spring 200 1,560 195.0 +5.0
800
Summer 120 1,620 202.5 –82.5
820
Autumn 180
Winter 320
We can now average the seasonal variations.
Spring
Summer
Autumn
Winter
Total
20X7
–32.5
+82.5
20X8
+22.5
–57.5
–57.5
+107.5
20X9
+5.0
–82.5
+27.5
–140.0
–90.0
+190.0
Average variations (in $'000)
+13.75
–70.00
–45.00
+95.00
–6.25
Adjustment so sum is zero
+1.5625
+1.5625
+1.5625
+1.5625
+6.25
Adjusted average variations
+15.3125
–68.4375
–43.4375
+96.5625
0
These might be rounded up or down to:
Spring $15,000, Summer –$68,000, Autumn –$43,000, Winter $97,000
3.3 Finding the seasonal component using the multiplicative model
The method of estimating the seasonal variations in the additive model is to use the differences between the trend
and actual data.
The additive model assumes that the components of the series are independent of each other,
an increasing trend not affecting the seasonal variations for example.
The alternative is to use the
multiplicative model whereby each actual figure is expressed as a proportion of the
trend
. Sometimes this method is called the proportional model.
3.4 Example: Multiplicative model
The additive model example above (in Paragraph 3.2) can be reworked on this alternative basis. The trend is
calculated in exactly the same way as before but we need a different approach for the seasonal variations.
The multiplicative model is Y = T × S × R and, just as we calculated S = Y – T for the additive model we can
calculate
S = Y/T for the multiplicative model.
Seasonal
Actual Trend variation
(Y) (T) (Y/T)
Week 1 Monday 80
Tuesday 104
Wednesday 94 92.0 1.022
Thursday 120 92.4 1.299
Friday 62 93.6 0.662

Part F Forecasting ⏐ 11: Forecasting 293
Seasonal
Actual Trend variation
(Y) (T) (Y/T)
Week 2 Monday 82 94.2 0.870
Tuesday 110 95.2 1.155
Wednesday 97 95.6 1.015
Thursday 125 96.0 1.302
Friday 64 97.2 0.658
Week 3 Monday 84 97.8 0.859
Tuesday 116 98.8 1.174
Wednesday 100 99.2 1.008
Thursday 130
Friday 66
The summary of the seasonal variations expressed in
proportional terms is as follows.
Monday
Tuesday
Wednesday
Thursday
Friday
Week 1
1.022
1.299
0.662
Week 2
0.870
1.155
1.015
1.302
0.658
Week 3
0.859
1.174
1.008
Total
1.729
2.329
3.045
2.601
1.320
Average
0.8645
1.1645
1.0150
1.3005
0.6600
Instead of summing to zero, as with the absolute approach, these should
sum (in this case) to 5 (an average of 1).
They actually sum to 5.0045 so 0.0009 has to be deducted from each one. This is too small to make a difference to
the figures above, so we should deduct 0.002 and 0.0025 to each of two seasonal variations. We could arbitrarily
decrease Monday's variation to 0.8625 and Tuesday's to 1.162.
3.5 When to use the multiplicative model
The multiplicative model is better than the additive model for forecasting when the trend is increasing or
decreasing over time
. In such circumstances, seasonal variations are likely to be increasing or decreasing too. The
additive model simply adds absolute and unchanging seasonal variations to the trend figures whereas the
multiplicative model, by multiplying increasing or decreasing trend values by a constant seasonal variation factor,
takes account of changing seasonal variations.
3.6 Summary
We can summarise the steps to be carried out when calculating the seasonal variation as follows.
Step 1 Calculate the moving total for an appropriate period.
Step 2 Calculate the moving average (the trend) for the period. (Calculate the mid-point of two moving
averages if there are an even number of periods.)
Step 3 Calculate the seasonal variation. For an additive model, this is Y – T. For a multiplicative model, this
is Y/T.
Step 4 Calculate an average of the seasonal variations.
Step 5 Adjust the average seasonal variations so that they add up to zero for an additive model. When
using the
multiplicative model, the average seasonal variations should add up to an average of 1.
294 11: Forecasting ⏐ Part F Forecasting
Question
Average seasonal variations
Find the average seasonal variations for the sales data in the previous question (entitled: Four-quarter moving
average trend) using the
multiplicative model.
Answe
r
Spring
Summer
Autumn
Winter
Total
20X7
0.83*
1.42
20X8
1.11
0.71
0.71
1.56
20X9
1.03
0.59
2.14
1.30
1.54
2.98
Spring
Summer
Autumn
Winter
Total
Average variations
1.070
0.650
0.770
1.490
3.980
Adjustment to sum to 4
+
0.005
+
0.005
+
0.005
+
0.005
0.020
Adjusted average variations
1.075
0.655
0.775
1.495
4.000
* Seasonal variation Y/T =
5.192
160
= 0.83
Question
Multiplicative model
In a time series analysis, the multiplicative model is used to forecast sales and the following seasonal variations
apply.
Quarter 1 2 3 4
Seasonal variation 0.8 1.9 0.75 ?
The actual sales value for the last two quarters of 20X1 were:
Quarter 3: $250,000
Quarter 4: $260,000
(a) The seasonal variation for the fourth quarter is:
A 0.55
B –3.45
C 1.00
D 1.45
(b) The trend line for sales:
A remained constant between quarter 3 and quarter 4
B increased between quarter 3 and quarter 4
C decreased between quarter 3 and quarter 4
D cannot be determined from the information given

Part F Forecasting ⏐ 11: Forecasting 295
Answe
r
(a)
The correct answer is A.
As this is a multiplicative model, the seasonal variations should sum (in this case) to 4 (an average of 1) as
there are four quarters.
Let x = seasonal variation in quarter 4.
0.8 + 1.9 + 0.75 + x = 4
∴ 3.45 + x = 4
x = 4 – 3.45
x = 0.55
(b)
The correct answer is B.
For a multiplicative model, the seasonal component is as follows.
S = Y/T
∴ T = Y/S
Quarter
3 4
Seasonal component (S) 0.75 0.55
Actual sales (Y) $250,000 $260,000
Trend (T) (= Y/S) $333,333 $472,727
The trend line for sales has therefore increased between quarter 3 and quarter 4.
3.7 Seasonally-adjusted data
Seasonally-adjusted data (deseasonalised) are data which have had any seasonal variations taken out, so leaving
a figure which might indicate the trend. Seasonally-adjusted data should indicate whether the overall trend is
rising, falling or stationary.
3.8 Example: Seasonally-adjusted data
Actual sales figures for four quarters, together with appropriate seasonal adjustment factors derived from previous
data, are as follows.
Seasonal adjustments
Quarter Actual sales Additive model Multiplicative model
$'000 $'000
1 150 +3 1.02
2 160 +4 1.05
3 164 –2 0.98
4 170 –5 0.95
Required
Deseasonalise these data.
Key term
296 11: Forecasting ⏐ Part F Forecasting
Solution
We are reversing the normal process of applying seasonal variations to trend figures.
The rules for deseasonalising data are as follows.
• Additive model – subtract positive seasonal variations from and add negative seasonal variations to actual
results.
• Multiplicative model – divide the actual results by the seasonal variation factors.
Deseasonalised sales
Quarter Actual sales Additive model Multiplicative model
$'000 $'000 $'000
1 150 147 147
2 160 156 152
3 164 166 167
4 170 175 179
Question
Seasonally-adjusted figures
Unemployment numbers actually recorded in a town for the first quarter of 20X9 were 4,700. The underlying trend
at this point was 4,400 people and the seasonal factor is 0.85. Using the multiplicative model for seasonal
adjustment, the seasonally-adjusted figure (in whole numbers) for the quarter is
A 5,529
B 5,176
C 3,995
D 3,740
Answe
r
The correct answer is A.
If you remembered the ruling that you need to
divide by the seasonal variation factor to obtain seasonally-adjusted
figures (using the multiplicative model), then you should have been able to eliminate options C and D. This might
have been what you did if you weren't sure whether you divided the
actual results or the trend by the seasonal
variation factor.
Seasonally adjusted data =
factor Seasonal
resultsActual
=
85.0
700,4
= 5,529
4 Forecasting
Forecasts can be made by extrapolating the trend and adjusting for seasonal variations. Remember, however,
that all forecasts are subject to error.
FA
S
T F
O
RWAR
D
Part F Forecasting ⏐ 11: Forecasting 297
4.1 Making a forecast
Step 1
Plot a trend line: use the line of best fit method, linear regression analysis or the moving averages
method.
Step 2 Extrapolate the trend line. This means extending the trend line outside the range of known data and
forecasting future results from historical data.
Step 3 Adjust forecast trends by the applicable average seasonal variation to obtain the actual forecast.
(a)
Additive model – add positive variations to and subtract negative variations from the forecast
trends.
(b)
Multiplicative model – multiply the forecast trends by the seasonal variation.
4.2 Example: Forecasting
Use the trend values and the estimates of seasonal variations calculated in Paragraph 3.2 to forecast sales in week
4.
Solution
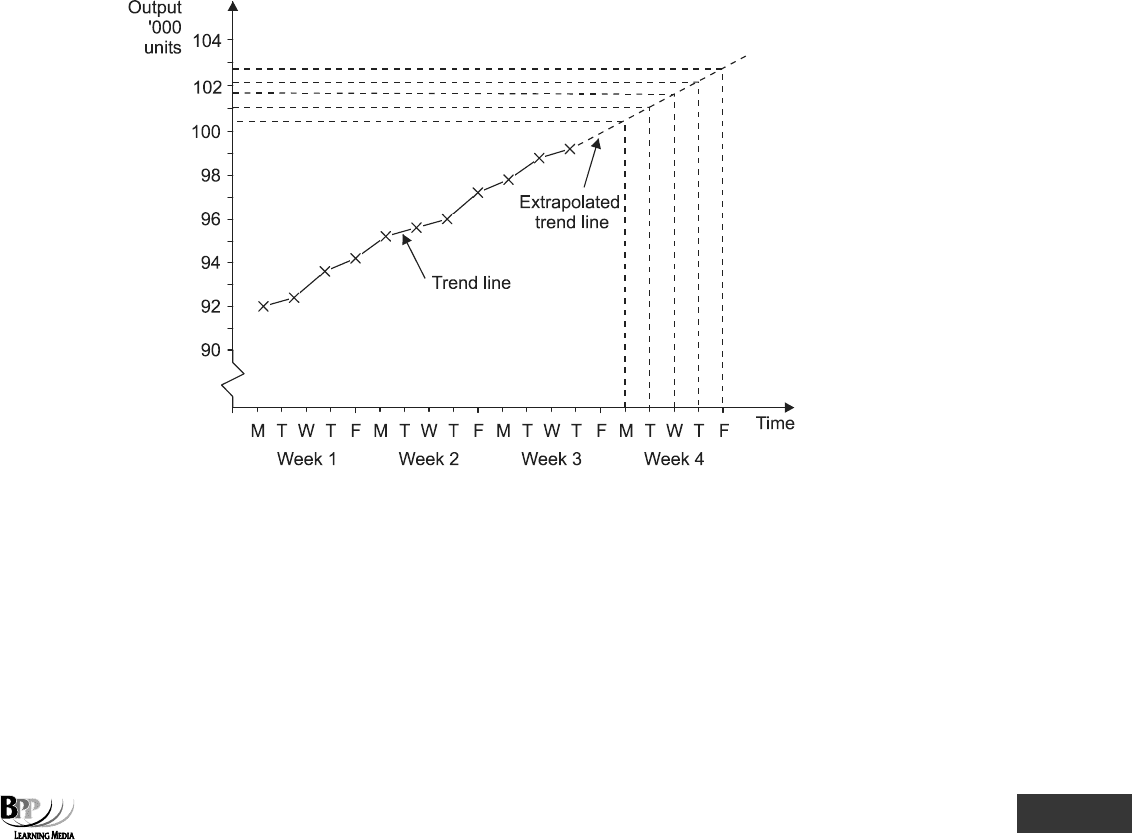
We begin by plotting the trend values on a graph and extrapolating the trend line.
From the extrapolated trend line we can take the following readings and adjust them by the seasonal variations.
Week 4 Trend line readings Seasonal variations Forecast
Monday 100.5 –13 87.5
Tuesday 101.5 +16 117.1
Wednesday 101.7 +1 102.7
Thursday 102.2 +28 130.2
Friday 102.8 –32 70.8
If we had been using the multiplicative model the forecast for Tuesday, for example, would be 101.1
× 1.1645 =
117.7 (from Paragraph 3.4).

298 11: Forecasting ⏐ Part F Forecasting
4.3 Forecasting using linear regression analysis
Correlation exists in a time series if there is a relationship between the period of time and the recorded value for
that period of time. Time is the X variable and
simplified values for X are used instead of year numbers.
For example, instead of having a series of years 20X1 to 20X5, we could have values for X from 0 (20X1) to 4
(20X5).
Using linear regression analysis, a trend line is found to be y = 20 – 2.2X where X = 0 in 20X1 and Y = sales level in
thousands of units. Using the trend line, predicted sales in 20X6 (X = 5) would be:
20 – (2.2
× 5) = 9 ie 9,000 units
Predicted sales in 20X7 (year 6) would be:
20 – (2.2
× 6) = 6.8 ie 6,800 units
Question
Forecast sales
Suppose that a trend line, found using linear regression analysis, is Y = 300 – 4.7X where X is time (in quarters)
and Y = sales level in thousands of units. Given that X = 0 represents 20X0 quarter 1 and that the seasonal
variations are as set out below.
Q
1
Q
2
Q
3
Q
4
Seasonal variations ('000 units) –20 –8 +4 +15
The forecast sales level for 20X5 quarter 4 is
units
Answe
r
206,900
units
Working
X = 0 corresponds to 20X0 quarter 1
∴ X = 23 corresponds to 20X5 quarter 4
Trend sales level = 300 – (4.7
× 23) = 191.9 ie 191,900 units
Seasonally-adjusted sales level = 191.9 + 15 = 206.9 ie 206,900 units
Question
Forecasting
Over a 36-month period, sales have been found to have an underlying linear trend of Y = 14.224 + 7.898X, where Y
is the number of items sold and X represents the month. Monthly deviations from trend have been calculated and
month 37 is expected to be 1.28 times the trend value.
The forecast number of items to be sold in month 37 is approximately
A 389 C 391
B 390 D 392

Part F Forecasting ⏐ 11: Forecasting 299
Answe
r
This is typical of multiple choice questions that you must work through fully if you are to get the right answer.
Y = 14.224 + 7.898X
If X = 37, trend in sales for month 37 = 14.224 + (7.898
× 37)
= 306.45
∴ Seasonally-adjusted trend value = 306.45 × 1.28
= 392.256
∴ The correct answer is 392, option D.
4.4 Residuals
A residual is the difference between the results which would have been predicted (for a past period for which we
already have data) by the trend line adjusted for the average seasonal variation and the actual results.
The residual is therefore the difference which is not explained by the trend line and the average seasonal
variation
. The residual gives some indication of how much actual results were affected by other factors. Large
residuals suggest that any forecast is likely to be unreliable.
In the example in Paragraph 3.2, the 'prediction' for Wednesday of week 2 would have been 95.6 + 1 = 96.6. As the
actual value was 97, the residual was only 97 – 96.6 = 0.4.
5 The limitations of forecasting models
Remember that all forecasts are subject to error. There are a number of factors which will affect the reliability of
forecasts.
5.1 The reliability of time series analysis forecasts
All forecasts are subject to error, but the likely errors vary from case to case.
(a) The further into the future the forecast is for, the more unreliable it is likely to be.
(b) The less data available on which to base the forecast, the less reliable the forecast.
(c) The pattern of trend and seasonal variations cannot be guaranteed to continue in the future.
(d) There is always the danger of random variations upsetting the pattern of trend and seasonal
variation.
(e) The extrapolation of the trend line is done by judgement and can introduce error.
5.2 The reliability of regression analysis forecasts
There are a number of factors which affect the reliability of forecasts made using regression analysis.
Key term
FA
S
T F
O
RWAR
D