CIMA - C3 Fundamentals Of Business Mathematics
Подождите немного. Документ загружается.


260

261
Topic list Syllabus references
1 Correlation D, (i), (ii), (1)
2 The correlation coefficient and the coefficient
of determination
D, (ii), (1)
3 Spearman's rank correlation coefficient D, (ii)
4 Lines of best fit D, (i), (1)
5 The scattergraph method D, (i), (1)
6 Linear regression analysis D, (iii), (2)
7 Using spreadsheets G (i), (iii), (1), (3)
Correlation and
linear regression
Introduction
We looked at scatter diagrams in Chapter 3. We are now going to look at how the inter-
relationship shown between variables in a scatter diagram can be described and calculated.
The first three sections deal with correlation, which is concerned with assessing the strength
of the relationship between two variables.
We will then see how, if we assume that there is a linear relationship between two variables
(such as selling costs and sales volume) we can determine the equation of a straight line to
represent the relationship between the variables and use that equation to make forecasts or
predictions.
262 10: Correlation and linear regression ⏐ Part E Inter-relationships between variables
1 Correlation
When the value of one variable is related to the value of another, they are said to be correlated.
Two variables are said to be correlated if a change in the value of one variable is accompanied by a change in the
value of another variable. This is what is meant by correlation.
1.1 Examples of variables which might be correlated
• A person's height and weight
• The distance of a journey and the time it takes to make it
1.2 Scatter diagrams
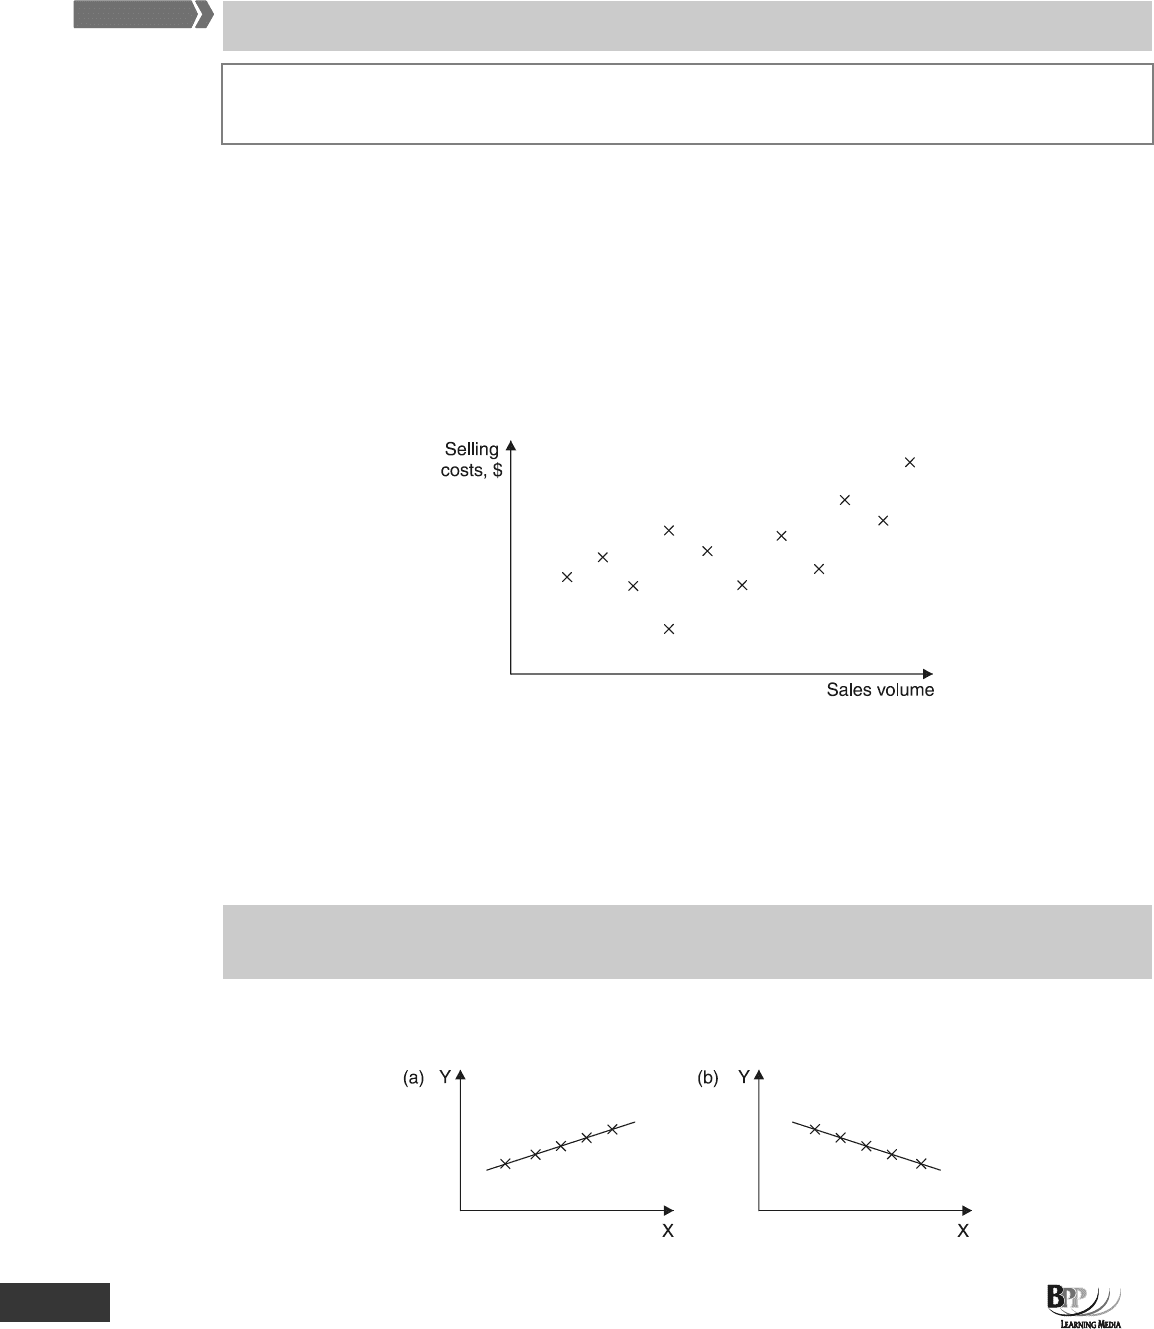
One way of showing the correlation between two related variables is on a scatter diagram, plotting a number of
pairs of data on the graph. For example, a scatter diagram showing monthly selling costs against the volume of
sales for a 12-month period might be as follows.
The independent variable (the cause) is plotted on the horizontal (x) axis and the dependent variable (the effect) is
plotted on the vertical (y) axis.
This scattergraph suggests that there is some correlation between selling costs and sales volume, so that as sales
volume rises, selling costs tend to rise as well.
1.3 Degrees of correlation
Two variables might be perfectly correlated, partly correlated or uncorrelated. Correlation can be positive or
negative.
These differing degrees of correlation can be illustrated by scatter diagrams.
Perfect correlation
Key term
FA
S
T F
O
RWAR
D
Key terms
Part E Inter-relationships between variables ⏐ 10: Correlation and linear regression 263
All the pairs of values lie on a straight line. An exact linear relationship exists between the two variables.
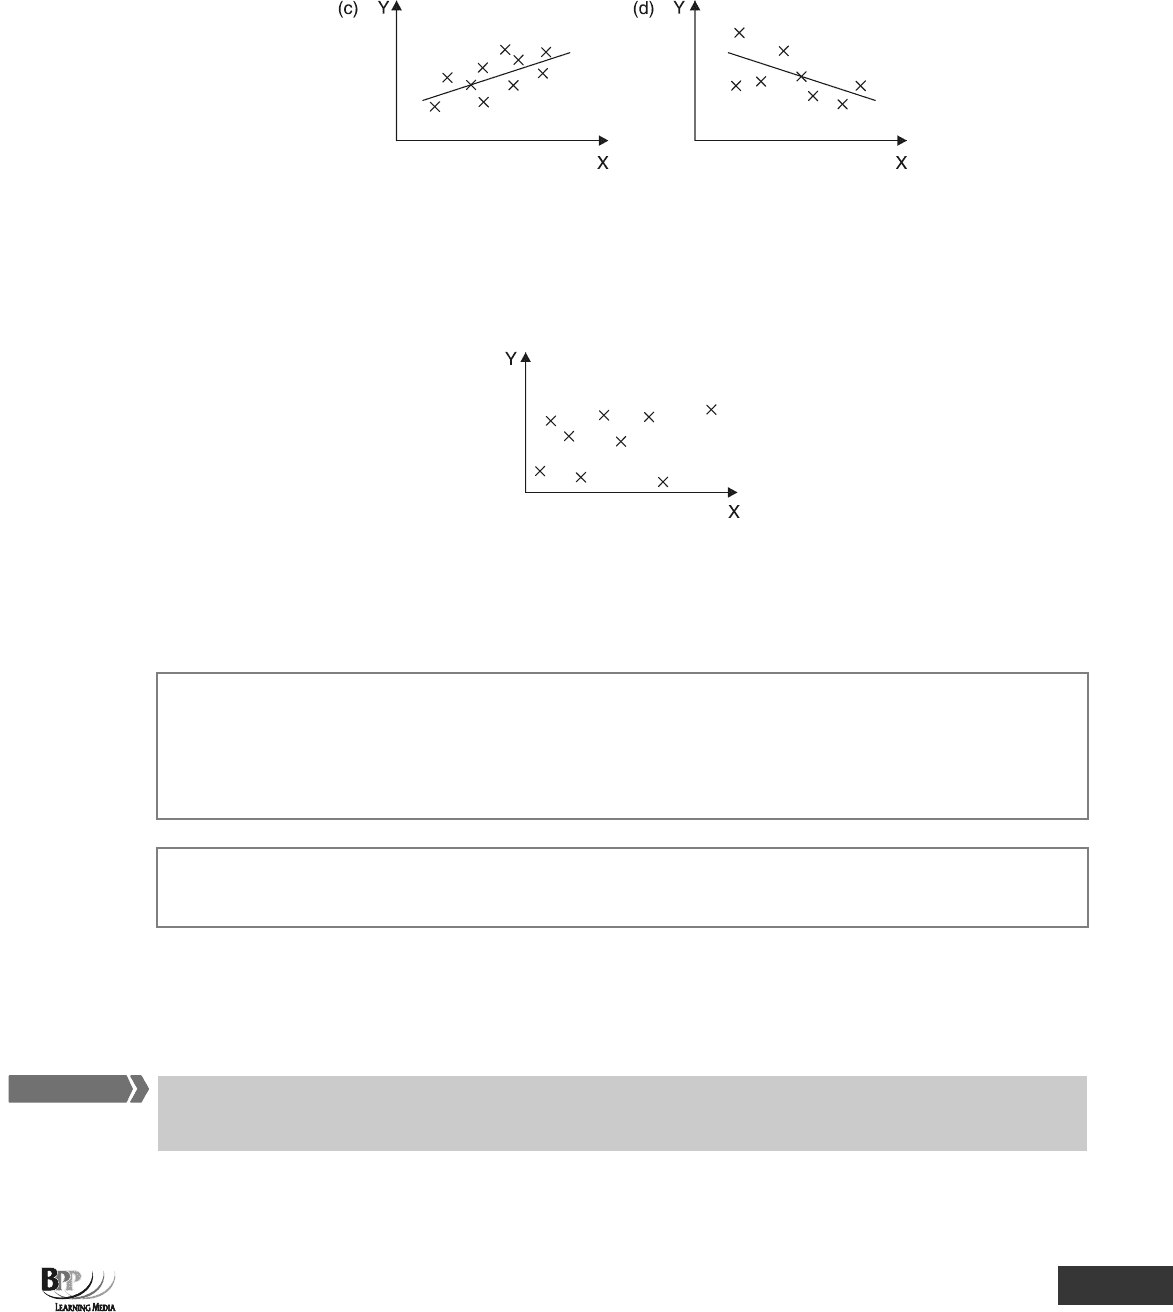
Partial correlation
In (c), although there is no exact relationship, low values of X tend to be associated with low values of Y, and high
values of X with high values of Y.
In (d) again, there is no exact relationship, but low values of X tend to be associated with high values of Y and vice
versa.
No correlation
The values of these two variables are not correlated with each other.
1.4 Positive and negative correlation
Correlation, whether perfect or partial, can be positive or negative.
• Positive correlation means that low values of one variable are associated with low values of the other, and
high values of one variable are associated with high values of the other.
• Negative correlation means that low values of one variable are associated with high values of the other,
and high values of one variable with low values of the other.
An assessment question could ask you to select which one of a collection of scatter diagrams shows a strong
negative linear correlation or a weak positive linear correlation between X and Y.
2 The correlation coefficient and the coefficient of
determination
The degree of correlation between two variables is measured by Pearson's correlation coefficient, r. The nearer r
is to +1 or –1, the stronger the relationship.
Key term
FA
S
T F
O
RWAR
D
Assessment
focus point
264 10: Correlation and linear regression ⏐ Part E Inter-relationships between variables
2.1 The correlation coefficient
Pearson's correlation coefficient, r (also known as the product moment correlation coefficient) is used to
measure how strong the connection is between two variables, known as the degree of correlation.
It is calculated using a formula which will be given to you in the assessment. It looks complicated but with a
systematic approach and plenty of practice, you will be able to answer correlation questions in the assessment.
Correlation coefficient, r =
() ()
22
22
nXY XY
[n X X ] [n Y Y ]
∑−∑∑
∑−∑ ∑−∑
Where X and Y represent pairs of data for two variables X and Y
n = the number of pairs of data used in the analysis
2.2 The correlation coefficient range
The correlation coefficient, r must always fall between –1 and +1. If you get a value outside this range you have
made a mistake.
• r = +1 means that the variables are
perfectly positively correlated
• r = –1 means that the variables are
perfectly negatively correlated
• r = 0 means that the variables are
uncorrelated
2.3 Example: The correlation coefficient
The cost of output at a factory is thought to depend on the number of units produced. Data have been collected for
the number of units produced each month in the last six months, and the associated costs, as follows.
Month Output Cost
'000s of units $'000
X Y
1 2 9
2 3 11
3 1 7
4 4 13
5 3 11
6 5 15
Required
Assess whether there is there any correlation between output and cost.
Solution
r =
() ()
]YYn][XXn[
YXXYn
2
2
2
2
∑−∑∑−∑
∑∑−∑
We need to find the values for the following.
(a) ∑XY Multiply each value of X by its corresponding Y value, so that there are six values for XY. Add up the
six values to get the total.
(b) ∑X Add up the six values of X to get a total. (∑X)
2
will be the square of this total.
Assessment
formula

Part E Inter-relationships between variables ⏐ 10: Correlation and linear regression 265
(c) ∑Y Add up the six values of Y to get a total. (∑Y)
2
will be the square of this total.
(d) ∑X
2
Find the square of each value of X, so that there are six values for X
2
. Add up these values to get a
total.
(e) ∑Y
2
Find the square of each value of Y, so that there are six values for Y
2
. Add up these values to get a
total.
Set out your workings in a table.
Workings
X
Y
XY
X
2
Y
2
2
9
18
4
81
3
11
33
9
121
1
7
7
1
49
4
13
52
16
169
3
11
33
9
121
5
15
75
25
225
∑X =
18
∑Y =
66
∑XY =
218
∑X
2
=
64
∑Y
2
=
766
(∑X)
2
= 18
2
= 324
(∑Y)
2
= 66
2
= 4,356
n = 6
r =
()
]356,4)7666[(]324)646[(
6618)2186(
−××−×
×−×
7
=
()( )
356,4596,4324384
188,1308,1
−×−
−
=
24060
120
×
=
400,14
120
=
120
120
= 1
There is perfect positive correlation between the volume of output at the factory and costs which means that there
is a perfect linear relationship between output and costs.
Question
Correlation
A company wants to know if the money they spend on advertising is effective in creating sales. The following data
have been collected.
Monthly advertising
expenditure
Sales in following
month
$'000 $'000
1.2 132.5
0.9 98.5
1.6 154.3
2.1 201.4
1.6 161.0
Required
Calculate Pearson's correlation' coefficient for the data and explain the result.

266 10: Correlation and linear regression ⏐ Part E Inter-relationships between variables
Answe
r
Monthly advertising
Sales
Expenditure
X
Y
X
2
Y
2
XY
1.2
132.5
1.44
17,556.25
159.00
0.9
98.5
0.81
9,702.25
88.65
1.6
154.3
2.56
23,808.49
246.88
2.1
201.4
4.41
40,561.96
422.94
1.6
161.0
2.56
25,921.00
257.60
7.4
747.7
11.78
117,549.95
1175.07
(
∑X)
2
= 7.4
2
= 54.76
(
∑Y)
2
= 747.7
2
= 559,055.29
r =
]559,055.29)117,549.95[554.76]11.78)[(5
747.7)(7.41,175.07)(5
−××−×
×−×
=
28,694.464.14
5,532.985,875.35
×
−
=
118,795.06
342.37
=
344.67
342.37
= 0.993
0.993 is very close to 1, therefore there is a strong positive correlation and sales are dependent on advertising
expenditure.
2.4 The coefficient of determination, r
2
The coefficient of determination r
2
measures the proportion of the total variation in the value of one variable that
can be explained by variations in the value of the other variable.
Unless the correlation coefficient r is exactly or very nearly +1, –1 or 0, its meaning or significance is a little
unclear. For example, if the correlation coefficient for two variables is +0.8, this would tell us that the variables are
positively correlated, but the correlation is not perfect. It would not really tell us much else. A more meaningful
analysis is available from
the square of the correlation coefficient, r, which is called the coefficient of
determination
, r
2
2.5 Interpreting r
2
In the question above, r = –0.992, therefore r
2
= 0.984. This means that over 98% of variations in sales can be
explained by the passage of time, leaving 0.016 (less than 2%) of variations to be explained by other factors.
Similarly, if the correlation coefficient between a company's output volume and maintenance costs was 0.9, r
2
would be 0.81, meaning that 81% of variations in maintenance costs could be explained by variations in output
volume, leaving only 19% of variations to be explained by other factors (such as the age of the equipment).
FA
S
T F
O
RWAR
D

Part E Inter-relationships between variables ⏐ 10: Correlation and linear regression 267
Note, however, that if r
2
= 0.81, we would say that 81% of the variations in y can be explained by variations in x.
We do not necessarily conclude that 81% of variations in y are
caused by the variations in x. We must beware of
reading too much significance into our statistical analysis.
2.6 Correlation and causation
If two variables are well correlated, either positively or negatively, this may be due to pure chance or there may be
a
reason for it. The larger the number of pairs of data collected, the less likely it is that the correlation is due to
chance, though that possibility should never be ignored entirely.
If there is a reason, it may not be
causal. For example, monthly net income is well correlated with monthly credit to
a person's bank account, for the logical (rather than causal) reason that for most people the one equals the other.
Even if there is a causal explanation for a correlation, it does not follow that variations in the value of one variable
cause variations in the value of the other. For example, sales of ice cream and of sunglasses are well correlated,
not because of a direct causal link but because the weather influences both variables.
3 Spearman's rank correlation coefficient
3.1 Coefficient of rank correlation
In the examples considered above, the data were given in terms of the values of the relevant variables, such as the
number of hours. Sometimes however, they are given in terms of order or
rank rather than actual values.
Spearman's rank correlation coefficient is used when data is given in terms of order or rank, rather than actual
values.
Coefficient of rank correlation, R = 1 –
⎥
⎦
⎤
⎢
⎣
⎡
−
∑
)1n(n
d6
2
2
Where n = number of pairs of data
d = the difference between the rankings in each set of data.
The coefficient of rank correlation can be interpreted in exactly the same way as the ordinary correlation
coefficient. Its value can range from –1 to +1.
3.2 Example: The rank correlation coefficient
The examination placings of seven students were as follows.
Statistics Economics
Student placing placing
A 2 1
B 1 3
C 4 7
D 6 5
E 5 6
F 3 2
G 7 4
Assessment
formula
FA
S
T F
O
RWAR
D

268 10: Correlation and linear regression ⏐ Part E Inter-relationships between variables
Required
Judge whether the placings of the students in statistics correlate with their placings in economics.
Solution
Correlation must be measured by Spearman's coefficient because we are given the placings of students, and not
their actual marks.
R = 1 –
)1n(n
d6
2
2
−
∑
where d is the difference between the rank in statistics and the rank in economics for each student.
Rank Rank
Student Statistics Economics d d
2
A 2 1 1 1
B 1 3 2 4
C 4 7 3 9
D 6 5 1 1
E 5 6 1 1
F 3 2 1 1
G 7 4 3
9
∑d
2
=
26
R = 1 –
)149(7
266
−×
×
= 1 –
336
156
= 0.536
The correlation is
positive, 0.536, but the correlation is not strong.
3.3 Tied ranks
If in a problem some of the items tie for a particular ranking, these must be given an average place before the
coefficient of rank correlation is calculated. Here is an example.
Position of students in examination Express as
A 1 = average of 1 and 2 1.5
B 1 = 1.5
C 3 3
D 4 4
E 5 = 6
F 5 = average of 5, 6 and 7 6
G 5 = 6
H 8 8
Question
Spearman's coefficient
Five artists were placed in order of merit by two different judges as follows.
Judge P Judge Q
Artist Rank Rank
A 1 4 =
B 2 = 1
C 4 3
D 5 2
E 2 = 4 =

Part E Inter-relationships between variables ⏐ 10: Correlation and linear regression 269
Required
Assess how the two sets of rankings are correlated.
Answe
r
Judge P
Judge Q
Rank
Rank
d
d
2
A
1.0
4.5
3.5
12.25
B
2.5
1.0
1.5
2.25
C
4.0
3.0
1.0
1.00
D
5.0
2.0
3.0
9.00
E
2.5
4.5
2.0
4.00
28.50
R = 1 –
()
1255
5.286
−×
×
= – 0.425
There is a
slight negative correlation between the rankings.
4 Lines of best fit
4.1 Strength of a relationship
Correlation enables us to determine the strength of any relationship between two variables but it does not offer
us any method of
forecasting values for one variable, Y, given values of another variable, X.
4.2 Equation of a straight line
If we assume that there is a linear relationship between the two variables and we determine the equation of a
straight line (Y = a + bX)
which is a good fit for the available data plotted on a scattergraph, we can use the
equation for forecasting. We do this by substituting values for X into the equation and deriving values for Y.
4.3 Estimating the equation
There are a number of techniques for estimating the equation of a line of best fit. We will be looking at the
scattergraph method and simple linear regression analysis. Both provide a technique for estimating values for a
and b in the equation, y = a + bx.
5 The scattergraph method
The scattergraph method involves the use of judgement to draw what seems to be a line of best fit through plotted
data.
FA
S
T F
O
RWAR
D