Charlton M., Humberston J.W. Positron Physics
Подождите немного. Документ загружается.


6.1 Introduction and theoretical considerations 269
so that
n
ion
P (n
ion
)=1.
Drachman (1966b), using a rather simple representation of positron–
helium scattering based on a modified form of the adiabatic approxi-
mation, calculated the probabilities of the residual helium ion being in
various states after annihilation and found a 95% probability of its being
in the ground state.
Traditionally, experimental values of Z
eff
have been derived from mea-
surements of the lifetime spectra of positrons that are diffusing, and
eventually annihilating, in a gas. The lifetime of each positron is measured
separately, and these individual pieces of data are accumulated to form
the lifetime spectrum. (The positron-trap technique, to be described in
subsection 6.2.2, uses a different approach.) An alternative but equivalent
procedure, which is adopted in electron diffusion studies and also in the
theoretical treatment of positron diffusion, is to consider the injection
of a swarm of positrons into the gas at a given time and then to inves-
tigate the time dependence of the speed distribution, as the positrons
thermalize and annihilate, by solving the appropriate diffusion equation.
The experimentally measured Z
eff
, termed Z
eff
, is the average over the
speed distribution of the positrons, y(v, t), where y(v, t) dv is the number
density of positrons with speeds in the interval v to v + dv at time t after
the swarm is injected into the gas. The time-dependent speed-averaged
Z
eff
is therefore
Z
eff
(t) =
!
∞
0
Z
eff
(v)y(v, t) dv
!
∞
0
y(v, t) dv
. (6.11)
Assuming that all positrons in the swarm have energies below the
positronium formation threshold and that only elastic collisions and
annihilation are possible, the speed distribution may be derived theo-
retically as the solution of the following diffusion equation (Orth and
Jones, 1969):
∂y(v,t)
∂t
=
∂
∂v
e
2
2
3m
2
nvσ
M
(v)
+
vnσ
M
(v)k
B
T
M
∂y(v,t)
∂v
+
m
2
vnσ
M
(v)
M
−
2e
2
2
3m
2
v
2
nσ
M
(v)
−
2nσ
M
(v)k
B
T
M
y(v, t)
−λ
f
(v)y(v, t), (6.12)
where is the electric field applied across the gas cell, T is the temperature
of the gas, k
B
is Boltzmann’s constant, M is the mass of each gas atom,
σ
M
(v) is the momentum transfer cross section and λ
f
(v) is the annihilation
270 6 Positron annihilation
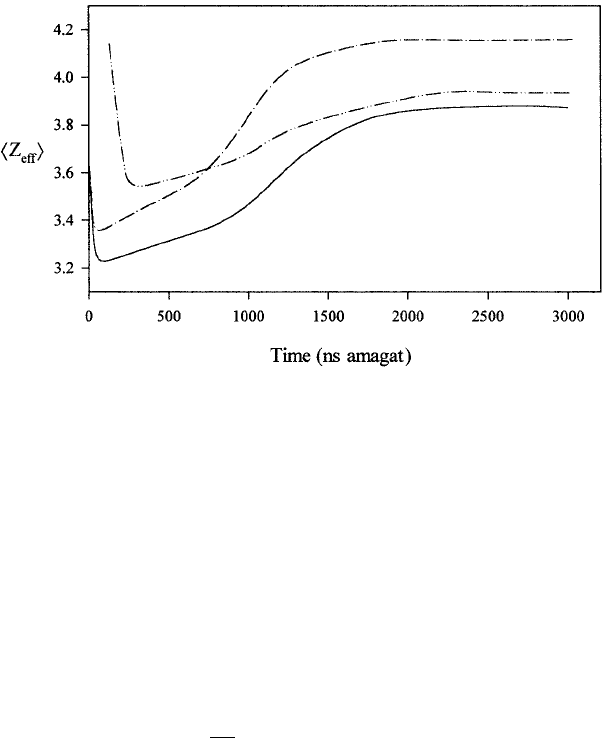
Fig. 6.2. The time dependence of Z
eff
for positrons diffusing in helium gas at
room temperature and zero electric field. Experiment: — ··—, Coleman et al.
(1975b). Theory: ——, helium model H5; — · —, helium model H1, both due
to Campeanu and Humberston (1977b).
rate. The momentum transfer cross section is defined as
σ
M
(v)=2π
π
0
|f(θ)|
2
(1 − cos θ) sin θdθ, (6.13)
which can also be expressed in terms of the partial-wave phase shifts as
σ
M
(v)=
4π
k
2
∞
l=0
(l + 1) sin
2
(η
l
− η
l+1
). (6.14)
Having calculated σ
M
(v) and λ
f
(v) from the elastic scattering wave
function and made a suitable choice of the initial speed distribution
y(v, t = 0), the diffusion equation can then be solved to obtain the
theoretical positron speed distribution for all subsequent times. Provided
a reasonable choice of the initial speed distribution is made, the solution
to the diffusion equation is not very sensitive to its form, except at very
small times after t = 0. The time dependence of Z
eff
(t) obtained in
this way for positrons diffusing in helium gas in zero electric field is
shown in Figure 6.2 (Campeanu and Humberston, 1977b). The input
data for equation (6.12), σ
M
(v) and λ
f
(v), were derived from the phase
shifts and scattering wave functions of Humberston (1973) and Campeanu
and Humberston (1975, 1977a).

6.1 Introduction and theoretical considerations 271
After a sufficiently long time the positrons reach equilibrium, so that
y(v, t)=f(v) exp(−λ
f
t), where λ
f
is the equilibrium annihilation rate
and f(v) is the associated speed distribution, which is the solution of the
time-independent equation
d
dv
e
2
2
3m
2
nvσ
M
(v)
+
vnσ
M
(v)k
B
T
M
df (v)
dv
+
m
2
vσ
M
(v)
M
−
2e
2
2
3m
2
v
2
nσ
M
(ν)
−
2nσ
M
(v)k
B
T
M
f(v)
− λ
f
(v)f(v)
= −λ
f
f(v). (6.15)
The equilibrium value of Z
eff
is then
Z
eff
=
!
∞
0
Z
eff
(v)f(v) dv
!
∞
0
f(v) dv
=
λ
f
πr
2
0
cn
. (6.16)
If the annihilation rate, λ
f
(v), is approximately constant over the width of
the dominant part of the equilibrium speed distribution, so that λ
f
(v)f(v)
≈λ
f
f(v), the solution to equation (6.15) has the form
f(v)=Cv
2
exp
−
v
0
M
3
e
mnv
σ
M
(v
)
2
+ k
B
T
−1
mv
dv
,
(6.17)
where C is the normalization constant. For zero electric field this reduces
to the Maxwell–Boltzmann form
f(v)=Cv
2
exp[−mv
2
/(2k
B
T )].
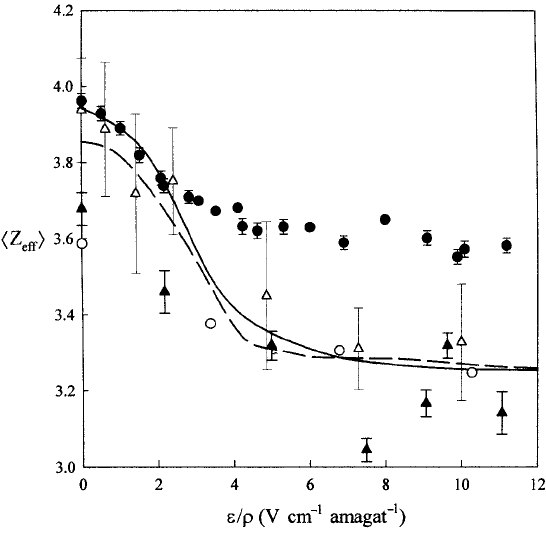
In cases where the annihilation rate, and hence Z
eff
, is a rapidly varying
function of the positron energy, as with xenon (Schrader and Svetic,
1982), the simplification introduced above is not valid and the solution
to equation (6.15) must be used. The functional form for f(v) given
in equation (6.17) was used by Campeanu and Humberston (1977b) to
investigate the variation of the equilibrium value of Z
eff
with electric
field and temperature, and their results for the former are shown in
Figure 6.3.
The experimental techniques involved in measuring the angular corre-
lation and the Doppler broadening of the two annihilation gamma-rays
were introduced in section 1.3. These techniques rely on the fact that
the motion of the positron–electron pair immediately prior to annihi-
lation causes the two gamma-rays to be emitted in directions differing
272 6 Positron annihilation
Fig. 6.3. Values of Z
eff
for helium gas at various density-normalized electric
fields and at (•) 35.7 amagat and () 3.5 amagat, from Davies, Charlton and
Griffith (1989); ◦, Leung and Paul (1969); , Lee, Orth and Jones (1969). The
results of the calculations of Campeanu and Humberston (1977b) (——) and
Shizgal and Ness (1987) (– – –) are also given.
by an angle θ from exact collinearity and with energies shifted from
511 keV. Thus, measuring the angular correlation between the gamma-
rays provides information about the momentum distribution of the anni-
hilating electron–positron pairs. In many cases it can be assumed that
the positrons have thermalized before annihilation, so that the momen-
tum of the pair is predominantly that of the electron alone. However,
the attractive positron–atom interaction causes the positron to speed
up slightly as it approaches an atom, and the electrons also have their
velocities modified by the attraction towards the positron. Therefore, the
momentum distribution of an annihilating positron–electron pair is not
identical to the momentum distribution of the electrons in an undistorted
atom.
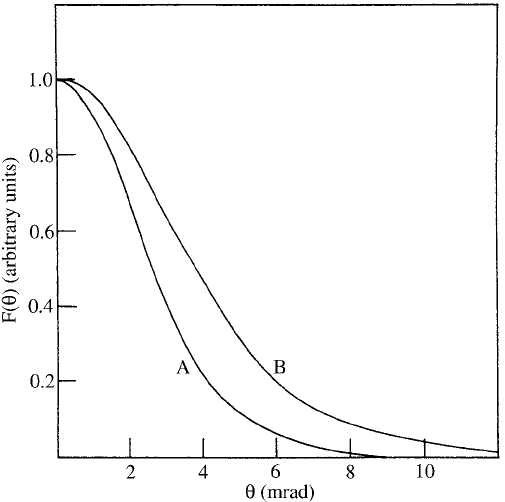
6.1 Introduction and theoretical considerations 273
Fig. 6.4. Angular correlation function F (θ) for the two-gamma annihilation of
thermal energy positrons incident on atomic hydrogen: A, F (θ) obtained using
the accurate variationally determined wave function; B, F (θ) obtained in the
Born approximation.
The probability that the annihilating electron–positron pair has a mo-
mentum p is proportional to
Γ(p)=
|exp(−ip ·r
1
)Ψ(r
1
, r
2
,...,r
Z+1
)δ(r
1
−r
2
)|
2
dr
1
dr
2
···dr
Z+1
.
(6.18)
In many determinations of angular correlation functions for positrons
annihilating in gases, only the angle between the two gamma-rays as
projected onto a given plane is measured; therefore, in order to make
comparison with experiment, the theoretical angular correlation function
for the two gamma-rays should be integrated with respect to two compo-
nents of the momentum to give the distribution function,
F (θ)=
Γ(p
x
= mcθ, p
y
,p
z
) dp
y
dp
z
. (6.19)
As an example, the angular distribution function for positrons annihi-
lating in atomic hydrogen, obtained using the accurate variational wave
function for zero energy positron–hydrogen scattering described in section
274 6 Positron annihilation
3.2 (Humberston and Wallace, 1972), is shown in Figure 6.4. Also shown
there is the distribution function obtained using the Born approximation,
in which neither the positron nor the atomic wave function is modified
by the interaction. This latter curve therefore represents the momentum
distribution of the electron in the undistorted hydrogen atom. The distri-
bution function for the accurate wave function is narrower than that for
the undistorted case because the positron attracts the electron towards
itself and away from the nucleus, thereby enhancing the probability of
low values of the momentum of the pair.
Instead of measuring the angular correlation between the two annihi-
lation gamma-rays, the same information concerning the momentum
distribution of the annihilating pair can be obtained by measuring the
Doppler shift ∆E
γ
in the energy of either of the gamma-rays. This shift is
related to the angle, π − θ, between the gamma-rays by ∆E
γ
= mc
2
θ/2,
so that the energy in keV of either of the gamma-rays is related to
the angle θ in milliradians by E
γ
= 511(1 + θ/2) keV. This Doppler
shift technique has recently been successfully employed by Surko and
coworkers using thermalized positrons annihilating in a Penning trap (see
subsection 6.3.5).
6.2 Experimental details
1 The traditional positron lifetime method – analysis and
observables
The basic principle behind positron lifetime spectroscopy is simple. A
timing signature is obtained when a positron is emitted from a radioac-
tive isotope and also when it annihilates. By measuring the difference
between these times for 10
6
–10
7
positrons, a lifetime spectrum is obtained
from which various annihilation rates and associated parameters can be
derived. Schematic illustrations encapsulating the methodology of the
most commonly encountered positron lifetime spectrometry were shown
in Figure 1.4. The technical level of the discussion in subsection 1.3.1 is
sufficient for the present purposes. Further details can be found in the
original paper of Coleman et al. (1974), who developed a system to fa-
cilitate precision measurements of annihilation parameters in low density
gases. A concise summary of techniques relevant to positron annihilation
in gases was given by Griffith and Heyland (1978). The overall design of
lifetime apparatus has not changed significantly since then, though there
have been advances in the commercially available timing electronics and
in data storage and analysis.
Lifetime spectra obtained for the noble gases argon and xenon are
shown in Figures 6.5(a) and (b) respectively. These spectra serve to
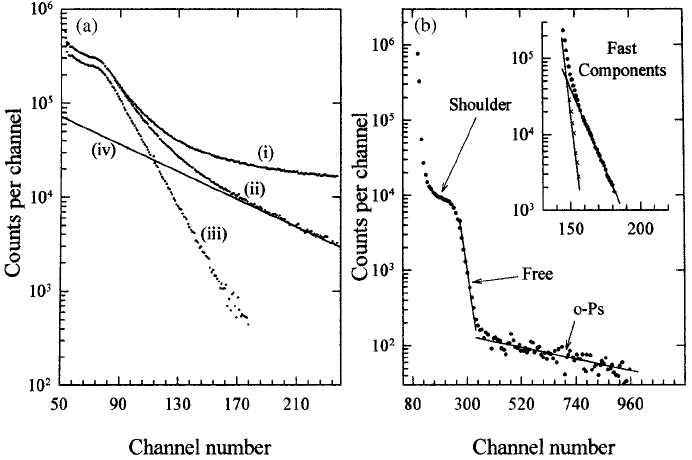
6.2 Experimental details 275
Fig. 6.5. Examples of
positron lifetime spectra for (a) argon and (b) xenon
gases. The argon data are for a density of 6.3 amagat at 297 K. The channel
width is 1.92 ns. In (a), (i) shows the raw data, (ii) sho
ws the signal with
background removed, (iii) shows the free-positron component and (iv) shows the
fitted ortho-positronium componen
t. In (b), the spectrum for xenon is for room
temperature and 9.64 amagat and has a channel width of 0.109 ns. The inset
shows the fast components as extracted and discussed by Wright et al. (1985).
illustrate both the type of data analysis applied and the parameters
which can be derived. The argon spectrum shows the raw data obtained,
including the background contribution. Full discussions of the sources of
such background events can be found in the works of Coleman, Griffith
and Heyland (1974) and Coleman (1979).
Once the background is subtracted, the component of the spectrum
due to the annihilation of ortho-positronium is usually visible (see Fig-
ure 6.5(a), curve (ii) and the fitted line (iv)). The analysis of the spectrum
can now proceed, and a number of different methods have been applied
to derive annihilation rates and the amplitudes of the various compo-
nents. One method, introduced by Orth, Falk and Jones (1968), applies
a maximum-likelihood technique to fit a double exponential function to
the free-positron and ortho-positronium components (where applicable).
Alternatively, the fits to the components can be made individually, if their
decay rates are sufficiently well separated, by fitting to the longest compo-
nent (usually ortho-positronium) first and then subtracting this from the
276 6 Positron annihilation
signal data to leave the free-positron signal. The main assumption built
into this, as in other methods of analysis, is that the ortho-positronium
component can be described by a single exponential back to zero time.
The shoulder width of the positron lifetime spectrum corresponds to
the annihilation of free positrons as they slow down through the en-
ergy interval from just below the positronium formation threshold energy
towards thermal energies. The region of the spectrum in which both
the ortho-positronium and free-positron components are exponential is
usually termed the equilibrium region, since the measured annihilation
rates no longer vary with time. From the discussion given earlier this
does not necessarily mean that the positrons (or ortho-positronium) have
thermalized, only that the associated annihilation parameters, Z
eff
for
the positrons and
1
Z
eff
for ortho-positronium, see equation (6.20) and
section 7.3, do not have an observable time dependence.
A second method used to analyse positron lifetime spectra is based on
the POSITRONFIT programme (see Kirkegaard, Pederson and Eldrup,
1989). Here, too, the individual components of the spectrum are assumed
to be of exponential form, but the fit also contains a resolution function
which can be a sum of Gaussians and which is normally measured using a
well-characterized reference sample. This procedure has not been widely
applied in gas lifetime studies because, in most cases, the presence of a
large peak in the spectrum at short times, arising
from positrons annihi-
lating in the walls of the chamber, precludes a detailed analysis in this
time region. This feature, which is commonly referred to as the ‘prompt
peak’, is particularly visible in the xenon spectrum shown in Figure 6.5(b).
The analyses described above can be applied directly to the equilibrium
region of a lifetime spectrum. However, in atomic gases, where slowing
down below the positronium formation threshold is by elastic collisions
only, the positron speed distribution y(v, t) varies relatively slowly with
time. Consequently the annihilation rate also varies slowly with time.
From Figures 6.5(a) and (b) the existence of a non-exponential, or so-
called shoulder, region close to t = 0 is evident, and the analysis of this
region must be treated separately, as outlined below. Further details of
the shape and length of the shoulder can be found in subsection 6.3.1
below.
We now consider the parameters, listed below as (i)–(x) (Heyland et al.,
1982), which can be derived from analysis of a gas lifetime spectrum.
(i) The total number of signal events is N
S
, which includes gas events
and also, if applicable, events due to annihilation in the source and
in the chamber walls (which make up the bulk of the prompt peak).
(ii) Using the method(s) of analysis described earlier, the number of
events in each of the resolvable components of the spectrum can
6.2 Experimental details 277
be derived by back-extrapolation of the fitted component to t =0.
(This is not applicable to the noble gases, which exhibit a non-
equilibrium shoulder, but it can be applied to molecular gases where
there is usually no such feature.) This can yield the numbers of
ortho-positronium and free-positron events, N
o-Ps
and N
f
respec-
tively, plus the number N
F
due to any other (faster) components,
if present. In fact N
o-Ps
may have to be corrected to allow for any
difference in the detection efficiencies of ortho-positronium and free
events that arises from their different annihilation modes. This is
important because it allows absolute positronium fractions to be
determined; see (vi) below and Coleman et al. (1975a).
(iii) The number of para-positronium events which contribute to the gas
spectrum but which cannot normally be resolved because of the
presence of the prompt peak is assumed to be N
o-
Ps
/3, based upon
the spin statistics which govern the relative formation probabilities.
Hence the total number of positronium events is N
Ps
=4N
o-Ps
/3.
(iv) The total number of gas events, N
G
, is then defined by N
G
=
4N
o-Ps
/3+N
f
+ N
F
.
(v) The quantity G = N
G
/N
S
, the gas fraction, can be deduced and used
to compare the stopping power of different gases for
β
+
particles.
Furthermore, an unexpectedly low measured value of G could indi-
cate the presence of fast components in the spectrum which cannot
be resolved from the prompt peak.
(vi) The positronium fraction F is one of the most widely quoted observ-
ables in positron lifetime work and it can be defined as F = N
Ps
/N
G
.
(vii) A mean value, λ
p
, for the ortho-positronium decay rate can be
determined from the equilibrium portion of the spectrum. This
represents the sum of the self-annihilation rate,
0
λ
o-Ps
, and that due
to quenching in collisions with the surrounding medium. Thus λ
p
is usually written as
λ
p
=
0
λ
o-Ps
+ qρ
=
0
λ
o-Ps
+0.804ρ
1
Z
eff
(µs
−1
), (6.20)
where ρ was defined in equation (6.3), q is the so-called quenching
coefficient and, following Fraser (1968),
1
Z
eff
is a measure of the
effective number of electrons per atom or molecule responsible for
quenching. All averages are over the positronium speed distribution
at annihilation. Values of
1
Z
eff
are discussed in Chapter 7, which
deals with positronium and its interactions with other systems,

278 6 Positron annihilation
along with the range of validity of equation (6.20) in various gaseous
media.
(viii) As mentioned above, the time spectrum for free-positron annihi-
lation, S
f
(t), can be obtained from the total gas spectrum G(t) once
the ortho-positronium component has been fitted. The subtraction
of the assumed exponential ortho-positronium component can be
written as
S
f
(t)=G(t) −λ
p
N
o-Ps
exp(−λ
p
t). (6.21)
The instantaneous free-positron annihilation rate is particularly use-
ful where it is time dependent (i.e. on the shoulder region); it is
defined as
λ
f
(t) =
S
f
(t)
!
∞
0
S
f
(t
) dt
=0.201ρZ
eff
(t) (µs
−1
), (6.22)
where Z
eff
(t) is defined by equation (6.11). At the end of the
shoulder region Z
eff
(t) tends to Z
eff
, the equilibrium value given
by equation (6.16). The experimental value of Z
eff
(t) can be
compared with the theoretical speed-average of the calculated values
of Z
eff
(v), equation (6.11), the speed distribution being obtained by
solving the diffusion equation (6.12).
(ix) The shoulder width is expressed in density-independent terms as
τ
s
ρ, usually given in ns amagat, where τ
s
was defined by Paul and
Leung (1968) as the time for which
Z
eff
(τ
s
) = Z
eff
−0.1∆Z, (6.23)
with ∆Z = Z
eff
−Z
min
, where Z
min
is the minimum value of
Z
eff
(t) on the shoulder region; see Griffith and Heyland (1978) for
an example.
(x) If there are any fast components in the spectrum which can be
resolved from the prompt peak, as, e.g. in the case of xenon, shown
in Figure 6.5(b), then their presence can be revealed if Z
eff
(t) rises
abruptly before the prompt peak has been reached. The spectrum
of such components can only be deduced by subtraction of the
free-positron component, which requires assumptions to be made
concerning the shape of the shoulder.
2 The positron-trap method for positron–gas studies
Since the mid-1980s a new and radically different method of studying
positron annihilation in gases has been developed by Surko and coworkers.