Charlton M., Humberston J.W. Positron Physics
Подождите немного. Документ загружается.

6.3 Results – positron annihilation 299
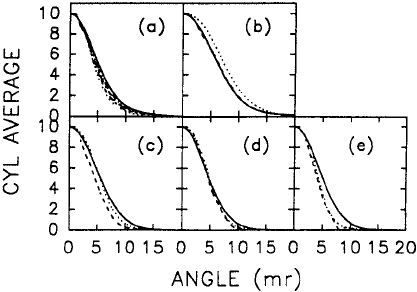
Fig. 6.15. Cylindrically averaged angular correlation of annihilation radiation
(ACAR) distributions for positron annihilation in the noble gases, (a) helium,
(b) neon, (c) argon, (d) krypton and (e) xenon, from the work of Coleman
et al. (1994). Reprinted from Journal of Physics B27, Coleman et al., Angular
correlation studies of positron annihilation in the noble gases, 981–991, copyright
1994, with permission from IOP Publishing.
the amplitude of this component, using the known positronium fraction
as deduced from lifetime studies (see section 4.8) and the known extent
of the mixing of the ortho-positronium component. The krypton and
xenon data, however, could be adequately described by a single Gaussian
and thus the results of the fits cannot be solely due to free-positron
annihilation.
There is no rigorous justification for assuming a Gaussian fit to the
data, and accurate theoretical and experimental results for helium clearly
show the deviations from the Gaussian form out on the wings of the
distribution; see Figure 6.16 and the discussion at the end of this section.
Nevertheless, this form does provide a reasonably good approximation to
most of the data.
The positron-trap technique has been used by Surko and coworkers
to measure the Doppler broadening of the 511 keV line for positrons
in helium gas. This method does not have the drawback of the ex-
periment described above, in which both positronium and free-positron
events overlap on the angular distribution curves; here the positrons are
thermalized prior to the introduction of the gas and therefore cannot
form positronium. A comparison of the theoretically predicted and ex-
perimentally measured Doppler spectra (Van Reeth et al., 1996) is shown
in Figure 6.16. The theoretical results were obtained from the variational
wave functions for low energy positron–helium scattering calculated by
Van Reeth and Humberston (1995b); see equations (3.75) and (3.77).
300 6 Positron annihilation
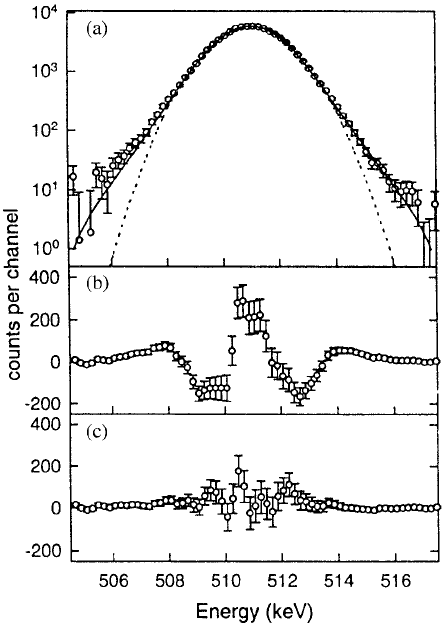
Fig. 6.16. (a) Annihilation gamma-ray spectrum for positrons interacting with
helium atoms. The full curve is the theoretical prediction (see text) convoluted
with the detector response function, whilst the dotted curve is a Gaussian fit to
the experimental data (◦). (b) Residuals from the Gaussian fit and (c) residuals
from the theory. Reprinted from Journal of Physics B29, Van Reeth et al.,
Annihilation in low energy positron–helium scattering, L465–L471, copyright
1996, with permission from IOP Publishing.
Before comparing with experiment, however, the theoretical results at an
energy of 40 meV (equivalent to room temperature) were convoluted with
the energy resolution function of the detector used for the measurement.
This procedure was adopted because deconvolution of the experimental
data was found to be numerically unstable. The convoluted theoretical
data were then normalized to the experimental data at zero Doppler
shift to yield the results shown. The agreement between the convoluted
theoretical results and experiment is extraordinarily good, extending as it
does over more than three orders of magnitude. These results also reveal
6.4 Positron drift 301
that the shape of the gamma-ray spectrum is not Gaussian, in contrast to
what has frequently been assumed in the past (see above). Nevertheless,
Van Reeth et al. (1996) also fitted a Gaussian to the data and derived a
Doppler FWHM of 2.53 ± 0.03 keV, corresponding to an angular width
of 9.90 ± 0.12 mrad. This is to be compared with the values 10.30 ± 0.05
mrad obtained by Coleman et al. (1994) and 9.4 ± 0.5 mrad found by
Stewart et al. (1990), for liquid helium. Iwata, Greaves and Surko (1997)
also studied Doppler broadened spectra for argon, krypton and xenon
and were able to observe contributions from annihilation with inner shell
electrons.
6.4 Positron drift
The study of positron drift in gases has been very limited, in contrast
to the vast literature available for electrons (e.g. Huxley and Crompton,
1974). The reason for this lies in the experimental difficulties in ob-
taining a drift time and distance such that the drift speed for positrons,
v
+
, can be computed. An ideal positron-drift experiment would involve
the injection of a burst of low energy positrons into a scattering cell
at a precisely known time; transport of the positrons through the cell
and on to a detector would then be accurately evaluated to yield the
mobility, µ
+
= v
+
/ (Charlton and Jacobsen, 1987). Unfortunately an
experiment of this kind has not yet been carried out. In this section we
give brief descriptions of two experimental arrangements which have been
employed to measure positron drift, though so far with a limited degree
of applicability.
The first observations of positron drift were made by Rodionov, San-
nikov and Solodov (1969, 1971) for helium gas. Their method was later
adopted and improved by Paul and coworkers (Paul and Tsai, 1979;
Paul and B¨ose, 1982; B¨ose, Paul and Tsai, 1981) and we present here
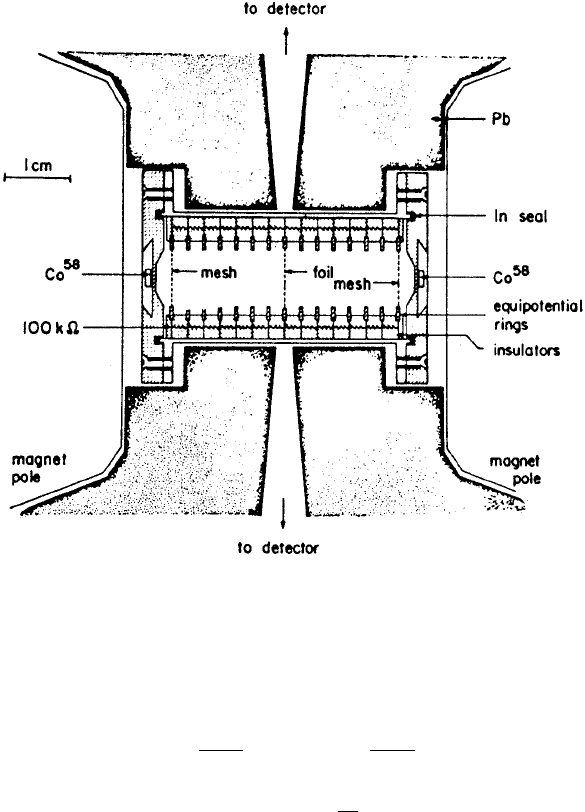
a description of the latter apparatus only; this is shown schematically in
Figure 6.17 (Paul and B¨ose, 1982). Positrons from two
58
Co sources were
confined to the axis of a 4 cm long chamber by a uniform magnetic field
of approximately 0.12 T. A small fraction of the positrons thermalized
in the gas, uniformly throughout the length of the chamber owing to the
low pressures used (typically well below 10
5
Pa). These positrons could
then be drifted along the chamber by application of an electric field,
using a ring and grid arrangement and the equipotential target foil which
served to terminate the drift. This foil, which was chosen to be a 600
˚
A carbon film in order to reduce annihilation of the fast positrons, was
viewed by a pair of detectors located behind the apertures in the lead
shielding.
302 6 Positron annihilation
Fig. 6.17. Schematic illustration of the positron-drift apparatus used by Paul
and coworkers.
Paul and Tsai (1979) showed that the fraction F
d
of positrons which
drift into the foil after stopping in the gas is given by
F
d
=
v
+
λ
f
l
1 − exp
−
λ
f
l
v
+
= X
1 − exp
−
1
X
, (6.28)
where l is the maximum drift distance and λ
f
is the annihilation rate
in the gas. At higher fields, when positronium formation is possible, λ
f
will be augmented by the rate at which this latter process occurs. An
additional assumption made in arriving at equation (6.28) was that the
diffusion length is much smaller than the drift length. This, in general,
may not be true, and a more sophisticated analysis of the drift and
diffusion problem was given by Paul and Tsai (1979).
Coincidences due to positron annihilation at the foil were recorded for
various values of /ρ and at several pressures of molecular hydrogen in
the range 10–200 torr. From these the data at 100 torr were selected for
6.4 Positron drift 303
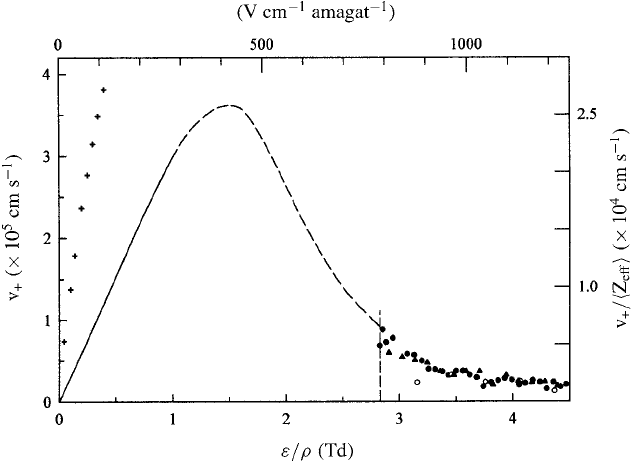
Fig. 6.18. Results from the positron-drift experiments of Paul and coworkers.
The full curve is v
+
/Z
eff
, obtained from a fit to all the data; see text for
details. Electron drift velocities (+) are shown for comparison on the left-hand
scale. The points to the right of the vertical broken line were taken from runs
at molecular hydrogen pressures of 50 torr (•), 25 torr () and 10 torr (◦).
an analytic fit to F
d
, equation (6.28), in terms of the parameter X. This
parameter was density scaled, setting X
c
= Xρ/ρ
c
, to give the shape
of the other curves from F
c
d
= X
c
[1 − exp(−1/X
c
)]; X was then varied
to optimize the fits at all the other pressures. Using values for X and
Z
eff
(the latter assumed to be independent of electric field), a curve of
v
+
/Z
eff
was obtained, and this is shown in Figure 6.18 along with the
derived values of v
+
and the corresponding values for electrons (Huxley
and Crompton, 1974).
The broken-line portion of the v
+
/Z
eff
curve, which attains a max-
imum and then falls, was explained by B¨ose, Paul and Tsai (1981) in
terms of the formation of positronium due to positron heating in the
electric field, so that the apparent value of Z
eff
rises as the amount
of positronium formation increases. At high electric fields nearly all the
positrons form positronium and do not annihilate at the foil.
As shown in Figure 6.18, electron drift velocities below /ρ =1Td
(≡ 10
17
Vcm
2
) are at least four times larger than those for positrons.
B¨ose, Paul and Tsai (1981) attributed this difference to higher momentum
transfer cross sections for positrons than for electrons at very low (i.e.
304 6 Positron annihilation
thermal) energies. The total cross section for electrons is approximately
9 × 10
−16
cm
2
at 0.2 eV and it falls as the kinetic energy is lowered. As
described in subsection 2.6.1, the total cross section for positron scat-
tering in H
2
rises rapidly with decreasing energy at the lowest energies
investigated, lending some plausibility to the proposed explanation. Other
measurements have been made with this system (Paul, 1993, 1995, private
communications), though results for v
+
have not been extracted.
The other apparatus used to study positron drift in a range of molec-
ular gases has been described by Charlton (1985b) and Charlton and
Laricchia (1986). It consisted of two electrodes 10.35 mm apart, which
also formed the walls of the gas chamber and between which a poten-
tial difference could be applied. Positrons emitted from a
22
Na source
were detected using the thin plastic scintillator method (e.g. Coleman,
Griffith and Heyland, 1973). Most positrons entered the gas chamber
through a thin window and annihilated in the metal walls of the cell.
The annihilation gamma-rays were detected using a large plastic
scintil-
lator. Approximately 0.1% of the β
+
particles stopped in the gas, where
they annihilated as free positrons or after forming positronium or, in
the absence of an electric field, after randomly diffusing to a wall of the
chamber.
When an electric field was applied across the chamber some positrons
annihilated prematurely, following field-induced drift to one of the elec-
trodes. In this case the free-positron component of the lifetime spectrum
was field dependent; the maximum drift time, τ
md
, was given by the
end-point of the lifetime spectrum and was due to thermalized positrons
which had traversed the entire drift length l. The drift speed was then
v
+
= l/τ
md
and the mobility could be found from
µ
+
= l/τ
md
. (6.29)
Charlton (1985b) selected O
2
and CO
2
gases for investigation. Experi-
ments had shown (e.g. Wright, 1982) that the ortho-positronium compo-
nent is rapidly quenched in the former, so that at 400 torr the lifetime
is only around 30 ns. Thus, the free-positron spectrum is well separated,
and despite the low signal-to-background ratio, τ
md
is relatively easy to
discern. The latter gas was selected because, even at low densities, there
is sufficient stopping power to ensure adequate statistical accuracy of the
data. Examples of truncated lifetime spectra are given in Figure 6.19(a).
Nevertheless, the major source of error in these measurements still lay in
the determination of τ
md
, which could only be evaluated with approxi-
mately 10%–15% accuracy.
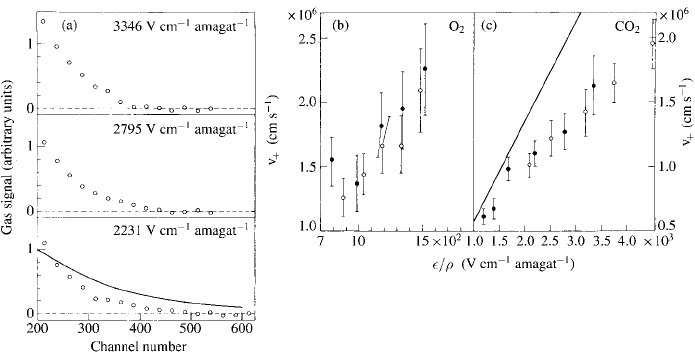
The drift velocities for O
2
and CO
2
at various fields and at two different
pressures are shown in Figures 6.19(b) and (c). The velocities were mea-
sured at values of /ρ in the ranges 1200–4500 V cm
−1
amagat
−1
for CO
2
6.4 Positron drift 305
Fig. 6.19. (a) The free-positron component with electric fields applied to 0.26
amagat of CO
2
, illustrating the truncation of the spectra. The solid curve is a
schematic illustration of this component with zero applied field. (b) Positron
drift velocities for O
2
at various density-normalized electric fields: •, 600 torr;
◦, 400 torr. (c) As (b), but for CO
2
: •, 200 torr; ◦, 100 torr. The solid line
represents the corresponding electron drift velocities.
and 800–1700 V cm
−1
amagat
−1
for O
2
. It was assumed, with reference
to the corresponding work over these ranges of /ρ for electrons, that
the positrons remain in thermal equilibrium with the gas. The density-
normalized values of the mobilities were found to be (1.44 ± 0.19) × 10
3
cm
2
V
−1
s
−1
amagat for O
2
and (4.78 ±0.42) ×10
2
cm
2
V
−1
s
−1
amagat
for CO
2
. These results correspond to (3.9 ± 0.5) × 10
22
(V cm s)
−1
and
(1.29 ± 0.11) × 10
22
(V cm s)
−1
respectively.
Also shown in Figure 6.19(c) is the line which corresponds to the
average electron mobility for CO
2
in the same /ρ range. These data were
extracted from the results of Peisert and Sauli (1984) and Christophorou
(1971), and correspond to a density-normalized mobility of 600 cm
2
V
−1
s
−1
amagat. In the case of O
2
this quantity for electrons is approxi-
mately 4.5×10
3
cm
2
V
−1
s
−1
amagat (Crompton and Elford, 1973) at low
/ρ, though this falls sharply to 2.8 × 10
3
cm
2
V
−1
s
−1
amagat as /ρ is
increased to 10
3
Vcm
−1
amagat
−1
. If one considers the /ρ-independent
values for electrons, then in each case the mobility of electrons is greater
than that of positrons. As was the case for H
2
, this can probably be
attributed to the relative behaviour of the momentum transfer cross
sections at very low energies.
Several other molecular gases have been investigated using this tech-
nique, and the results presented by Charlton and Laricchia (1986) are

306 6 Positron annihilation
Table 6.4. Values of density-normalized positron mobility (in cm
2
V
−1
s
−1
amagat) for various molecular gases at T = 297 K. Uncertainties are around
10%–15%
Gas Mobility
H
2
1940
D
2
2200
O
2
1440
N
2
1560
CO 1430
CO
2
480
CH
4
370
SF
6
300
given in table 6.4. In the case of H
2
, we can compare the value 1940
cm
2
V
−1
s
−1
amagat for the mobility with the value 1100 cm
2
V
−1
s
−1
am-
agat derived from the work of B¨ose, Paul and Tsai (1981). The dis-
crepancy between the two measurements is greater
than the combined
errors, though given the very different nature of the experiments and the
difficulty in extracting drift velocities for positrons it is perhaps gratifying
to find agreement within a factor of two. Further work on positron drift
is desirable since it can complement beam measurements, particularly at
energies below approximately 1 eV.
7
Positronium and its interactions
In this chapter we consider the physics of the positronium atom and what
is known, both theoretically and experimentally, of its interactions with
other atomic and molecular species. The basic properties of positronium
have been briefly mentioned in subsection 1.2.2 and will not be repeated
here. Similarly, positronium production in the collisions of positrons with
gases, and within and at the surface of solids, has been reviewed in section
1.5 and in Chapter 4. Some of the experimental methods, e.g. lifetime
spectroscopy and angular correlation studies of the annihilation radiation,
which are used to derive information on positronium interactions, have
also been described previously. These will be of most relevance to the
discussion in sections 7.3–7.5 on annihilation, slowing down and bound
states. Techniques for the production of beams of positronium atoms were
introduced in section 1.5. We describe here in more detail the method
which has allowed measurements of positronium scattering cross sections
to be made over a range of kinetic energies, typically from a few eV up
to 100–200 eV, and the first such studies are summarized in section 7.6.
Important advances continue to be made in measurements of the in-
trinsic properties of the positronium atom, e.g. its ground state lifetimes
(Rich, 1981; Al-Ramadhan and Gidley, 1994; Asai, Orito and Shinohara,
1995) and various spectroscopic quantities (Berko and Pendleton, 1980,
Mills, 1993; Hagena et al., 1993). These are reviewed in section 7.1.
7.1 Fundamental studies with the positronium atom
1 Lifetimes against annihilation
Since the earliest work with positronium by Deutsch and coworkers (e.g.
Deutsch, 1951; Deutsch and Brown, 1952) its annihilation lifetimes, or
decay rates, have been studied both theoretically and experimentally.
307

308 7 Positronium and its interactions
The decay rate of ground state ortho-positronium in vacuum,
0
λ
o-Ps
, has
been investigated more often than any other property of positronium,
because it is relatively straightforward to produce the atom in abundance
and the accurate measurement of its 142 ns lifetime, corresponding to
an annihilation rate of 7.04 µs
−1
, is well within technological capabil-
ities. In contrast, the much shorter 125 ps lifetime of ground state
para-positronium, corresponding to an annihilation rate of 8.0 ns
−1
, has
only been measured twice with a precision of better than 1%; this has been
achieved by utilizing the mixing of the m = 0 states of ortho-positronium
and para-positronium in a uniform magnetic field and assuming a value
for the ground state hyperfine splitting. To our knowledge there have
been no measurements of the decay rates for excited state positronium.
In Chapter 1, the first order contributions to the annihilation rates from
the dominant modes of decay of the S-states of both ortho- and para-
positronium (for arbitrary principal quantum number n
Ps
) were given
as equations (1.5) and (1.6). These contributions are included in the
following equations for the rates for the two ground states, which also
contain terms of higher order in the fine structure constant, α:
0
λ
o-Ps
=2α
6
mc
2
π
2
− 9
9π
1 −
Aα
π
−
1
3
α
2
ln α
−1
+ B
α
π
2
−
3α
2π
3
(ln α)
2
+ ···
, (7.1)
0
λ
p-Ps
=
α
5
mc
2
2
1 −
α
π
5 −
π
2
4
+
2
3
α
2
ln α
−1
+ B
α
π
2
+ ···
. (7.2)
Note that, as can be seen from the discussion in subsection 1.2.1, the
contributions from the higher order annihilation modes are negligible at
the present levels of precision. Thus, the rate for the annihilation of ortho-
positronium into five gamma-rays is only 10
−6
of that for three gamma-
rays, with a similar value for the ratio of the rates for para-positronium
annihilation into four and two gamma-rays.
The most accurate determination of the coefficient A in the ortho-
positronium decay rate has yielded the value 10.2866 (Adkins, Salahuddin
and Schlam, 1992), giving a 2.3% change in the lowest order annihilation
rate. For para-positronium, the corresponding first order correction is
only 0.6%. The coefficient B multiplying the term (α/π)
2
has been
determined by Mil’stein and Khriplovich (1994) to have the value 46
for ortho-positronium (and 40 for para-positronium), producing a further
change of approximately 250 ppm in the annihilation rate. Taking all
these corrections into account, the most accurate theoretical value of
the ortho-positronium annihilation rate is 7.0420 µs
−1
, in very good