Chadwick M.B., et al. ENDF/B-VII.0: Next Generation Evaluated Nuclear Data Library for Nuclear Science and Technology
Подождите немного. Документ загружается.

ENDF/B-VII.0: Next Generation... NUCLEAR DATA SHEETS M.B. Chadwick et al.
ordinated Research Project (CRP), all of which worked
cooperatively to improve the evaluation process.
The IAEA CRP provided the largest contribution to
the evaluation. The main objectives of the evaluation
were: To improve the covar iance matrices used in the
evaluatio ns ; study the reasons for uncertainty reduction
in R-matrix and model independent fits; and establish
a method for combining the R-matrix and model in-
dependent evaluations used to obtain the final evalu-
ations of the neutron cross section standards. To re-
alize these objectives, the following tasks were under-
taken: Improvements to the experimental data in the
standards database and methods for handling discrepant
data; an R-matrix evaluation of the hydrogen scattering
cross section and conversion of meas urements relative to
the hydrogen cross section to the new standard; studies
of Peelle’s Pertinent Puzzle (PPP) and its effect on the
standards; evaluation work on microscopic calculations
leading to independent determinations of R-matrix scat-
tering pole s; studies of the small uncertainties that result
from some evaluations; investigation of smoothing pro-
cedures; and finally the end result, the ENDF/B-VII.0
standards.
The
238
U(n,f) cros s s e ction, which is a NEA-
NDC/INDC standard, was accepted as a new standard
for E NDF/B-VII.0. However 2 MeV was recommended
as the lower b ound for use of this cross section as a stan-
dard. The use of this cross section from threshold to
2 MeV as a standard is discouraged due to the very
rapid change of this cross section in that energy range
and the very sma ll cross section in the threshold en-
ergy region. Table XXII shows the list of standards and
energy their range s. Extended energy ranges compared
with the ENDF/B-VI results were obtained for the cross
sections for H(n,n),
10
B(n,α),
10
B(n,α
1
γ),
235
U(n,f) and
238
U(n,f).
TABLE XXII: List of neutron cross section standards.
Reaction Energy Range
H(n,n) 1 keV to 200 MeV
3
He(n,p) 0.0253 eV to 50 keV
6
Li(n,t) 0.0253 eV to 1 MeV
10
B(n,α) 0.0253 e V to 1 MeV
10
B(n,α
1
γ) 0.0253 eV to 1 MeV
C(n,n) 0.0253 eV to 1.8 MeV
Au(n,γ) 0.0253 eV, 0.2 MeV to 2.5 MeV
235
U(n,f) 0.0253 eV, 0.15 to 200 MeV
238
U(n,f) 2 MeV to 200 MeV
B. Database studies
A large database of measurements, a significant por-
tion of which were asse mbled by Poenitz [212] for the
ENDF/B-VI sta ndards evaluatio n, was used for the
present evaluation. I n addition, the data sets introduced
after the ENDF/B-VI evaluation and before the initi-
ation of this evaluation were included in the database.
More than 30 data sets were added to the standards
database since the initiation of the present evaluation
effort. Many of the experiments were done in response
to suggestions fr om thos e working on this evaluation.
The status of the standards database [213] has been
discussed recently. Recent improvements were obtained
for the thermal cons tants used in the evaluation. This
was largely due to an improved analysis of the Gwin
[214] nubar (¯ν) uncertainties and the very accurate co-
herent scattering measurements for
235
U o bta ined by Arif
[215] that were used to provide a more accurate scatter-
ing cross section.
The database also included data involving the
238
U(n,γ) and
239
Pu(n,f) cross sections that improved
the database as a result of ratio measurements of those
cross sections to the traditional standards. Also scatter-
ing and total cross section data were included for
6
Li and
10
B since they provide information on the standard cross
sections.
Discrepancies in exp e rimental data sets were handled
by adding a medium e nergy range correlation compo-
nent. This component was added if the difference from
the evaluation was more than two sigma for a single point
or more than one sigma for two or more consecutive en-
ergy points. This results in a much better chi square per
degree of freedom and larg e r uncer tainty in the evaluated
results. The change in the c ross section resulting from
this procedure is small.
It is useful to summarize the thermal constants in the
standards reaction sublibrary and compare them with the
values for the same reactions given in the neutron reac-
tion sublibrary. This is done in Table XXIII. One can see
that there a re differences between the two sublibraries,
though these are generally very small and within ≈ 0 .5
standard deviation.
C. Evaluation details
1. Hydrogen scattering
Many of the data in the standards database were mea-
surements relative to the hydrogen scattering cross sec-
tion. To o bta in improved cross sections fr om these data,
the hydrogen scattering cross section was evaluated using
the R-matrix code EDA [28]. Calculations of the angu-
lar distribution using these R-matrix parameters are in
much better agreement with recent meas urements [216]
than the old ENDF/B-VI evalua tio n, see Section III.F.
All the data in the database relative to hydrogen cross
sections were converted so they are relative to the new
standard. The databas e contained measurements rela-
tive to several different versions of total cr oss sections.
Also a number of experiments were in the database that
used different laboratory angles, and different versions
59
ENDF/B-VII.0: Next Generation... NUCLEAR DATA SHEETS M.B. Chadwick et al.
TABLE XXIII : Thermal (0.0253 eV) constants obtained from the standards evaluation, g
f
and g
abs
being the Westcott factors.
The only item shown in this table that is considered a standard is the t hermal
235
U(n,f) cross section. Given in brackets are
values taken from the neutron sublibrary. The ENDF/B-VII.0 standards nubar for
252
Cf is ¯ν
tot
= 3.76921075 ± 0.12469%,
comprised of ¯ν
p
=3.7606 and ¯ν
d
=0.0086. In ENDF/B-VI.8, ¯ν
tot
was 3.7676, comprised of ¯ν
p
=3.759 and ¯ν
d
=0.0086.
Quantity
233
U
235
U
239
Pu
241
Pu
σ
nf
(b) 531.22± 0.25% 584.33± 0.17% 750.00± 0.24% 1013.96± 0.65%
(531.22) (585.09) (747.40) (1011.85)
σ
nγ
(b) 45.56± 1.50% 99.40± 0.72% 271.50± 0.79% 361.79± 1.37%
(45.24) (98.69) (270.33) (363.05)
σ
nn
(b) 12.11± 5.48% 14.087± 1.56% 7.800±12.30% 12.13± 21.50%
(12.15) (15.08) (7.975) (11.24)
g
f
0.9956±0.14% 0.9773± 0.08% 1.0554±0.20% 1.0454± 0.53%
(0.9966) (0.9764) (1.0542) (1.046)
g
abs
0.9996±0.11% 0.9788± 0.08% 1.0780±0.22% 1.0440± 0.19%
(0.9994) (0.9785) (1.0782) (1.042)
¯ν 2.497 ±0.14% 2.4355± 0.09% 2.8836±0.16% 2.9479± 0.18%
(2.504) (2.4367) (2.8789) (2.9453)
FIG. 67: The ENDF/B-VII.0 H (n,n) evaluation compared
with th e ENDF/B-VI and ENDF/B-V evaluations. The zero
degree results are ratios of the center-of-mass-system cross
sections at 180 degrees (which corresponds to zero degree pro-
tons in the laboratory system).
of the differential cross section. Careful clarification of
this point was important since misma tch in laboratory
and centre-of-mass values had a non-negligible impact
on evaluations. The effect of the change in the hydrogen
standard cross section caused, for example, a change as
large as 0.5% for the evaluated
235
U(n,f) cross section.
2. Peelle’s pertinent puzzle (PPP)
Problems associated with PPP were observed early in
the evaluation process [217]. A test run using a model-
independent least squares code fitting the logarithm of
the cross section produced higher cross sections than a
run fitting the cross section. There were discrepant data
in the test run. The problem app e ars to be the result of
using discr e pant data (denoted as the mini-PPP effect)
but its influence is strongly magnified by the existence o f
data correlations. This is the so-called maxi-PPP effect
vs mini-PPP effect.
The GMA code, which was used as the model inde-
pendent least squar e s code for the ENDF/B-VI stan-
dards e valuation, was modified by adding the Chiba-
Smith [218] option to handle PPP problems. This op-
tion, called GMAP [219] renormalizes the experimental
absolute errors on the assumption that it is the fractional
error that actually reflects the accuracy the exper imenter
has provided. This approach appears to re duce the ef-
fect of PPP significantly. Comparisons using the Chiba-
Smith and logarithmic transformation methods for han-
dling PPP are in good agreement for a number of test
cases. The experience obtained from the standards eval-
uation indicates that to improve the quality of nuclear
data evaluations in gener al, special care should be exer-
cised to minimize the PPP effect.
3. Verification of evaluated results
Concerns had been expres sed about the small uncer-
tainties obtained for the standards in the ENDF/B-
VI evaluation [220]. Work has been done on the
small uncertainty problem and comparisons of cross
section results through compa risons of several tests o f
model-indep e ndent and R-matrix codes using common
databases. The R-matrix codes used in the pre sent study
were EDA [28], SAMMY [27], and RAC [221]. The
60

ENDF/B-VII.0: Next Generation... NUCLEAR DATA SHEETS M.B. Chadwick et al.
generalized least squares codes used were GLUCS [222],
GMAP, and SOK [223]. A code based on an analytical
approximation model, PADE2 [224] was also used.
For the verification tests, it was assumed that no cor-
relations existed between the data sets. The only cor-
relations within the data sets were assumed to be short
energy range (statistical) and long energy range (normal-
ization). The generalized least squares codes were easily
shown to b e in good agreement. Work with these codes
led to the discovery of an error in the GMA code used
for the ENDF/B-VI standards evaluation that caused
a small effect on those standard cross sections results.
Comparisons of the R-matrix codes proved to be more
difficult s ince the input conditions were difficult to stan-
dardize. Additional work with these codes led to ac-
ceptable agreement between the codes especially if the
differences in approach and numerical precision differ-
ences were considered. Important conclusions from the
present work were that proper consideration of correla-
tions within and be tween data sets is required to obtain
more realistic uncertainties a nd that it is essential to con-
sider the covariances, no t just the variances, in applica-
tions of cross se c tions to practical systems.
D. Evaluation procedure
A combination procedure somewhat similar to that
used for the ENDF/B-VI standards evaluation was used
to obtain the s tandards. In the case of ENDF/B-VII.0
the code GMAP [2 19] was used for the combining process
described below rather than a s pecialized merging code
as was the case for ENDF/B-VI. All the standards ex-
cept the H(n,n),
3
He(n,p) and C(n,n) cross sections were
evaluated using the GMAP code with input from the
RAC and EDA R-matrix analyses and a thermal con-
stants evaluation.
For the thermal constants evaluation, the Axton evalu-
ation [225] with the associated variance -covariance data
for
233
U,
235
U,
239
Pu a nd
241
Pu was used as input to
the GMAP code since it includes accurate cro ss sections
which have be e n measured relative to the neutron cross
section standards. Thus this evaluation had an impact
on the determination of the standards.
The R-matrix analyses used charged-particle data and
the entire lithium and boron neutron databases, includ-
ing total and scattering cross section data for these nu-
clides. The only lithium and boron data use d in the
GMAP code were the ratio measurements to sta ndards.
Thus the R-matrix and GMAP data sets were indepen-
dent (no common or correlated data sets). For both the
6
Li(n,t) and boron work, the cross sections obtained from
the RAC and EDA R-matr ix analyses were not iden-
tical. For the
6
Li(n,t) cro ss section the two analyses
agreed within 2% at all energies. The agreement was not
as good for the
10
B(n,α
1
γ) and
10
B(n,α) cross sections
where there were differences as la rge as several percent
in some energy re gions. In each case the RAC a nd EDA
analyses were averaged (unweighted) and the result was
used as the R-matrix input to GMAP.
The covariance matrix used with these central val-
ues was that from the RAC code since its results ap-
peared more physically reasonable. The R-matrix input
and thermal constants data were treated like the addi-
tions of other data sets to the GMAP code. At each
energy point, half the difference between the RAC and
GMAP results was treated as a model uncer tainty that
was added qua dratically to the RAC covariance of un-
certainties. This then takes into account the small differ-
ences between the RAC and EDA analyses .
The results obtained from the combination proce-
dure were not smooth in some cases. For the
6
Li(n,t),
10
B(n,α
1
γ), and
10
B(n,α) cr oss section smoothing was
not required due to the larg e weight given to the cro ss sec-
tions from the R- matrix analyses. For the heavy element
standards, it was determined that a simple smoothing
algorithm was satisfa c tory, which was used sparingly. A
patch using the shape of the Maslov [226] evalua ted curve
was applied in the 50-60 MeV region for the
235
U(n,f)
cross section wher e a rather large fluctuation, assumed
to be statistical, occurre d.
E. Results of the evaluation
Representative results from the evaluations for
the H(n,n),
6
Li(n,t),
10
B(n,α
1
γ),
10
B(n,α), Au(n,γ),
235
U(n,f), a nd
238
U(n,f) standard cross sections are
shown in Fig s. 67-73. All uncertainties shown are
one standard deviation values. These uncertainties are
generally somewhat larger than those obta ined in the
ENDF/B-VI standards evaluation. The C(n,n) standard
cross section was carried over from the ENDF/B-VI eval-
uation since very little new data have been obtained sub-
sequent to tha t evaluation; what were obtained were in
good agreement. The
3
He(n,p) standard was not re-
evaluated. It was also carried over from ENDF/B-VI.
Cross sectio ns for the
238
U(n,γ) and
239
Pu(n,f) reactions
were also obtained from this evaluation, see Figs. 27 and
30.
Some benchmark data testing has been done using
these data. K1, the Gwin thermal reactivity parameter
3
calculated from the eva luation is 721.6 b. This should
be compared with the “preferred” va lue of 722.7 ± 3 .9 b
determined by Hardy [227]. The agreement is quite good
when one considers that the uncertainty in the Hardy
value is 3.9 b. Criticality calculations using these data
are generally in better agreement than those obtained
with the ENDF/B-VI standa rds, as discuss e d in Section
X.
[3] The Gwin thermal reactivity parameter is defined as K1 = ¯ν
g
f
σ
f
- g
abs
σ
abs
, where fission and absorption cross sections
are given at the thermal energy, and g
f
and g
abs
are Westcott
factors for fission and absorption, respectively.
61
ENDF/B-VII.0: Next Generation... NUCLEAR DATA SHEETS M.B. Chadwick et al.
FIG. 68: The ENDF/B-VII.0
6
Li(n,t) evaluation compared
with the ENDF/B-VI evaluation. The curve connects the
central values of VII.0 to V I.8 ratios.
FIG. 69: The ENDF/B-VII.0
10
B(n,α
1
γ) evaluation com-
pared with the ENDF/B-VI evaluation. The curve connects
the central values of VII.0 to VI.8 ratios.
Table XXIII shows the thermal constants obtained
from this evaluation - but note that the only item consid-
ered a standard there is
235
U(n,f) - see als o Ta ble XXII.
The small differences shown in this table between the
standards work and the values used in the neutron trans-
port files (neutron sublibrary) are because E NDF evalua -
tors have been given the freedom to make sma ll changes,
typically within the experimental uncertainty.
FIG. 70: The EN DF/B-VII.0
10
B(n,α) evaluation compared
with the ENDF/B-VI evaluation. The curve connects the
central values of VII.0 to VI.8 ratios.
FIG. 71: The ENDF/B-VII.0 Au(n,γ) evaluation compared
with the ENDF/B-VI evaluation. The curve connects the
central values of VII.0 to VI.8 ratios.
VI. PHOTONUCLEAR REACTION
SUBLIBRARY
The photonuclear evaluated data files described her e
represent the first time that such data are available in the
official evaluated ENDF/B library, including representa-
tions of the secondary energy and angle spectra, suit-
able fo r use in radiation transport calculations. Prior to
62
ENDF/B-VII.0: Next Generation... NUCLEAR DATA SHEETS M.B. Chadwick et al.
FIG. 72: The ENDF/B-VII.0
235
U(n,f) evaluation compared
with the ENDF/B-VI evaluation for the common energy re-
gion. The present evaluation extends to 200 MeV, however
comparisons cannot be made to the ENDF/B-VI evaluation
since that evaluation only extends to 20 MeV. The curve con-
nects the central values of VII.0 to VI.8 ratios.
FIG. 73: The ENDF/B-VII.0
238
U(n,f) evaluation compared
with the ENDF/B-VI evaluation for the common energy re-
gion. The present evaluation extends to 200 MeV, however
comparisons cannot be made to the ENDF/B-VI evaluations
since that evaluation only extends to 20 MeV. The curve con-
nects the central values of VII.0 to VI.8 ratios.
this, many o f these data have been made ava ilable infor-
mally from LANL and the IAEA following a collaborative
IAEA Coordinated Research Project [5].
A. Evaluations
The cr oss sections and spectra have been evaluated
through use of bo th measured data, and nuclear model
calculations. The use of nuclear r e action theory, in par-
ticular, facilitates the eva luation of the energy-spectra
of the ejectiles (since there a re only a limited number of
measurements for monoenergetic incident photons ). This
distinguishes the present work from some previous pho-
tonuclear data evalua tions and compilations [228–230],
which focused on cross sections but not ejectile s pectra.
The eva luation procedure also had to assess the most
probable value of a cross sectio n where discrepant mea-
surements exist. While such consider ations play a role
in all nuclear data evaluation activities, the situation is
particularly difficult for photonuclear data, since some of
the most extensive experimental programs (for instance
at Livermore and Saclay) have systematical differences
in the ma gnitudes of reported cross sections [231, 232].
This is, in par t, due to the different experimental meth-
ods used to produce photon radiation, which include
positron annihilation, bremsstrahlung tagged-photons,
bremsstrahlung, and electron-induced reactions.
Photonuclear data evaluations have been completed for
163 isotopes. The materials studied are those that are
impo rtant for applications. For example, simulations of
dose in external beam photon and electron cancer ther-
apy requires photonuclear cross sections for accelerator
and beam collimator structures (e.g., Al, Fe, Co, Cr, Ni,
Cu, Pb), for bremsstrahlung conversion targets (e.g., Ta,
W, Be ), and for human tissue materials (e.g., C, N, O, P,
Ca). Similarly, simulations supporting nonpr oliferation
technologies that aim to detect special nuclear materi-
als (SNM) require photonuclear (including photofission)
cross sections o n actinide isotopes.
Detection of chemical explosives can be a ccomplished
through resonant absorption of photons on nitrogen. To
this end, the
14
N evaluation was extended by BNL and
LANL to include the resonance region around 9.172 MeV
[233]. For this particular case, photonuclear resonance
parameters were deduced from Ajzenberg-Selove [234].
Most of our photonuclear evaluations extend up to 140 -
150 MeV energy, the pio n threshold, although a few ex-
tend just to 20-30 MeV. This upper energy is sufficiently
high for calculations of photonuclear reactio ns in most
medical electron accelerators that typically operate with
maximum energies in the 10-25 MeV region. The data
are complete in terms of their coverage of incident and
outgoing energies and angles, and include information
not only on the photoneutron cross sections, but also in-
formation describing all possible light and heavy ejectiles
including nuclear recoils. This allows their use in stud-
ies of radiation transpor t, energy deposition (absorbed
63
ENDF/B-VII.0: Next Generation... NUCLEAR DATA SHEETS M.B. Chadwick et al.
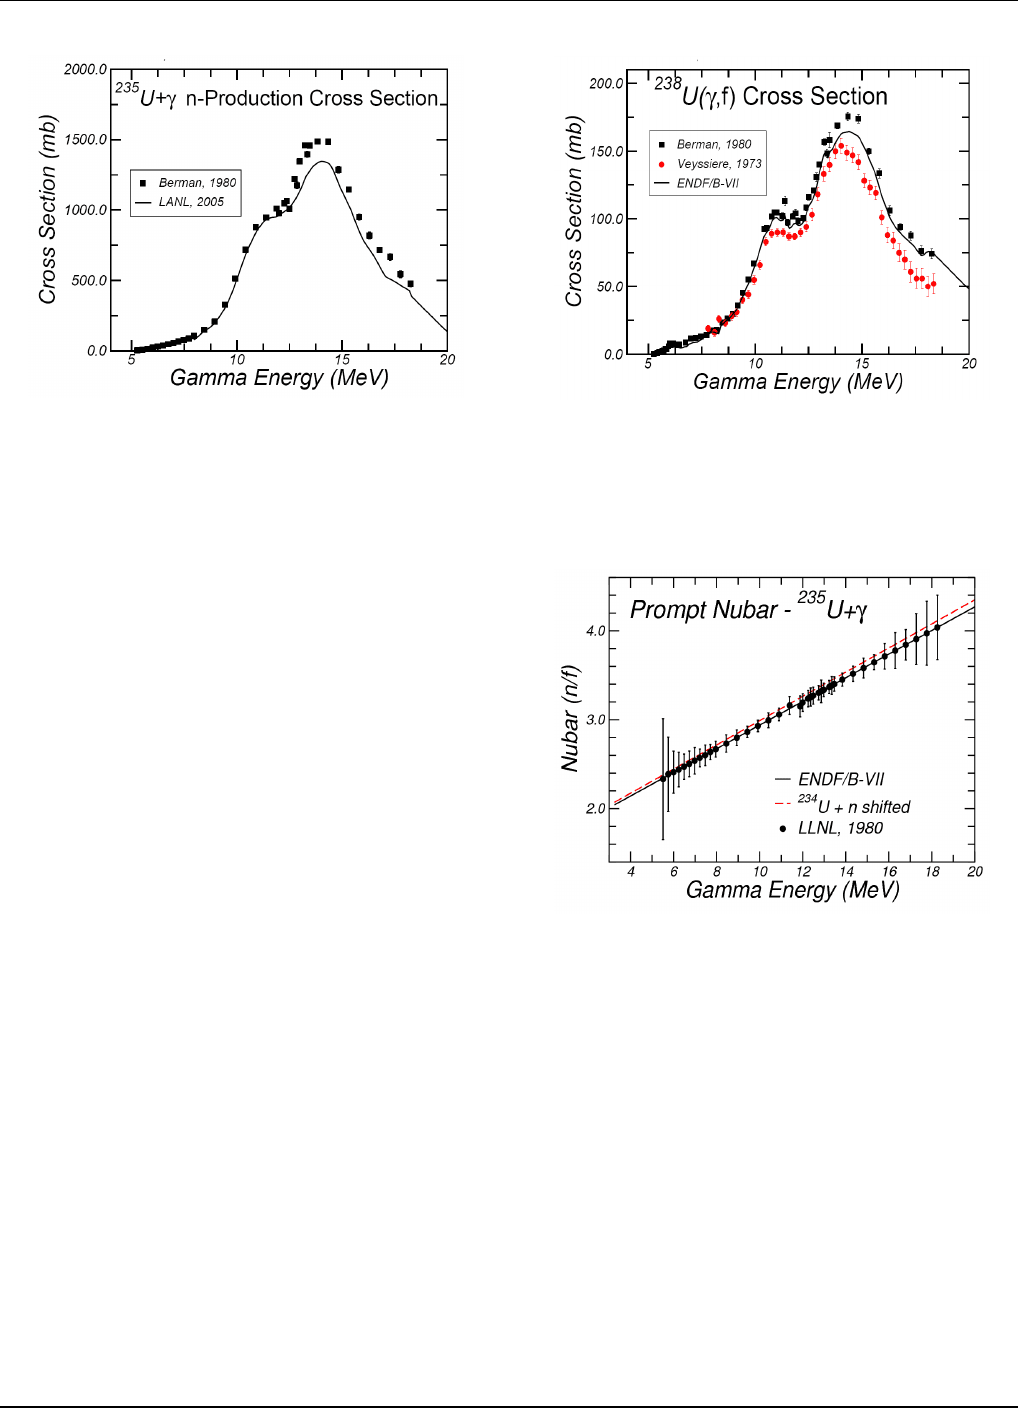
FIG. 74: Neutron production cross sections for photons inci-
dent on
235
U. The LAN L evaluation, adopted for ENDF/B-
VII.0, is compared with the experimental data. The reason
that the evaluation is discrepant with the Berman data above
12 MeV, is that the evaluated photoabsorption cross section
was taken from the Varlamov evaluation.
dose), relative biological effectiveness (RBE), activation,
and shielding .
The data included in ENDF/B-VII.0 are based upon
those produced recently by an IAEA Coordinated Re-
search Project (CRP ), led by Chadwick and Obloˇzinsk´y
from the US CSEWG project. The ENDF data evalua-
tions were develope d at the lab oratorie s participating in
this project (Lo s Alamos, Brookhaven, Sa o Paulo, Ob-
ninsk, Moscow, JAERI, KAERI, Beijing, Vienna) and
are also available from the IAEA. A technical report that
describes these data in detail, including figures for all 164
isotopes (ENDF/B-VII.0 contains 163 materia ls) com-
paring the evaluated data with measure ments, is avail-
able [5]. Journal articles detailing the photonuclear eval-
uations from Los Alamo s have also been published [235–
237].
Because these photonuclear evaluations have been doc-
umented in detail (with extensive comparisons against
the measured data) [5, 235–237], we do no t re peat these
comparison figures here. However, we do describe a re-
cent development for the actinide photonuclear data, mo-
tivated by needs in the nonproliferation community.
In the IAEA Coordinated Resea rch Project, the orig-
inal actinide cross section evaluations came from Ob-
ninsk, Russia. Becaus e these evaluations did not in-
clude delayed neutron information from photofission, de-
layed neutron data were added to the Obninsk evalu-
ations by Los Alamos. This is particularly important,
since certain ac tive interrogation schemes for detecting
SNM involve pulsing a carg o container, for instance , with
bremsstrahlung photons and measuring delayed neutron
emission signals that point to fission, and therefore the
presence of actinides.
FIG. 75: Fission cross sections for photons incident on
238
U.
The ENDF/B-VII.0 evaluation is compared with the available
experimental data.
FIG. 76: Prompt nubar for photons incident on
235
U. Our
evaluation uses the Caldwell data, LLNL.
Recently, at Los Alamos, in collaboration with CEA
Saclay [236], we have evaluated the actinide photonuclear
cross sections for
235,238
U,
239,240
Pu,
241
Am and
237
Np,
having extended our GNASH modeling code to model the
photofission processes. We were able to make extensive
use of GNASH nuclear rea c tion modeling parameters al-
ready developed for our work on neutron reactions (e.g.,
fission barrie rs, level densities, etc). This enabled us to
use our more advanced computational tools for predict-
ing exclusive cross sections , spe c tra, a nd angular distri-
butions for the emitted neutrons. For illustration, eval-
uated neutron production cross sections for
235
U+γ are
shown in Fig. 74 and evaluated
238
U(γ,f) cross sections
in Fig. 75.
64
ENDF/B-VII.0: Next Generation... NUCLEAR DATA SHEETS M.B. Chadwick et al.
4 6 8 10 12 14 16 18 20
Gamma Energy (MeV)
2.0
3.0
4.0
5.0
Nubar (n/f)
ENDF/B-VII
237
U + n shifted
LLNL, 1980
Saclay, 1973
Prompt Nubar -
238
U+?
FIG. 77: Prompt nubar for photons incident on
238
U.
0 2 4 6 8 10 12 14 16 18 20
Gamma Energy (MeV)
1.0
2.0
3.0
4.0
5.0
6.0
Nubar (n/f)
ENDF/B-VII
Blokin et al., 1999
ENDF/B-VI (
238
Pu shifted)
LLNL, 1986
Prompt Nubar -
239
Pu+?
FIG. 78: Prompt nubar for photons incident on
239
Pu.
2 4 6 8 10 12 14 16 18 20
Gamma Energy (MeV)
0.000
0.004
0.008
0.012
0.016
Nubar (n/f)
n+
234
U shifted by S
n
ENDF/B-VII
Caldwell, 1975
Delayed Nubar -
235
U+?
FIG. 79: Delayed nubar for photons incident on
235
U. Ex-
perimental data are for bremsstrahlung photons, data points
refer to the average incident energy.
2 4 6 8 10 12 14 16 18 20
Gamma Energy (MeV)
0.00
0.01
0.02
0.03
0.04
0.05
Nubar (n/f)
n+
237
U shifted by S
n
ENDF/B-VII
Caldwell, 1975
Delayed Nubar -
238
U+?
FIG. 80: Delayed nubar for photons incident on
238
U. Ex-
perimental data are for bremsstrahlung photons, data points
refer to the average incident energy.
0 2 4 6 8 10 12 14 16 18 20
Gamma Energy (MeV)
0.000
0.002
0.004
0.006
Nubar (n/f)
n+
238
Pu shifted by S
n
ENDF/B-VII
Caldwell, 1975
Delayed Nubar -
239
Pu+?
FIG. 81: Delayed nubar for photons incident on
239
Pu. Ex-
perimental data are for bremsstrahlung photons, data points
refer to the average incident energy.
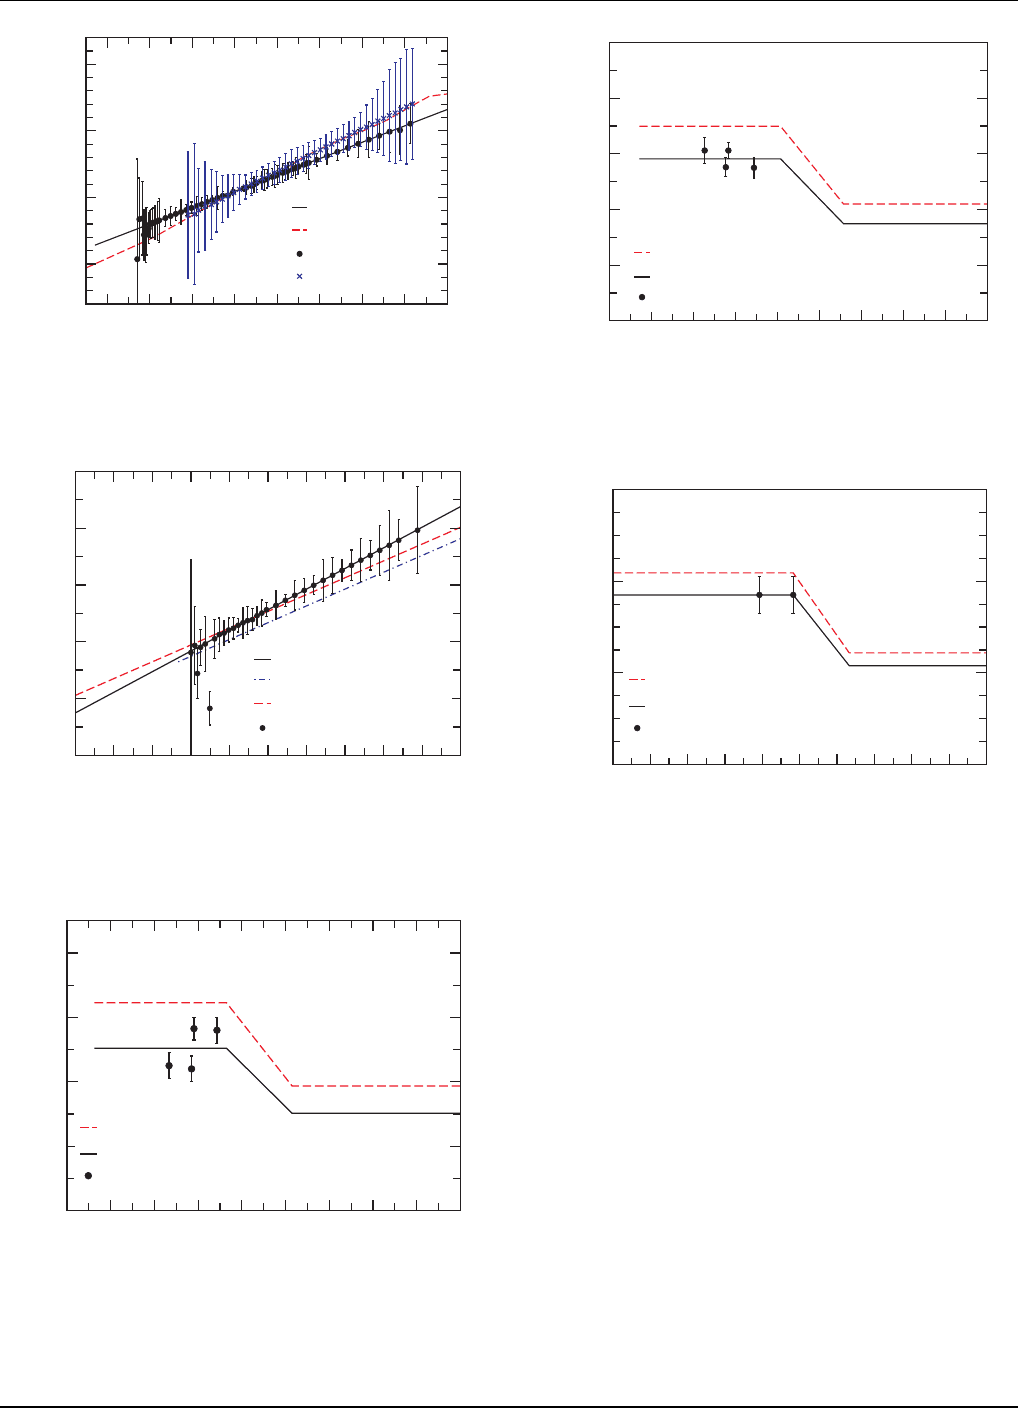
Our evaluations for the prompt fission neutron multi-
plicity, ¯ν
p
, were based on using the measured data from
Livermore [238]. These data are shown in Fig s. 76, 77
and 78 for
235,238
U and
239
Pu respectively. In Fig. 78 we
show, for comparison, the results from the Russian (Ob-
ninsk) evaluation, labeled as Blokhin et al. (1999). We
also show the results that would be obtained if one took
the ENDF neutron evaluation for the A-1 system shifted
by the neutron separation energy (i.e., comparing γ +
239
Pu with n+
238
Pu, shifted by the neutr on separation
energy), since one would expect these results to be sim-
ilar (except fo r small effects due to the differe nt angular
momentum in the two channels). It is reassuring that
indeed the two approaches lead to similar results.
For the photofission delayed neutron multiplicities, our
approach has been to utilize the equivalent neutron in-
duced evaluations for the A-1 system (shifted by the neu-
tron separation energy), but then to renormalize these
values so as to better match the measured data from
65
ENDF/B-VII.0: Next Generation... NUCLEAR DATA SHEETS M.B. Chadwick et al.
bremsstrahlung source measurements by Caldwell (this
time when he was at Los Alamos), see Figs. 79, 8 0 and
81 for
235,238
U and
239
Pu, respectively. This approach
has the merit that the equivalent neutron-induced A-1
data are available for monoenergetic incident energies,
whilst we still make use o f the bremsstrahlung-induced
data to renormalize these results (their average incident
energy is plotted in Figs. 79, 80 and 81). We note that a
measurement program has bee n initiated at CE A Saclay
to obtain new data for the delayed neutron multiplicities,
initially for
238
U, with future measurements planned for
235
U. Such data will be valuable for testing a nd improv-
ing our evaluations. A full description of the new actinide
evaluatio ns is in preparation [239]. Doc umentation of our
preliminary work was given in Ref. [236], though we note
that some of our final ENDF/B-VI I .0 evaluation differ
slightly from those documented there.
B. Integral validation
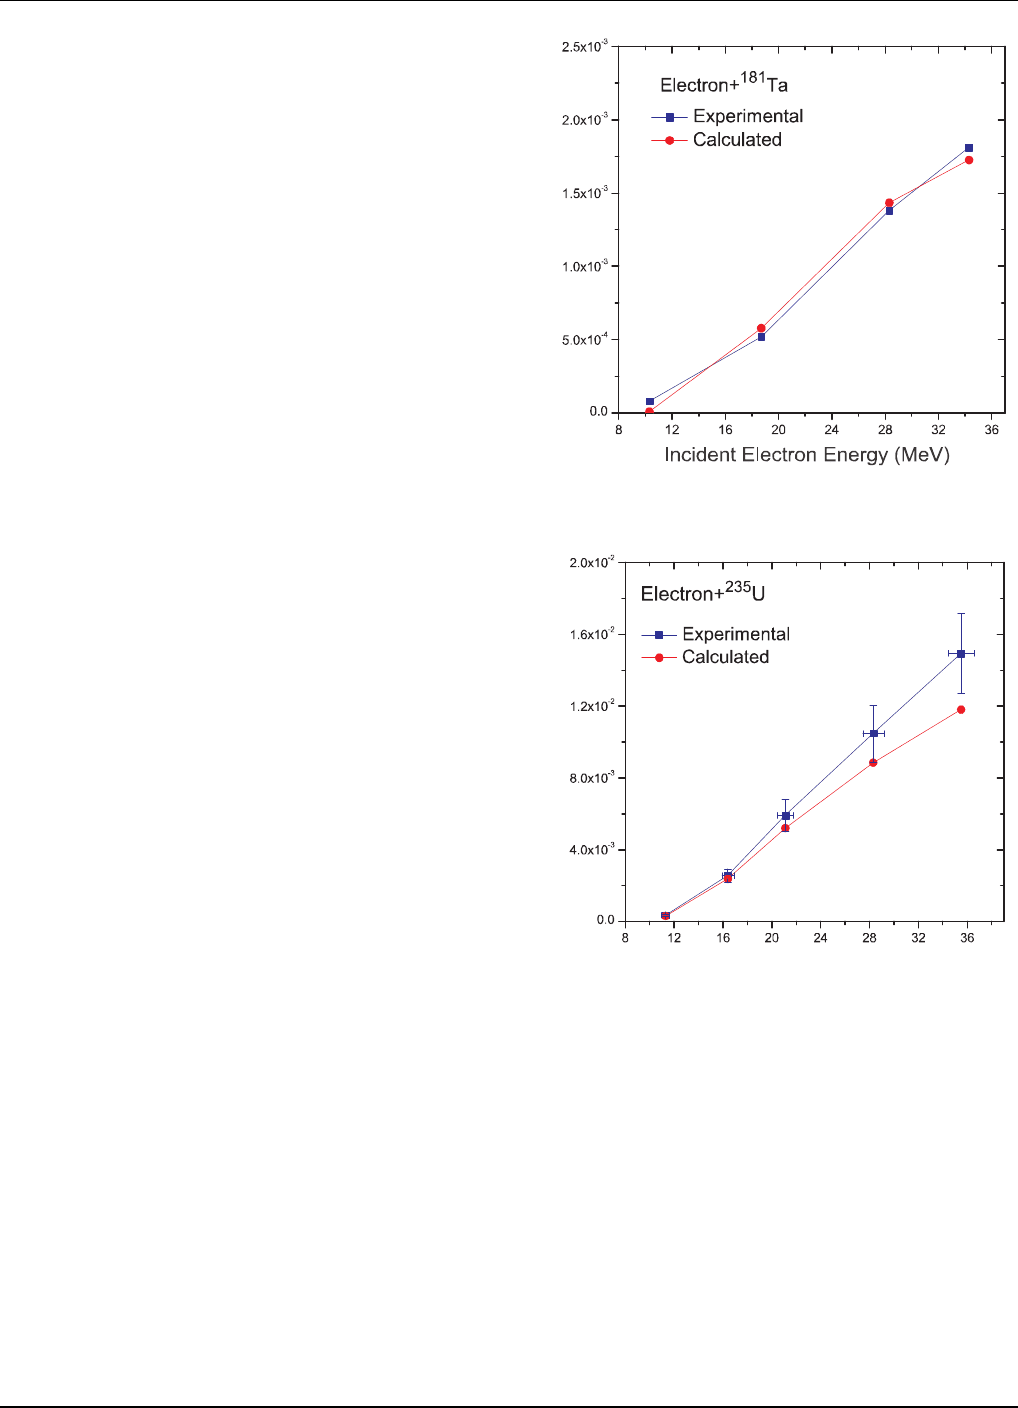
The photonuclear evaluations can be tested and val-
idated in an integral way by comparing simulated and
measured prompt neutron production. Exp e rimental
data were obtained by Ba rber and George [240] using a
well-characterized electron source and neutron detector
to make absolute measurements of neutrons produced per
electron incident on several thicknesses of various materi-
als. A validation comparison, using these measure ments,
the MCNP 4 C transport code, and s ubstantially the same
data as found on the current library, was recently pre-
sented by White et al. [237] and an example calculation
from that study is shown here in Fig. 82. A similar study
using the uranium data produced for the current library
has also been done and one comparison for uranium is
shown in Fig. 83.
The comparison to the uranium data is most typi-
cal of the results of the broader study. In general, we
find that the simulation matches the data within a few
percent at lower energy and generally become mo re dis-
crepant with differences growing to 20-30 % at higher
energies. The comparison to tantalum provides the only
exception where the data remain within a few percent
at higher ener gies. The simulations show a systematic
under-prediction of the experimental data that needs to
be b e tter understood. Based on favorable comparisons
of, in some cas e s, multiple independent measurements of
cross-s ection data to the evaluated data, it is hard to ar-
gue that the discr e pancy stems from the evaluations . It
is recommended that additional exper imental measure-
ments be made to help resolve these discrepancies. In
addition to repeating integral measurements of neutrons
produced per electron as shown here, such measur e ments
might include revisiting fundamental measurements of
the cross sections, direct measurement of emission dis-
tributions, and measurements of bremsstrahlung sp e ctra
to validate the electr on to photon conversion.
The actinide delayed neutron data have also been
N
e
u
t
r
o
n
Y
i
e
l
d
P
e
r
I
n
c
i
d
e
n
t
E
l
e
c
t
r
o
n
FIG. 82: Neutron yield per incident electron on a Ta target.
Incident Electron Energy (MeV)
N
e
u
t
r
o
n
Y
i
e
l
d
P
e
r
I
n
c
i
d
e
n
t
E
l
e
c
t
r
o
n
FIG. 83: Neutron yield per incident electron on a
235
U target.
tested via simulations of experiments recently per-
formed at Los Alamos fo r nonproliferation applications.
Here, a pulsed 10 MeV electro n accelerator created a
bremsstrahlung photon source that was incident on two
configurations of highly-enriched uranium (HEU). The
first had a mass of 4.8 kg and the second had a mass
of 21.5 kg. Neutrons were detected between pulses.
These neutrons are dominated by delayed neutrons from
photofission and prompt neutrons fro m fission events in-
duced by the delayed photofission neutrons.
Approximately 100 counts per second were observed
with the small-mass HEU configuration, a nd approxi-
mately 1000 counts p e r second were obser ved with the
66

ENDF/B-VII.0: Next Generation... NUCLEAR DATA SHEETS M.B. Chadwick et al.
large-ma ss HEU configuration. The experiments were
simulated with a version of MCNP modified to utilize
photofission delayed neutron data. While absolute com-
parisons with ex periment were not pra ctical, the relative
agreement was encouraging. The e xpe rimental count rate
ratio (large object / small object) was 10.0 and the sim-
ulated value was 8.7 [241]
VII. CHARGED PARTICLE REACTION
SUBLIBRARIES
The evaluation methods used for the charged-pa rticle
evaluatio ns ar e similar to those used for the neutron sub-
library. One has to distinguish between very light tar-
gets, essentially few-body systems, and heavier nuclei
that can be considered suitable for applying statistical
methods . The reaction models used in the bo th cases
are very different. There is no clear separation between
the two reg ions although A=10 could be set as a tenta-
tive boundary. Actually, below this boundary there is an
evaluatio n for protons on
9
Be performed with statistical
models and above the boundary there is a p+
13
C evalua-
tion performed with the few-body (R-matrix) methodol-
ogy. Otherwise, all evaluations for nuclei with A610 were
evaluated using the R-matrix formalism and all heavier
ones using statistical GNASH reactio n code methods. All
non-proton charged-particle evaluations were performed
for light nuclei and use a few-body methodology.
There are several new evaluations for charged-particle-
induced reactio ns on light elements, including p+
7
Li,
d+
6
Li, d+
7
Li, t+
6
Li,
3
He+
6
Li, and p+
10
B. These re-
sulted fro m R-matrix analyses of reactions in the A =8 ,
9, and 11 s ystems, and include spectra for some of
the reactions coming from breakup into three-body fi-
nal states, calculated with the 3-body resonance-model
code SPECT [242]. Having been developed primarily
for thermonuclear and astrophysical applications, these
evaluatio ns do not always cover the energy r ange up to
20 MeV. However, they are complete transport eva lu-
ations (including all angular distributions and spectra)
over their specified incident energy ranges.
A. Proton reaction sublibrary
The proton sublibrary co ntains 48 LANL evaluations,
including 8 evaluations on light nuclei produced by the
R-matrix approa ch, and 40 evaluations produced by sta-
tistical and direct reaction models extended up to 150
MeV.
1. Proton reactions for A 6 10
Reaction p+
1
H. p-H elastic cros s sections were cal-
culated for E
p
between 0 a nd 150 MeV from an R- matrix
analysis of p-p cross-section and polarization data in this
energy range. The maximum nuclear partial wave al-
lowed in the fit was l = 6, and the resulting χ
2
per degree
of freedom was 1.8.
Reaction p+
2
H. The evaluation of the
2
H(p,n2p)
cross section is based on experimental data for both the
p +
2
H and n +
2
H reaction (nonelastic) cross sectio ns,
since these appear to be indistinguishable at energies
above about 20 MeV. Additionally, we utilized the Fad-
deev calculations for the evaluated c ross section at lower
energies. We were utilizing the r e sults of G. Hale’s R-
matrix analysis of p +
2
H data at proton energies up to
4 MeV and ex perimental data up to an energy of 65 MeV
for the evaluation of elastic scattering.
Reaction p+
3
H. The p+
3
H evaluation contains inte-
grated cross sections and ang ular distributions for the re-
actions initiated by pro tons on tritons at proton energies
up to 12 MeV. All the information has been calculated
from the parameters o f an extensive multi- channel R-
matrix analysis of reactions in the
4
He sys tem at proton
energies up to 12 MeV.
Reaction p+
3
He. The p+
3
He evaluation includes p
+
3
He elastic and p +
3
He → 2p + d reaction. The cross
sections and the elastic s c attering distributions were ob-
tained from an R-matr ix calculation with the EDA code.
The energy-angle distributions for the reaction p +
3
He
→ 2p + d are ass umed to follow a 3-body phase-space
law.
Reaction p+
6
Li. For the system p+
6
Li the reactions
6
Li(p,p)
6
Li and
6
Li(p,
3
He)
4
He were calculated fro m R-
matrix analysis of reactions in the A=7 system, which
included data for the
6
Li(p,p) and
6
Li(p,
3
He) reactions
at energies up to about 2.5 MeV.
Reaction p+
7
Li. In the case of the p+
7
Li, the reac-
tions
7
Li(p,p),
7
Li(p,n),
7
Li(p,d) and
7
Li(p,α) were cal-
culated from R-matrix analysis of reactions in the
8
Be
system. The energy range of the evaluation is up to 1 0
MeV. The
7
Li(p,d) evaluation was obtained without fit-
ting any experimental data o n that reaction, although
the reaction is constrained by the time inverse reaction,
for which substantial data were entered.
Reaction p+
10
B. The p+
10
B evaluation consists
of
10
B(p,p
0
)
10
B and
10
B(p,α
0
)
7
Be re actions calculated
from an R-matrix analysis of reactions in the
11
C nu-
clear system in the range from 10 keV up to 3 MeV.
The no rmalization of the low-energy
10
B(p,α
0
)
7
Be data
is strongly constrained by the
10
B(p,p
0
)
10
B data starting
at 0.5 MeV. The same is true for the other
10
B(p,α
0
)
7
Be
data. The exact normalization of this data above 1.5
MeV has changed considerably at various stages of the
analysis.
Reaction p+
13
C. The p+
13
C evaluation contains
13
C(p,γ
0
)
14
N reaction c alculated from an R-matrix anal-
ysis of reactions in the
14
N nuclear system in the energy
67

ENDF/B-VII.0: Next Generation... NUCLEAR DATA SHEETS M.B. Chadwick et al.
range from 10 keV up to 2 MeV. The main aim of the
analysis was twofold:
• accurate parametrization of the very narrow J
π
=
2
+
resonance at E
x
= 9.1724 MeV (E
p
= 1.7476
MeV) which dominates the cross-section, and
• parametrization of the background resonance struc-
ture.
2. LA150 proton reactions for A > 10
These LA150 (Los Alamos 150 MeV library) e valua-
tions were performed using statistical and direct reaction
models. They provide a co mplete repres e ntation of the
nuclear da ta needed for transport, damage, heating, ra-
dioactivity, and shielding applications over the incident
proton energy ra nge from 1 to 1 50 MeV. The evaluations
utilize MF=6, MT=5 to re present all reaction data. Pro-
duction cross sections and emission spectra are given fo r
neutrons, protons, deuterons, tritons, α- particles, γ-rays,
and all residual nuclides produced (A> 5) in the reaction
chains. To summarize, the ENDF sections with non-zero
data above are the following:
MF=3, MT=2: Integral of nuclear plus interference
components of the elastic scattering cross section.
MF=3, MT=5: Sum of binary (p,n’) and (p,x) re ac-
tions.
MF=6, MT=2: Elastic (p,p) angular distributions
given as ratios of the differential nuclear-plus- in-
terference to the integrated value.
MF=6, MT=5: Production cross sections and energy-
angle distributions for emission of neutrons, pro-
tons, deuterons, and alphas; and angle-integrated
sp e ctra for gamma rays and residual nuclei that are
stable against particle emiss ion.
The evaluations are based on nuclear model calcula-
tions that have been benchmarked to experimental data.
As for the neutr on sublibrary, we used the GNASH code
system, which utilizes Haus e r-Feshbach statistical, pre-
equilibrium and dire ct-reaction theories. Spherical op-
tical model calculations were used to obtain particle
transmission coefficients for the Hauser-Fes hbach calcu-
lations, a s well as for the elastic neutron ang ular dis-
tributions. In most cases, we used optical potential of
Lohr and Haber li [243] for deuterons, the McFadden-
Satchler potential [244] for α-particles, and for tritons
the Bec cheti-Greenlees [245] potential. For protons, we
used the Becchetti-Greenlees potential below 20 MeV and
the relativistic medium-energy global potential of Mad-
land [246] ab ove 20 MeV.
In certain cases, direct reaction cross sec tions to dis-
crete states were calc ulated with the ECIS96 code [26]
using defo rmation parameters compiled in Nuclear Data
Sheets. The optical potential parameters were obtained
using a combination of a grid search code and the in-
teractive optical model viewer ECISVIEW [247], both
built around the coupled channels code ECIS96. The e n-
ergy dependence of the optical model parameters is as
described in Ref. [191]. This optical potential was used
for the calculation of neutron transmiss ion coefficients
and dir e c t cr oss sectio ns .
Discrete level da ta from Nuclear Data Sheets were
matched to continuum level densities using the formula-
tion of Ignatyuk et al. [248] and pairing and shell param-
eters from the Cook [249] analysis. Neutron and charged-
particle transmission coefficients were obtained from the
optical potentials. Gamma-ray transmission c oefficients
were calculated using the Kop e cky-Uhl model [47].
Preequilibrium corrections were pe rformed in the
course of the GNASH calculations using the exciton
model of Ka lbach [250, 251], validated by comparison
with calc ulations using Feshbach-Kerman-Koonin (FKK)
theory. The energy-angle-correlations for all outgoing
particles are based on Kalbach systematics [55].
As we discussed in Section III.E, for incident neutrons
the LA150 evaluations were recreated by Trellue and
Chadwick using a corrected version of the nuclear reac-
tion model code GNASH. In this way we removed a bug
that led to a previous overestimate of particle produc-
tion in the earlier version (ENDF/B-VI.8) of the proton
sublibrary [252].
Altogether, 40 evaluatio ns (including
9
Be) falling into
this category are contained in the proton sublibrary.
They cover materials mostly releva nt to the Accelerator
Driven Systems and medical applications such as cancer
radiation-therapy. Cross sections and sp ectra for produc-
ing individual residual nuclei are included for reactions
that exceed a cross section of approximately 1 nb at any
energy. Generally, the evaluated proton emission spectra
are in rea sonable agreement with the exper imental data.
For deuteron and α ejectiles, the quality of agreement
is poorer. However, modeling cluster emission in these
nuclei is difficult, and the cross sections are small, so the
practical impact is low.
B. Deuteron reaction sublibrary
The deuteron sublibrary contains five LANL evalua-
tions.
1. Reactions d+d and d+t
Reaction d+d. The d+d evaluation is based on the
4
He system R-matrix analysis by G. Hale, LANL. It con-
tains integrated cross sections and angular distributions
for the reactions initiated by deuterons on
2
H at deuteron
energies up to 10 MeV. All the information has been cal-
culated from the para meters of an extensive multi- chan-
68