Carranza E. Geochemical anomaly and mineral prospectivity mapping in GIS
Подождите немного. Документ загружается.

172 Chapter 6
note of the following caveats in the interpretation of results of the distance distribution
method. Firstly, the distance distribution method assumes that the point geo-objects of
interest are Poisson-distributed (Berman, 1977). However, the results of point pattern
analysis and fractal analyses presented earlier show that mineral deposit occurrences are
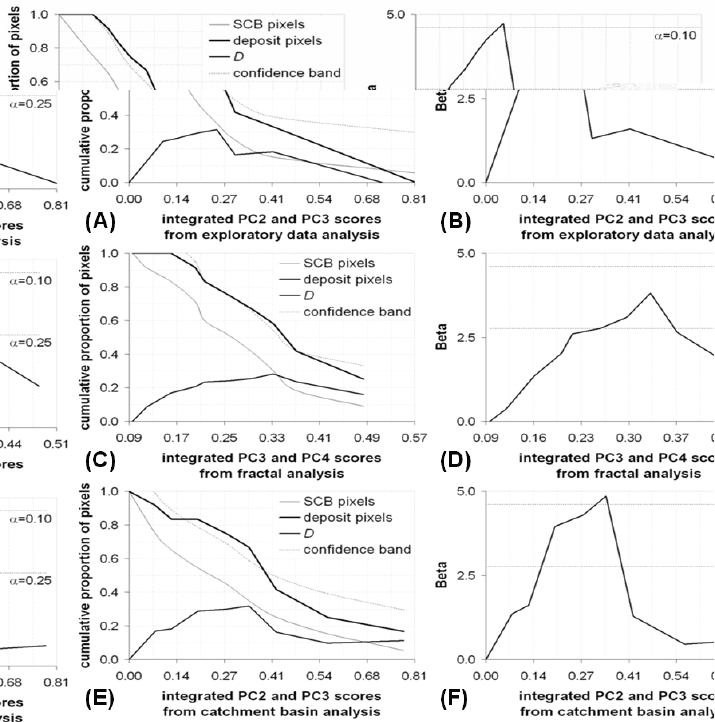
Fig. 6-12. Graphs of cumulative proportions of sample catchment basin (SCB) pixels and deposit
pixels in SCBs defined by descending values of derivative stream sediment geochemical data
(SSGD) and corresponding graphs of β-statistics of differences (D) between the cumulative
proportion curves, Aroroy district (Philippines). Confidence bands are for α=0.25. Analysis o
f
spatial association between epithermal Au deposit occurrences and [(A), (B)] integrated PC2-PC3
scores obtained in the exploratory data analysis (see Chapter 3), [(C), (D)] integrated PC3-PC4
scores obtained in the fractal analysis (see Chapter 4) and [(E), (F)] integrated PC2-PC3 scores
obtained in the catchment basin analysis (see Chapter 5).
Analysis of Geologic Controls on Mineral Occurrence 173
usually not Poisson-distributed. Secondly, the distance distribution method assumes that
the linear (or point) geological features under examination have both uniform and
random distribution in a study area (Berman, 1977). Certainly, in many cases, this
assumption is inapplicable; linear (or point) geological features may exhibit clustering in
some parts of a study area and/or are sparse in other parts of a study area. Anyhow, the
problem associated with this assumption about the distribution of linear (or point)
geological features is avoided by using either a very large number of uniformly
distributed random points (Bonham-Carter, 1985; Berman, 1986) or all pixels in a study
area (Bonham-Carter, 1994). Finally, one wonders why all lines in a set of lines (e.g., all
NNW-trending faults) are used in the analysis even if mineral deposits are associated
with only some of these lines. The following section explains another method, in which
only lines (or points) nearest to points of interests are used in the spatial association
analysis.
Distance correlation method
The concept of the distance correlation method was developed and demonstrated by
Carranza (2002) and Carranza and Hale (2002b) to characterise quantitatively spatial
association between a set of points of interest (i.e., occurrences of mineral deposits of the
type sought and a set of lines (e.g., faults/fractures) or points (e.g., centroids of porphyry
stocks). This method is a non-parametric test of spatial association between a set of point
geo-objects and a set of linear (or point) geo-objects because it does not involve testing
statistical significance of spatial association. However, as demonstrated by Carranza
(2002) and Carranza and Hale (2002b) and by the results of analyses in this volume, the
method provides results that are similar to the results obtained by application of the
distance distribution method.
Consider points P
jx
(j=1, 2,…, n points) of interest, each at a certain distance X
j
from
a nearest line L
i
(i=1, 2,…, m lines), and their corresponding nearest neighbour points P
j0
on line L
i
, and an arbitrary point AP (Figure 6-13). Hence, there are two sets of measured
distances, d
jx
and d
j0
, from AP to P
jx
and to P
j0
, respectively. If all P
jx
points lie exactly
on L
i
(i.e., P
jx
=P
j0
and X
j
=0), then d
jx
= d
j0
and the Pearson correlation coefficient
0jjx
dd
r is unity or equal to 1, which implies a ‘perfect’ spatial association between P
jx
and L
i
. However, if some or every P
jx
does not lie exactly on L
i
and if X
j
is variable (as
in most, if not all, cases of distances between mineral deposit occurrences and curvi-
linear or point geologic features), then d
jx
≠ d
j0
and
0jjx
dd
r ≠ 1. In this latter case, the
spatial association can be qualified as ‘imperfect’ and needs to be characterised
quantitatively.
Now consider points P
jy
, lying along a line segment ⊥L
i
(i.e., perpendicular to L
i
)
from P
j0
passing through P
jx
, at equal distances Y
j
from line L
i
. So, for every Y
j
there are
also two sets of measured distances, d
jx
and d
jy
, from AP to P
jx
and to P
jy
, respectively.
Suppose further that most of the points P
jx
lie preferentially, due to intrinsic controls,
within a certain range of distances Y
j
from their respective nearest L
i
neighbours. One
174 Chapter 6
can then imagine that the Pearson correlation coefficient
jyjx
dd
r increases as P
jy
points
are moved away from P
j0
towards the range of distances Y
j
where most of points P
jx
lie
preferentially away from their respective L
i
neighbours. One can further imagine that the
Pearson correlation coefficient
jyjx
dd
r decreases as P
jy
points are moved away from P
j0
from the range of distances Y
j
where most of points P
jx
lie preferentially away from their
respective L
i
neighbours towards the other end of the line segment ⊥L
i
. Thus, in a graph
with values
jyjx
dd
r in the vertical axis and values of Y
j
in the horizontal axis, a concave-
downward curve is obtained. The distance correlation method endeavours, therefore, to
find a distance Y
j
along line segments ⊥L
i
at which the value of the Pearson correlation
coefficient
jyjx
dd
r is highest (i.e., the apex of the downward-concave curve). This
distance is hereafter referred to as Y
j
max
r
. At distance Y
j
max
r
, the differences between d
jy
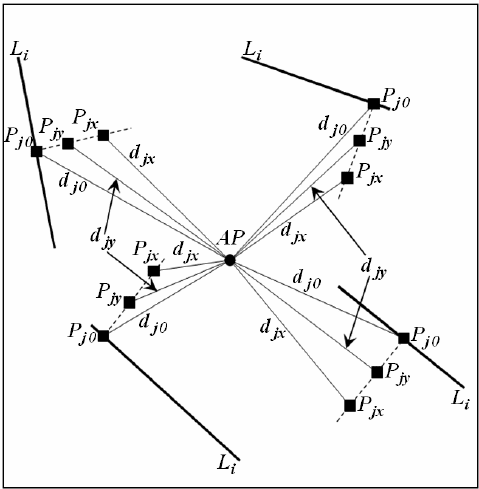
Fig. 6-13. Diagram to illustrate the distance correlation method for quantifying spatial association
between a set of points (P
jx
) of interest and their respective nearest lines L
i
(or points P
j0
). The
method compares correlations (
jyjx
dd
r ) between distances d
jx
from an arbitrary point (AP) to points
P
jx
and distances d
jy
from the same AP to points P
jy
at regular intervals along a line starting from
the nearest neighbour points P
j0
on L
i
and passing through P
jx
. The spatial association between
points P
jx
and nearest neighbour lines L
i
is characterised by the maximum
jyjx
dd
r (see text for
further explanation).
Analysis of Geologic Controls on Mineral Occurrence 175
and d
jx
are minimal (i.e., P
jx
and P
jy
are close enough), which implies that most of the
points P
jx
lie preferentially at distances about Y
j
max
r
from their respective nearest L
i
neighbours. Hence, the distance Y
j
max
r
is considered the distance at which there is
optimum spatial association between a set of points and a set of lines (or points).
Within a certain study area, a very large but finite number of possible APs can be
used for characterising spatial association between P
jx
and L
i
via the distance correlation
method. Because this method is sensitive to the position of an AP with respect to line
segments ⊥L
i
, as shown below, it is recommended to use not just one but many APs in
order to properly characterise the optimum spatial association between P
jx
and L
i
. For
simplicity, Carranza (2002) recommends using nine APs within and along the boundaries
of a study area: its centre (C); the mid-point of its north (N) boundary; its northeast (NE)
corner; the mid-point of its east (E) boundary; its southeast (SE) corner; the mid-point of
its south (S) boundary; its southwest (SW) corner; the mid-point of its west (W)
boundary; and its northwest (NW) corner. Based on at least one of these nine APs, it is
shown below (by application to the case study area) that the longest
rj
Y max
is the
distance of optimum spatial association between P
jx
and L
i
. In the case of a positive
spatial association, more P
jx
points would lie at distances less than or equal to Y
j
max
r
.
Hence, it can be expected that the mean
jyjx
dd
r at distances less than or equal to Y
j
max
r
(hereafter denoted as proximal-
jyjx
dd
r ) is greater than the mean
jyjx
dd
r at distances
greater than Y
j
max
r
(hereafter denoted as distal-
jyjx
dd
r ). In the case of a negative
spatial association, more P
jx
points would lie at distances less than or equal to Y
j
max
r
.
Hence, it can be expected that the proximal-
jyjx
dd
r is less than the distal-
jyjx
dd
r .
The following sequence of procedures can be followed in a raster-based GIS in order
to quantify spatial association between P
jx
and L
i
via the distance correlation method.
1.
On each L
i
nearest to a point P
jx
, determine P
j0
visually. (Note that in case the
geological feature is a ‘point’, then the ‘point’ becomes P
j0
).
2.
Digitise line segments ⊥L
i
(broken lines in Fig. 6-13) starting from P
j0
and passing
through P
jx
. Note that each ⊥L
i
is perpendicular to its respective L
i
. The length of
each ⊥L
i
should be at least equal to the length of the longest X
j
plus twice the
standard deviation of all X
j
. This is mainly based on experience or empiricism but not
on any formalism. That is, points P
jx
may lie preferentially at a certain narrow range
(i.e., small standard deviation) of distances X
j
from L
i
and such distance range may
happen to be very close to the maximum X
j
. Thus, to find Y
j
max
r
properly, the length
of each ⊥L
i
should be at most twice the length of the longest X
j
in order to compare
the proximal-
jyjx
dd
r with the distal-
jyjx
dd
r .
3.
Create points P
jy
along the line segments at regular distance intervals Y
j
from P
j0
.
Hence, P
jy
and P
j0
are the same when Y
j
=0. This can be achieved by converting the
line segments to points at a specified distance interval.
4.
Digitise nine APs as recommended above. Create a map of distances from each AP.
176 Chapter 6
5. For each point P
jx
(i.e., points of interest), determine d
jx
from an AP. Likewise, for
each point P
jy
(i.e., points at regular intervals along ⊥L
i
), determine d
jy
from an AP.
These can be achieved via an overlay operation between point map P
jx
(or P
jy
) and a
map of distances from an AP.
6.
Calculate
jyjx
dd
r for every pair of d
jx
and d
jy
. Create plots of
jyjx
dd
r versus Y
j
.
7.
To test if values of
jyjx
dd
r are significantly different from zero, a t-value can be
calculated as (Davis, 2002):
2
)(1
2
jyjx
jyjx
dd
dd
r
nr
t
−
−
=
, (6-4)
which has n-2 degrees of freedom, where n is equal to the number of P
jx
and thus
equal to the number of P
jy
. A calculated t-value is then compared with a critical t-
value at a certain significance level from published statistical tables.
8.
Repeat steps 5-8 each time for a different AP.
9.
Calculate the mean proximal-
jyjx
dd
r and the mean distal-
jyjx
dd
r . This procedure
aims to determine whether the spatial association between P
jx
and L
i
is positive (i.e.,
mean proximal-
jyjx
dd
r > mean distal-
jyjx
dd
r ) or negative (i.e., mean proximal-
jyjx
dd
r < mean distal-
jyjx
dd
r ).
The application of the distance correlation method to quantify the spatial associations of
the 13 epithermal Au deposit occurrences with the different sets of linear and point
structural features in the case study area yielded satisfactory results (discussed below)
from all of the nine APs (Tables 6-III to 6-VI and Fig. 6-14).
Table 6-III and Fig. 6-14A indicate that there is positive spatial association between
the epithermal Au deposit occurrences and NNW-trending faults/fractures in the study
area and the positive spatial association is optimal within 0.2 km of NNW-trending
faults/fractures. Inspection of the individual distances between the epithermal Au
deposits and NNW-trending faults/fractures shows that eight (or 62%) and nine (or 69%)
of the 13 epithermal Au deposits are within 0.1 km and 0.2 km of NNW-trending
faults/fractures, respectively. These results are similar to the results of the distance
distribution analysis (see Figs. 6-9A and 6-9B).
Table 6-IV and Fig. 6-14B indicate that there is positive spatial association between
the epithermal Au deposit occurrences and NW-trending faults/fractures in the study
area and the positive spatial association is optimal within 0.8 km of NW-trending
faults/fractures. Inspection of the individual distances between the epithermal Au
deposits and NW-trending faults/fractures shows that seven (or 54%) and nine (or 69%)
of the 13 epithermal Au deposits are within 0.6 km and 0.8 km of NW-trending
faults/fractures, respectively. These results are similar to the results of the distance
distribution analysis (see Figs. 6-9C and 6-9D).

Analysis of Geologic Controls on Mineral Occurrence 177
Table 6-V and Fig. 6-14C indicate that there is positive spatial association between
the epithermal Au deposits occurrences and intersections of NNW and NW-trending
faults/fractures in the study area and the positive spatial association is optimal within 0.9
km of intersections of NNW- and NW-trending faults/fractures. Inspection of individual
distances between the epithermal Au deposits and intersections of NNW- and NW-
TABLE 6-III
Results of distance correlation calculations to quantify spatial association between occurrences o
f
epithermal Au deposits and NNW-trending faults/fractures, Aroroy district (Philippines). Table
entries in bold pertain to optimal spatial association
AP
rj
Y max
(m)
jyjx
dd
r
t-value*
Proximal-
jyjx
dd
r Distal-
jyjx
dd
r
C 200 0.9981 53.123 0.9962 0.9771
N 200 0.9994 98.819 0.9994 0.9963
NE 100 0.9984 58.081 0.9978 0.9864
E 200 0.9914 25.193 0.9857 0.9249
SE 200 0.9996 112.630 0.9992 0.9949
S 200 0.9999 308.139 0.9999 0.9989
SW 200 0.9989 69.957 0.9985 0.9905
W 200 0.9988 68.604 0.9983 0.9960
NW 100 0.9999 233.427 0.9998 0.9988
*Calculated values of
jyjx
dd
r are significantly different from zero; the critical t-value at
α=0.001 and ν=13-2=11 degrees of freedom is 4.025 (Davis, 2002).
TABLE 6-IV
Results of distance correlation calculations to quantify spatial association between occurrences o
f
epithermal Au deposits and NW-trending faults/fractures, Aroroy district (Philippines). Table
entries in bold pertain to optimal spatial association.
AP
rj
Y max
(m)
jyjx
dd
r
t-value*
Proximal-
jyjx
dd
r Distal-
jyjx
dd
r
C 800 0.9739 14.219 0.9526 0.8497
N 600 0.9893 22.519 0.9811 0.9230
NE 600 0.9872 20.513 0.9787 0.8917
E 800 0.9752 14.624 0.9501 0.8932
SE 600 0.9969 41.905 0.9945 0.9815
S 700 0.9956 35.309 0.9925 0.9565
SW 600 0.9854 19.215 0.9727 0.8961
W 700 0.9878 20.841 0.9765 0.9372
NW 600 0.9975 46.962 0.9954 0.9598
*Calculated values of
jyjx
dd
r are significantly different from zero; the critical t-value at
α=0.001 and ν=13-2=11 degrees of freedom is 4.025 (Davis, 2002).

178 Chapter 6
trending faults/fractures shows that seven (or 54%) and ten (or 77%) of the 13
epithermal Au deposits are within 0.8 km and 0.9 km of intersections between NNW-
and NW-trending faults/fractures, respectively. These results are similar to the results of
the distance distribution analysis (see Figs. 6-10A and 6-10B).
Table 6-VI and Fig. 6-14D indicate that there is positive spatial association between
TABLE 6-V
Results of distance correlation calculations to quantify spatial association between occurrences o
f
epithermal Au deposits and intersections of NNW- and NW-trending faults/fractures, Aroroy
district (Philippines). Table entries in bold pertain to optimal spatial association.
AP
rj
Y max
(m)
jyjx
dd
r
t-value*
Proximal-
jyjx
dd
r Distal-
jyjx
dd
r
C 800 0.9765 15.075 0.9443 0.8399
N 800 0.9928 27.528 0.9837 0.9446
NE 600 0.9916 25.491 0.9835 0.9197
E 600 0.9776 15.404 0.9437 0.7355
SE 800 0.9958 35.928 0.9913 0.9705
S 900 0.9969 42.306 0.9923 0.9749
SW 800 0.9908 24.291 0.9765 0.9212
W 800 0.9869 20.250 0.9741 0.9191
NW 800 0.9980 52.751 0.9952 0.9758
*Calculated values of
jyjx
dd
r are significantly different from zero; the critical t-value at
α=0.001 and ν=13-2=11 degrees of freedom is 4.025 (Davis, 2002).
TABLE 6-VI
Results of distance correlation calculations to quantify spatial association between occurrences o
f
epithermal Au deposits and NE-trending faults/fractures, Aroroy district (Philippines). Table
entries in bold pertain to optimal spatial association.
AP
rj
Y max
(m)
jyjx
dd
r
t-value*
Proximal-
jyjx
dd
r Distal-
jyjx
dd
r
C 300 0.9926 27.094 0.9902 0.9513
N 300 0.9996 118.041 0.9993 0.9959
NE 300 0.9995 102.544 0.9993 0.9953
E 300 0.9857 19.433 0.9822 0.9138
SE 300 0.9986 62.821 0.9977 0.9893
S 300 0.9990 74.858 0.9983 0.9926
SW 300 0.9993 92.141 0.9989 0.9968
W 300 0.9989 71.849 0.9973 0.9901
NW 300 0.9991 76.211 0.9983 0.9917
*Calculated values of
jyjx
dd
r are significantly different from zero; the critical t-value at
α=0.001 and ν=13-2=11 degrees of freedom is 4.025 (Davis, 2002).
Analysis of Geologic Controls on Mineral Occurrence 179
the epithermal Au deposits occurrences and NE-trending faults/fractures in the study
area and the positive spatial association is optimal within 0.3 km of NE-trending
faults/fractures. Inspection of the individual distances between the epithermal Au
deposits and NE-trending faults/fractures shows that eight (or 62%) of the 13 epithermal
Au deposits are within 0.3 km of NE-trending faults/fractures. These results are similar
to the results of the distance distribution analysis (see Fig. 6-11).
Although application of the distance correlation method produces similar results to
the application of the distance distribution method, the former does not indicate the
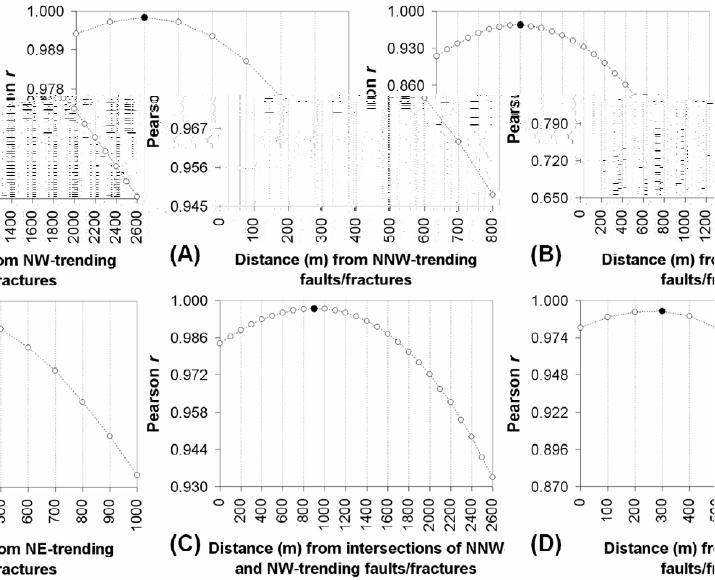
Fig. 6-14. Plots of
jyjx
dd
r (Pearson r) versus Y
j
(distances from linear geological features), with
respect to an arbitrary point (AP), depicting spatial associations between epithermal Au deposits
occurrences and faults/fractures in the Aroroy district (Philippines). Analysis for (A) NNW-
trending faults/fractures using centre AP (see Table 3-III), (B) NW-trending faults/fractures using
centre AP (see Table 3-IV), (C) intersections between NNW- and NW-trending faults/fractures
using south AP (see Table 3-V) and (D) NE-trending faults/fractures using centre AP (see Table 3-
VI). A dot along the plots represents the distance
rj
Y max
at which
jyjx
dd
r is highest and thus
the distance of optimal spatial association between epithermal Au deposit occurrences and a set o
f
faults/fractures.
180 Chapter 6
statistical significance of spatial association between point geo-objects of interest and
linear (or point) features. In addition, the results shown in Tables 6-III to 6-VI indicate
that the distance correlation method is sensitive to the position of an AP with respect to
line segments ⊥L
i
, so that not just one but at least nine APs are recommended in order to
properly characterise the optimum spatial association between P
jx
and L
i
. This is
demonstrated further with the analysis of the spatial association between the centroids of
mapped units of Nabongsoran Andesite porphyry and intersections of NNW- and NW-
trending faults/fractures in the case study area.
There are very few (i.e., four) mapped units of Nabongsoran Andesite and they are
situated only in the southwest quadrant of the study area (see Fig. 3-9). The distances
between each centroid and its nearest neighbour intersection of NNW- and NW-trending
faults/fractures vary from 230 to 700 m, with a mean of 460 m and standard deviation of
205 m. The length of each line segment ⊥L
i
, which passes through each of the centroids
starting from their respective nearest neighbour intersection of NNW- and NW-trending
faults/fractures, is set at 1200 m. The results of the analyses based on each of the nine
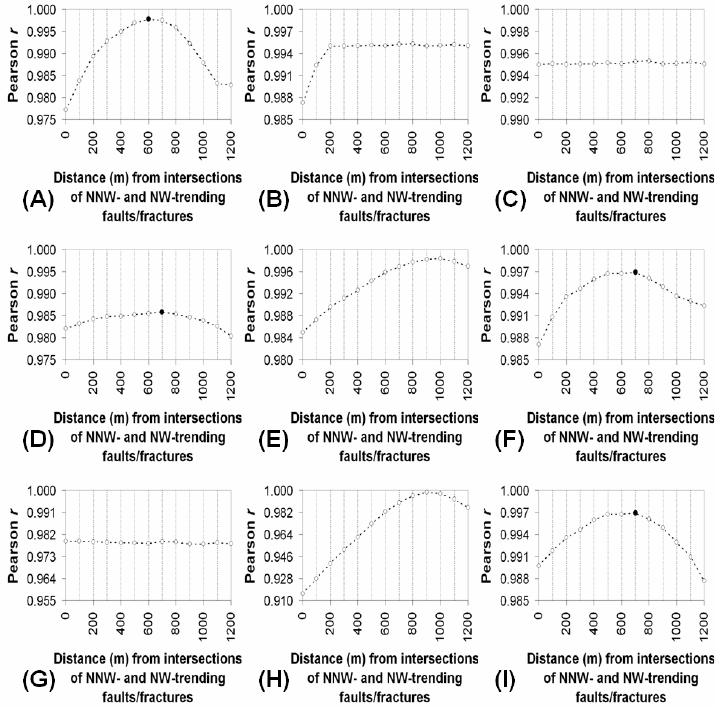
recommended APs are illustrated in Fig. 6-15. The north, northeast and southwest APs
resulted in ‘flat’ graphs of
jyjx
dd
r
versus Y
j
(Figs. 6-15B, 6-15C and 6-15G,
respectively), although peak values of
jyjx
dd
r at 800 m can be observed if the
resolutions of the y-axes of these graphs are enhanced. The southeast and west APs
resulted in downward-concave graphs of
jyjx
dd
r versus Y
j
with peak values of
jyjx
dd
r
at 1000 m and 900 m, respectively (Figs. 6-15E and 6-15H, respectively). These results
are unsatisfactory because the distances Y
j
max
r
obtained are well beyond the maximum
X
j
(i.e., 700 m). Nevertheless, the results obtained based on the centre, east, south and
northwest APs (Figs. 6-15A, 6-15D, 6-15F and 6-15I, respectively) are satisfactory,
because they clearly show downward-concave graphs of
jyjx
dd
r
versus Y
j
with peak
values of
jyjx
dd
r mostly at 700 m.
The factors for the unsatisfactory results obtained based on the north, northeast,
southwest, southwest and west APs and the satisfactory results obtained based on the
centre, east, south and northwest APs are given in Table 6-VII. Satisfactory results are
obtained when an AP forms intermediate angles (i.e., mostly between 30º and 60º) with
⊥L
i
and when the distances (d
jy
) between an AP and every point P
jy
along ⊥L
i
have
relatively high coefficients of variation (i.e., ratio of standard deviation to mean). Note
that both of these two factors apply to the north AP, which forms angles with every ⊥L
i
similar to that formed by the centre AP although distances (d
jy
) from the former to points
P
jy
along line segments ⊥L
i
have relatively low coefficients of variation compared to
distances from the former. Note further that APs forming, on average, low angles (<20°)
with ⊥L
i
result in ‘flat’ graphs of
jyjx
dd
r versus Y
j
, whereas APs forming, on average,
high angles (>63°) with ⊥L
i
result in over-estimation of Y
j
max
r
.
Based on the results shown in Fig. 6-15 and summarised in Table 6-VIII for the APs
providing the satisfactory results, there is positive spatial association between the four
Analysis of Geologic Controls on Mineral Occurrence 181
centroids of mapped units of Nabongsoran Andesite porphyry and their respective
nearest neighbour intersection of NNW- and NW-trending faults/fractures. The positive
spatial association is optimal within 0.7 km of intersections NNW- and NW-trending
Fig. 6-15. Plots of
jyjx
dd
r (Pearson r) versus Y
j
(distances from linear geological features) with
respect to an arbitrary point (AP), depicting spatial associations between centroids of Nabongsoran
Andesite porphyry and intersections of NNW- and NW-trending faults/fractures in the Aroroy
district (Philippines), based on (A) centre AP, (B) north AP, (C) northeast AP, (D) east AP, (E)
southeast AP, (F) south AP, (G) southwest AP, (H) west AP and (I) northwest AP. A dot along
some of the plots represents the distance
rj
Y max
at which
jyjx
dd
r is highest and, thus, the
distance of optimal spatial association between centroids of Nabongsoran Andesite porphyry and
intersections of NNW- and NW-trending faults/fractures.