Blank L., Tarquin A. Engineering Economy (McGraw-Hill Series in Industrial Engineering and Management)
Подождите немного. Документ загружается.

SECTION 2.5 Arithmetic Gradient Factors (P
IG
and AI
G)
Since the va
lu
e
of
th
e factor decreases as n increases, c is subtracted from the factor
va
lu
e for
It
= 45.
x = 0.17l2 - 0.0183 = 0.1529
Comment
Though
it
is
possible to perfo
rm
two-way linear interpolation,
it
is much easier and
more accurate to use
th
e factor form
ul
a or a spreadsheet function.
2.5 ARITHMETIC GRADIENT
FACTORS
(PIG
AND
AIG)
An arithmetic gradie
nt
is a cash flow series that either increases or decreases by
a
co
nstant amount.
The
cash flow, whether income
or
disbursement, changes by
th
e same arithmetic amount each period.
The
amount
of
the increase
or
decrease
is the gradie
nt.
For
examp
le, if a manufacturering engineer
pr
edicts that the cost
of
maintaining a robot will increase by
$500
per year until the machine is retired,
a gradient series is involved and the amount
of
the gradient is
$500
.
Form
ul
as
pr
eviously developed for an A series have year-end amounts
of
equal
valu
e.
In
th
e case
of
a gradient, each year-end cash flow is different, so new for-
mulas
mu
st be derived. First, assume that the cash
fl
ow at the end
of
year I is not
part
of
th
e gradient series, but is rather a base amount. This is convenient because
in
ac
tu
al applications, the base amount is usually larger
or
smaller than the gra-
dient increase or decrease.
For
example,
if
you purchase a used
car
with a
I-year
warranty, you might expect to pay the gasoline and insurance costs during the first
year
of
operation. Assume these cost $1500; that is, $1500 is the base amount.
After
th
e
fi
rst year, you absorb the cost
of
repairs, which could reasonably be
expected to increase each year. If you estimate that total costs will increase by
$50 each year, the a
mount
the second year is $1550, the third $1600, and so on to
year
n,
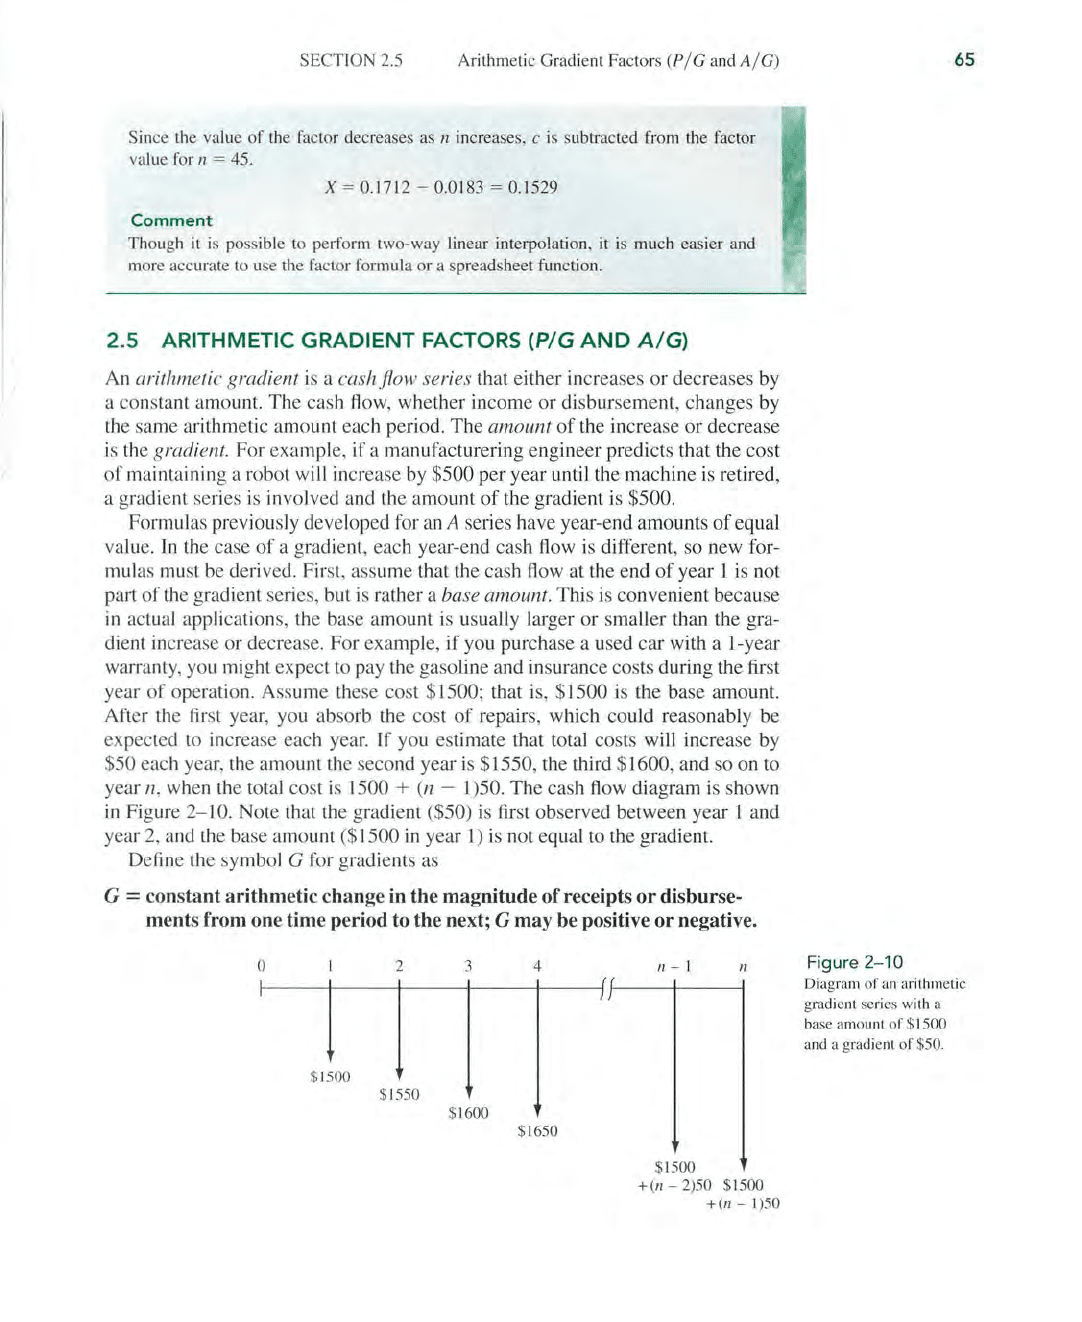
when the total cost is 1500 + (n - 1)50.
The
cash
fl
ow diagram is shown
in
Figure
2-10.
Note
that the gradient ($
50
) is first observed bet
wee
n year 1 and
year 2, a
nd
the base amount ($ 1500 in year
1)
is not equal to the gradient.
Define the sy
mb
ol G for gradients as
G = constant arithmetic change in the magnitude
of
receipts
or
disburse-
ments from one time period to the next; G may be positive or negative.
o
2
3
$ 1500
$ 1550
$ 1600
4
J
$1650
/'I - I
/'I
$ 1500
+
(11
- 2)
50
$1500
+
(11-
1
)5
0
65
Figure 2-
10
Diagram of an arithme
ti
c
gradient se
ri
es wi
th
a
base amount
of
$ 1500
an
d a gradient
of
$
50
.
66
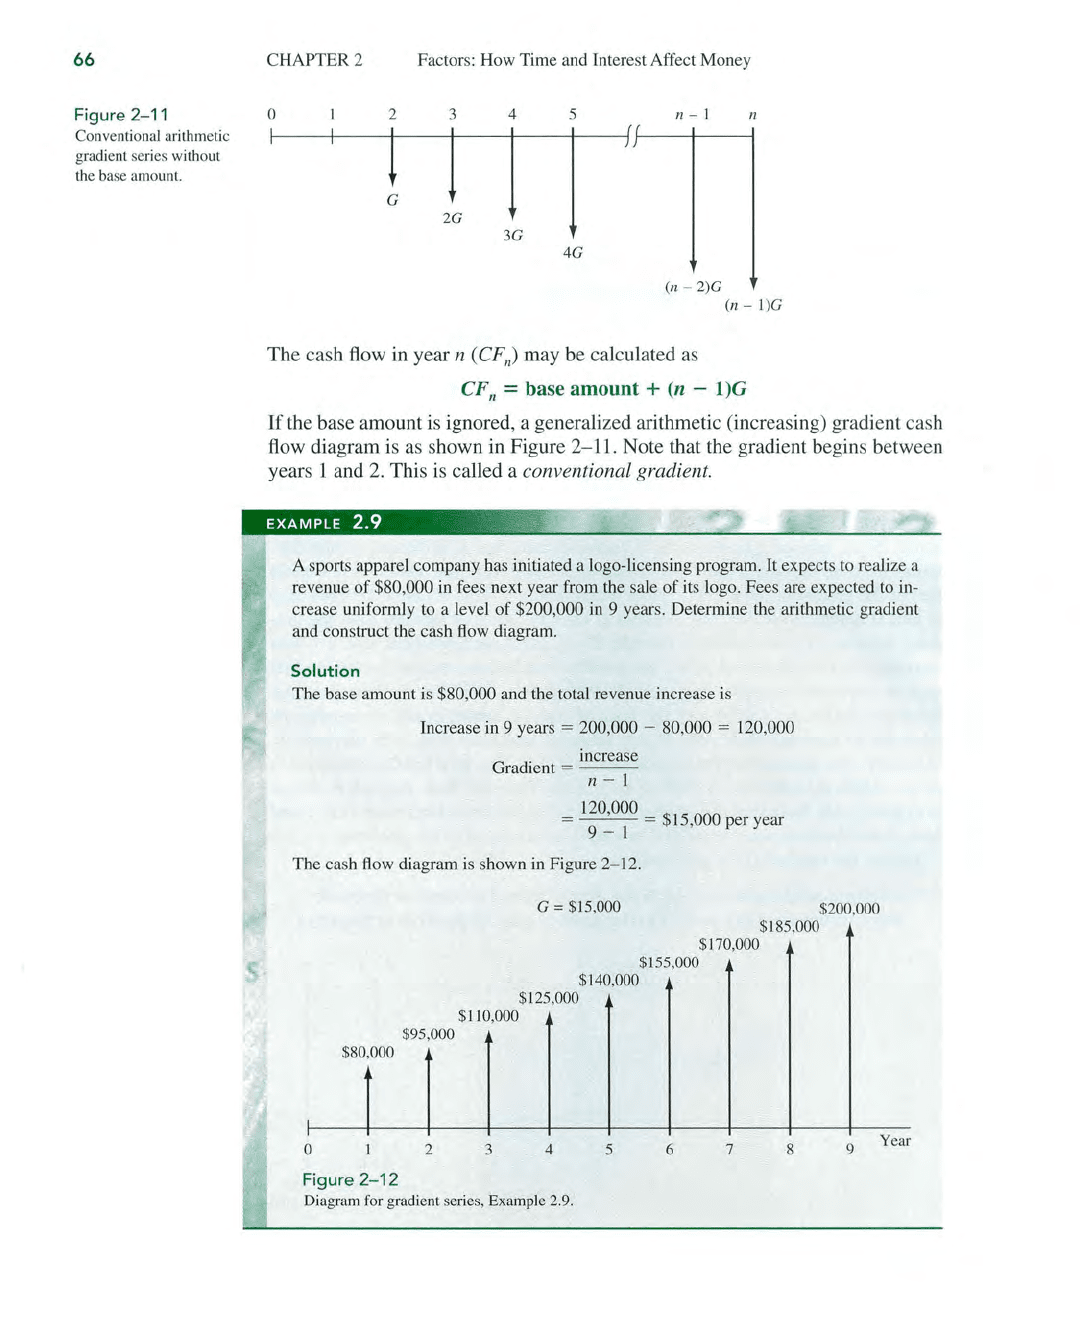
Figure 2-11
Conventional arithmetic
gradient se
ri
es without
th
e
ba
se amount.
CHAPTER 2 Factors: How Time and Interest Affect Money
4G
(n -
2)G
(n - J)G
The cash flow
in
year n
(CF
Il
) may be calculated
as
CF
Il
= base amount + (n -
l)G
If
the base amount is ignored, a generalized arithmetic (increasing) gradient cash
flow diagram is
as
shown in Figure 2-11. Note that the gradient begins between
years 1 and
2.
This
is
called a conventional gradient.
EXAMPLE
2.9
;~~
.
A sports apparel company has initiated a logo-licensing program. It expects to realize a
revenue
of
$80,000
in
fees next year from the sale
of
its logo. Fees are expected
to
in-
crease uniformly to a level
of
$200,000 in 9 years. Determine the arithmetic gradient
and construct the cash
flow
diagram.
Solution
The base amount
is
$80,000 and the total revenue increase
is
Increase in 9 years = 200,000 - 80,000 = 120,000
G d
·
increase
ra
lent =
---
n - 1
120,000
=
~
= $15,000 per year
The cash
flow
diagram is shown in Figure 2-12.
G = $15,000
$140,000
$125,000
$110,000
$95,000
$80,000
o 2 3 4 5
Figure
2-12
Diagram for gradient series, Example 2.9.
$185,000
$170,000
$155,000
6 7 8
$200,000
9
Year
SECTION 2.5 Arithmetic Gradient Factors
(PIG
and
AI
G)
In this text, three factors are derived for arithmetic gradients: the
PIG
factor
for present worth, the
AI
G factor for annual series and the
FIG
factor for future
worth. There are several ways to derive them. We use the single-payment present
worth factor
(PI
F,i,n), but the same result can be obtained using the F I P, F I
A,
or
PIA
factor.
In Figure
2-11, the present worth at year 0
of
only the gradient is equal to the
sum
of
the present worths
of
the individual values, where each value is consid-
ered a future amount.
P = G(PIF,i,2) + 2G(PIF,i,3) + 3G(PIF,i,4) +
...
+
[(n
-
2)G](PIF
,i,n
-1)
+
[(n
-l)G](PIF,i,n)
Factor out G and use the
PI
F formula.
P = G + + +
...
+ +
[211]
l
1 2 3
n-2
n-1J
(1
+
if
(1
+
i)3
(1
+
i)4
(1
+
on
- I
(1
+ i)" .
Multiplying both sides
of
Equation [2.11] by
(1
+ 0
1
yields
l
1 2 3
n-2
n-1
J
P(l
+ i) 1 = G
(1
+
i)1
+
(1
+
if
+
(1
+
i)3
+
...
+
(1
+
on
-2 +
(1
+
on
- I
[2.12]
Subtract Equation [2.11] from Equation [2.12] and simplify.
iP =
Gl
1 + 1 +
...
+ 1 + 1 J -
Gl--n-J
(1
+
i)1
(l
+
if
(1
+
i)n-l
(1
+ i)"
(1
+ i)"
[2.13]
The left bracketed expression is the same as that contained in Equation [2.4],
where the
PIA
factor was deri ved. Substitute the closed-end form
of
the
PIA
fac-
tor from Equation [2.6] into Equation [2.13] and solve for
P to obtain a simpli-
fied relation.
G
l(1
+ i)" - 1 n J
P - i i(1 +
i)"
- (1 +
i)"
[2.14]
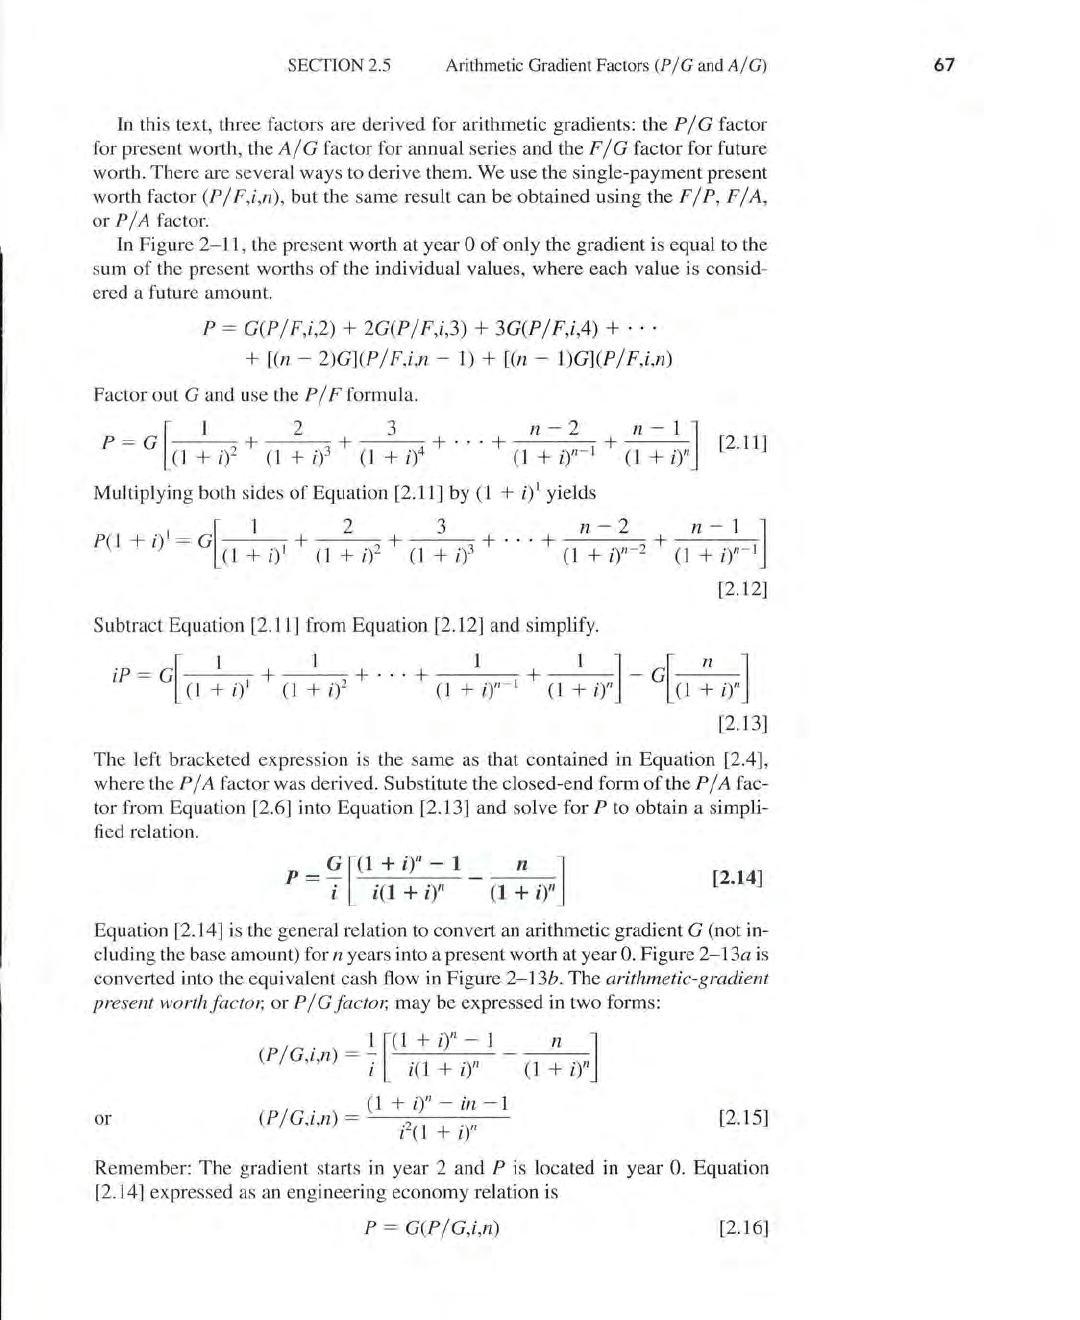
Equation
[2.14]
is
the general relation to convert an arithmetic gradient G (not in-
cluding the base amount) for n years into a present worth at year
O.
Figure
2-13a
is
converted into the equivalent cash flow
in
Figure
2-13b
.
The
arithmetic-gradient
present worthfactor, or
PIG
factor, may be expressed in two forms:
. 1
l(1
+
it
- 1 n J
(PIG,l,n) = i
i(l
+ i)" -
(1
+
i)"
(1
+
it
- in - 1
(PIG,i,n) =
i2(1
+ i)"
or
[2.15]
Remember:
The
gradient starts in year 2 and P is located in year
O.
Equation
[2.14] expressed as an engineering economy relation is
P = G(PIG,i,n)
[2.16]
67
68
Figure
2-13
Conversion diagram from
an
arithm
et
ic gr
ad
ient to a
pre
se
nt worth.
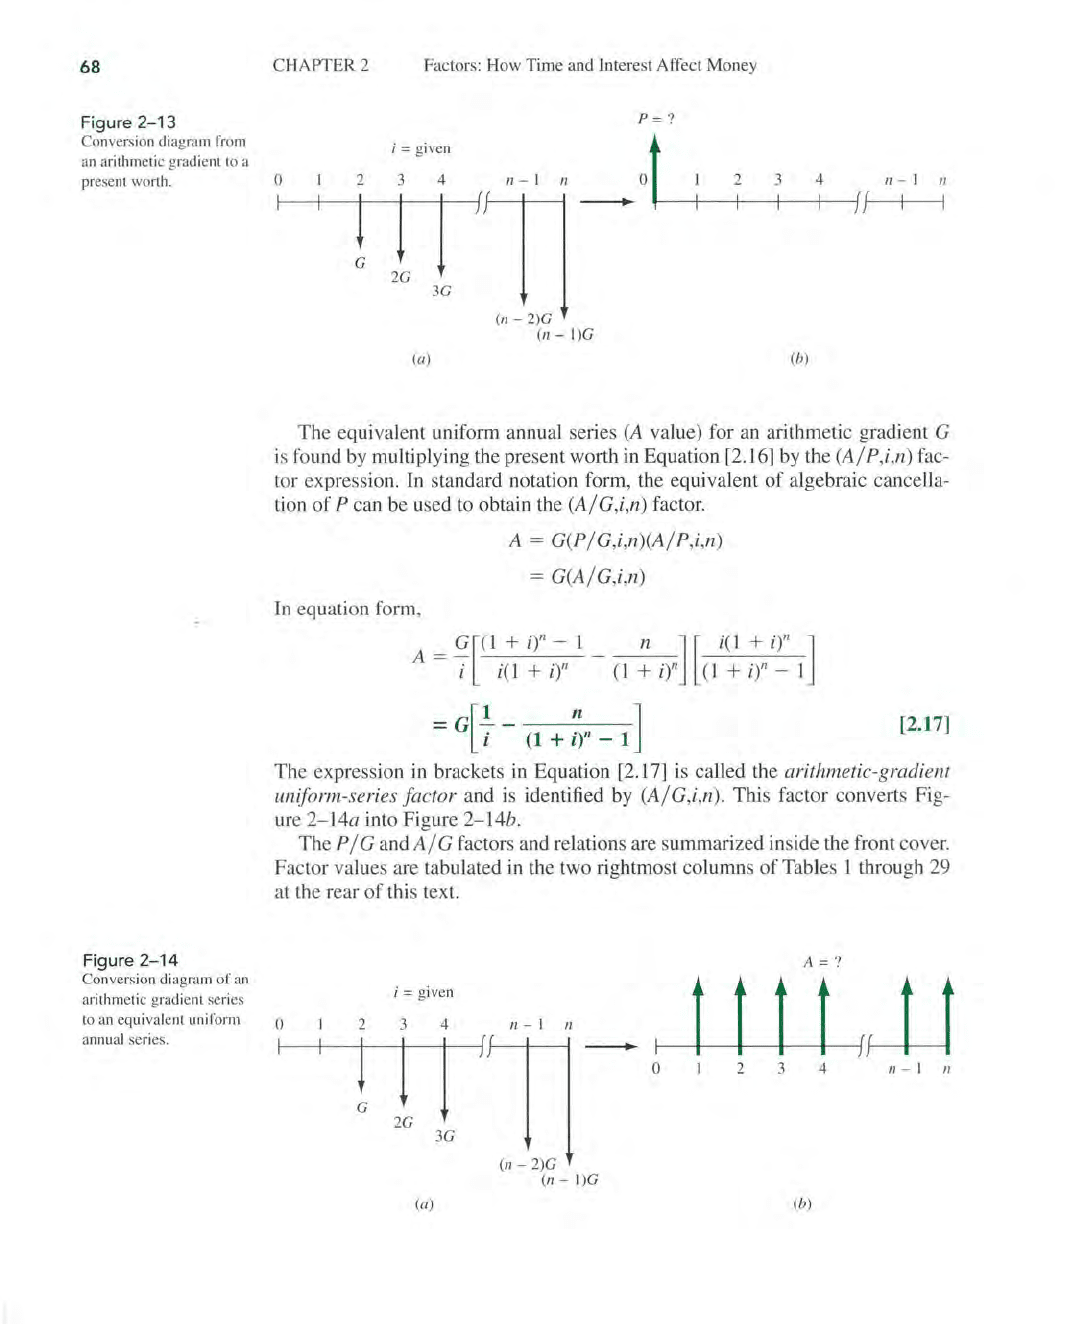
Figure
2-14
Conversion diagram of
an
arithmetic gradient
ser
i
es
to
an
e
quiv
alent
unif
or
m
annual
se
ri
es.
CHAPTER 2
Factors: How Time a
nd
Interest Affect Money
p=
?
i = gi
ve
n t
0f---+_
-+
2
__
3
t----j4_---if
f-n_
-
+-I--jn
_ 0
.-
_-+-_+2
_--1
3
1---+
4
_-1f
fr--
'-' -
;-1
---j"
II!
I I I I
3G
(n - 2)G
(n
- I)G
(a)
(b)
The
equIvalent uniform annual series
(A
value) for an arithmetic gradient G
is found by multiplying the present worth in Equation [2.16]
by
the
(AI
P,i,n) fac-
tor expression. In standard notation form, the equivalent
of
algebraic cancella-
tion
of
P can be used to obtain the (AIG,i,n) factor.
A
=
G(PIG,i,n)(AIP
,i,n)
= G(AIG,i,n)
In equation form,
G[(1 +
it
- 1
n]
[ i(1 + i)" ]
A = i i(1 +
it
-
(1
+
it
(1
+ i)" - I
-
G[
~
-
(1
+
Zn
- 1 ]
[2.17]
The
expression
in
brackets in Equation [2.17]
is
called the arithmetic-gradient
uniform-series
fa
ctor and is identified by (AIG,i,n). This factor converts Fig-
ure
2-14a
into Figure 2
-14b
.
The
PIG and A I G factors and relations are summarized inside the front cover.
Factor values are tabulated in the two rightmost columns
of
Tables 1 through 29
at the rear
of
this text.
°
I
2
l
G
i = given
3
4
I
I
I
J
2G
3G
(a)
A = ?
n - I
It
-
t t t t r
lJ
0
2 3 4
n - I
11
(n - 2)G
(n - I)G
(b)
SECTION 2.5 Arithmetic Gradient Factors
(PIG
and
AI
G)
There
is
no direct, single-cell spreadsheet function
to
calculate P or A for
an
arithmetic gradient. Use the NPV function for
P,
and the PMT function for A,
after all cash flows are entered into cells. (The use
ofNPV
and PMT functions for
this type
of
cash flow series is illustrated in Chapter 3.)
An F
/G
factor (arithmetic-gradient future worth factor) can be derived by
multiplying the
PIG
and
F/P
factors. The resulting factor,
(F/G,i,n),
in
brack-
ets, and engineering economy relation is
The total present worth
P T for a gradient series must consider the base and the
gradient separately. Thus, for cash flow series involving conventional gradients:
• The base amount is the uniform-series amount A that begins in year 1 and
extends through year
n. Its present worth is represented by P
A
.
• For an increasing gradient, the gradient amount must be added to the uniform-
series amount. The present worth
is
Pc.
•
For a decreasing gradient, the gradient amount must be subtracted from the
uniform-series amount. The present worth is
- Pc.
The general equations for calculating total present worth P T
of
conventional
arithmetic gradients are
and
[2.18]
Similarly, the equivalent total annual series are
AT =
AA
+
Ac
and AT =
AA
-
AG
[2.19]
where
AA
is the annual base amount and
Ac
is the equivalent annual amount
of
the gradient series.
A-I"::.
'>Z~oc.?o
-+-
rJO,ouo
Three contiguous counties
in
Florida have agreed
to
pool tax resources already desig-
nated for county-maintained bridge refurbishment. At a recent meeting, the county
engineers estimated that a total
of
$500,000 will be deposited at the end
of
next year
into
an
account for the repair
of
old and safety-questionable bridges throughout the
three-county area. Further, they estimate that the deposits will increase
by
$100,000 per
year for only 9 years thereafter, then cease. Detennine the equivalent
(a) present worth
and
(b) annual series amounts if county funds earn interest at a rate
of
5% per year.
Solution
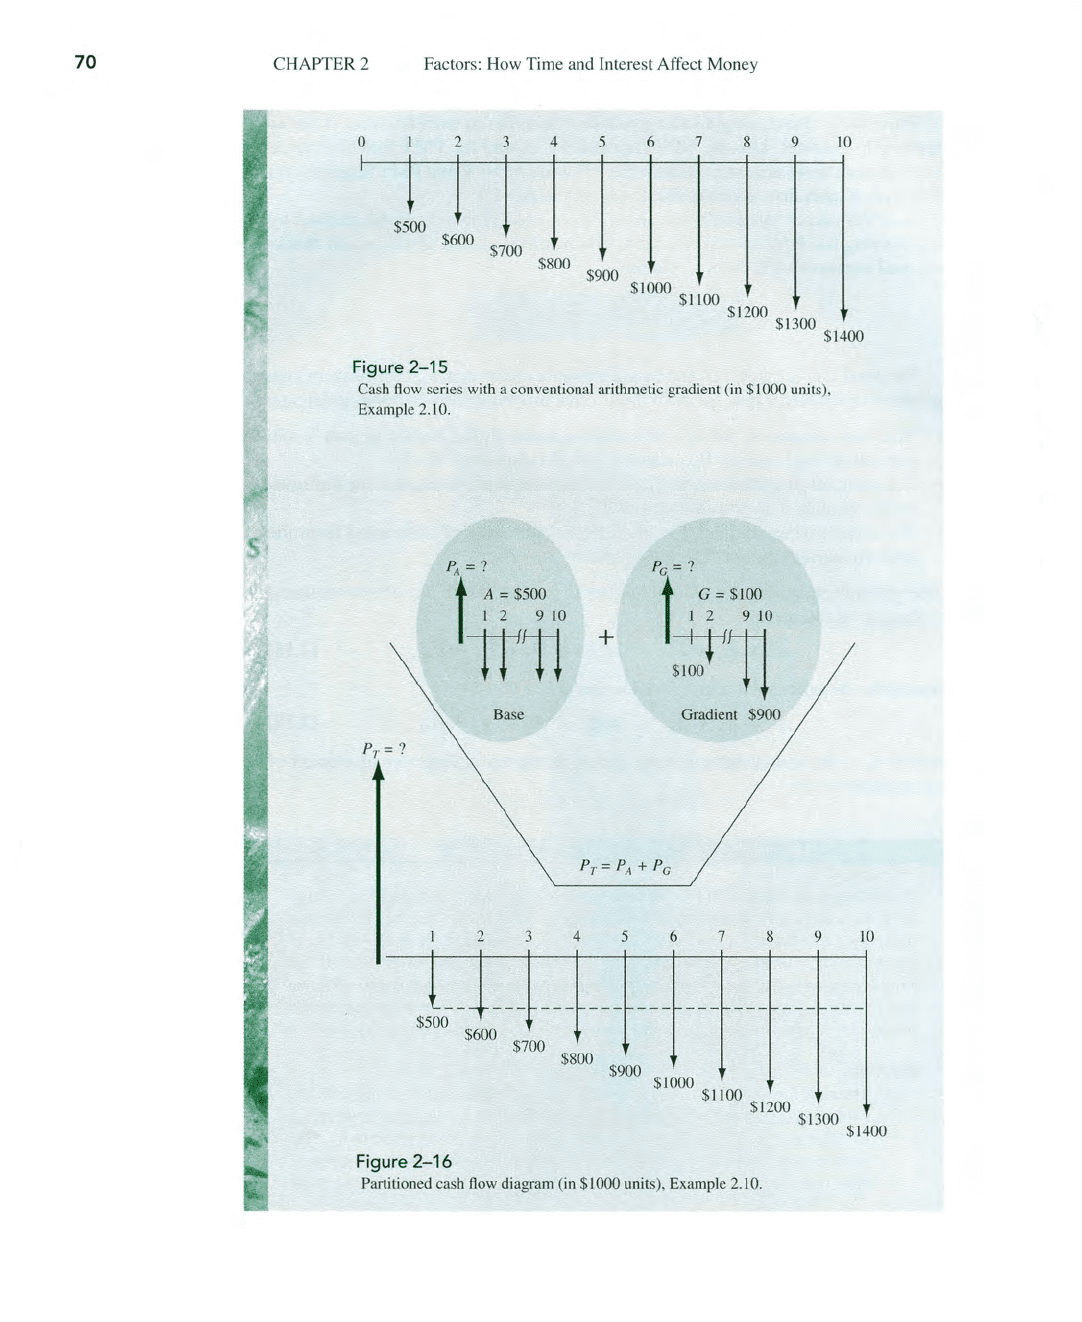
(a) The cash flow diagram from the county's perspective is shown in Figure 2-15.
Two computations must be made and added: the first for the present worth
of
the base amount P
A
and a second for the present worth
of
the gradient Po. The
total present worth
P
T
occurs in year
0.
This
is
illustrated
by
the partitioned
cash
flow
diagram
in
Figure 2-16. In $1000 units, the present worth, from
69
~
1\
Q-Solv
70
CHAPTER 2 Factors: How Time and Interest Affect Money
o
2
3
4
5
6 7 8 9 10
$500
$600 $700
$800 $900
$1000
$1100
$1200
$1300
$1400
Figure
2-15
Cash
fl
ow series with a conventional arithm
et
ic gradient (in $
10
00 units),
Example 2
.1
O.
P
T
= ?
P
A
= ?
$500
t
A = $500
1 2
910
1r11
Base
2 3 4
$600 $700
$800
+
5
$900
Pc = ?
t
G=
$
LOO
I 2 9
JO
::r11
Gradient $900
6
7
8 9
$
10
00
$
]]
00
10
$1200
$1300 $ 1400
Figure
2-16
Partitioned cash flow diagram
(i
n $1000 units), Example
2.
10.
SECTION 2.6 Geometric Gradient Series Factors
Equation [2.18],
is
P
T
= 500(P/A,5%,
IO)
+ 100(P/G,5%,10)
= 500(7.7217) + 100(31.652)
= $7026.05 ($7,026,050)
(b) Here, too,
it
is necessary to consider the gradient and the base amount separately.
The total annual series
kr
is
found by using Equation [2.19].
AT
= 500 + 100(A/G,5%,1O) = 500 + 100(4.0991)
= $909.91 per year ($909,910)
And
AT
occurs from year 1 through year 10.
Comment
Remember: The P
/G
and
A/G
factors determine the present worth and annual series
of the
gradient only. Any other cash
flow
must be considered separately.
If
the present worth
is
already calculated [as
in
part
(a)],
P T can be multiplied
by
the
appropriate
A/
P factor to get
AT'
AT
= P
T
(A/P,5%,1O) = 7026.05(0.12950)
= $909.87 ($909,870)
Round-otf accounts for the $40 difference.
Additional Example 2.16.
2.6 GEOMETRIC GRADIENT
SERIES
FACTORS
It
is common for cash flow series, such as operating costs, construction costs, and
revenues, to increase or decrease from period to period by a
constant percentage,
for example, 5% per year. This uniform rate
of
change defines a geometric gra-
dient series
of
cash flows.
In
addition to the symbols i and n used thus far, we
now need the term
g
= constant rate
of
change, in decimal form, by which amounts
increase or decrease from one period to the next
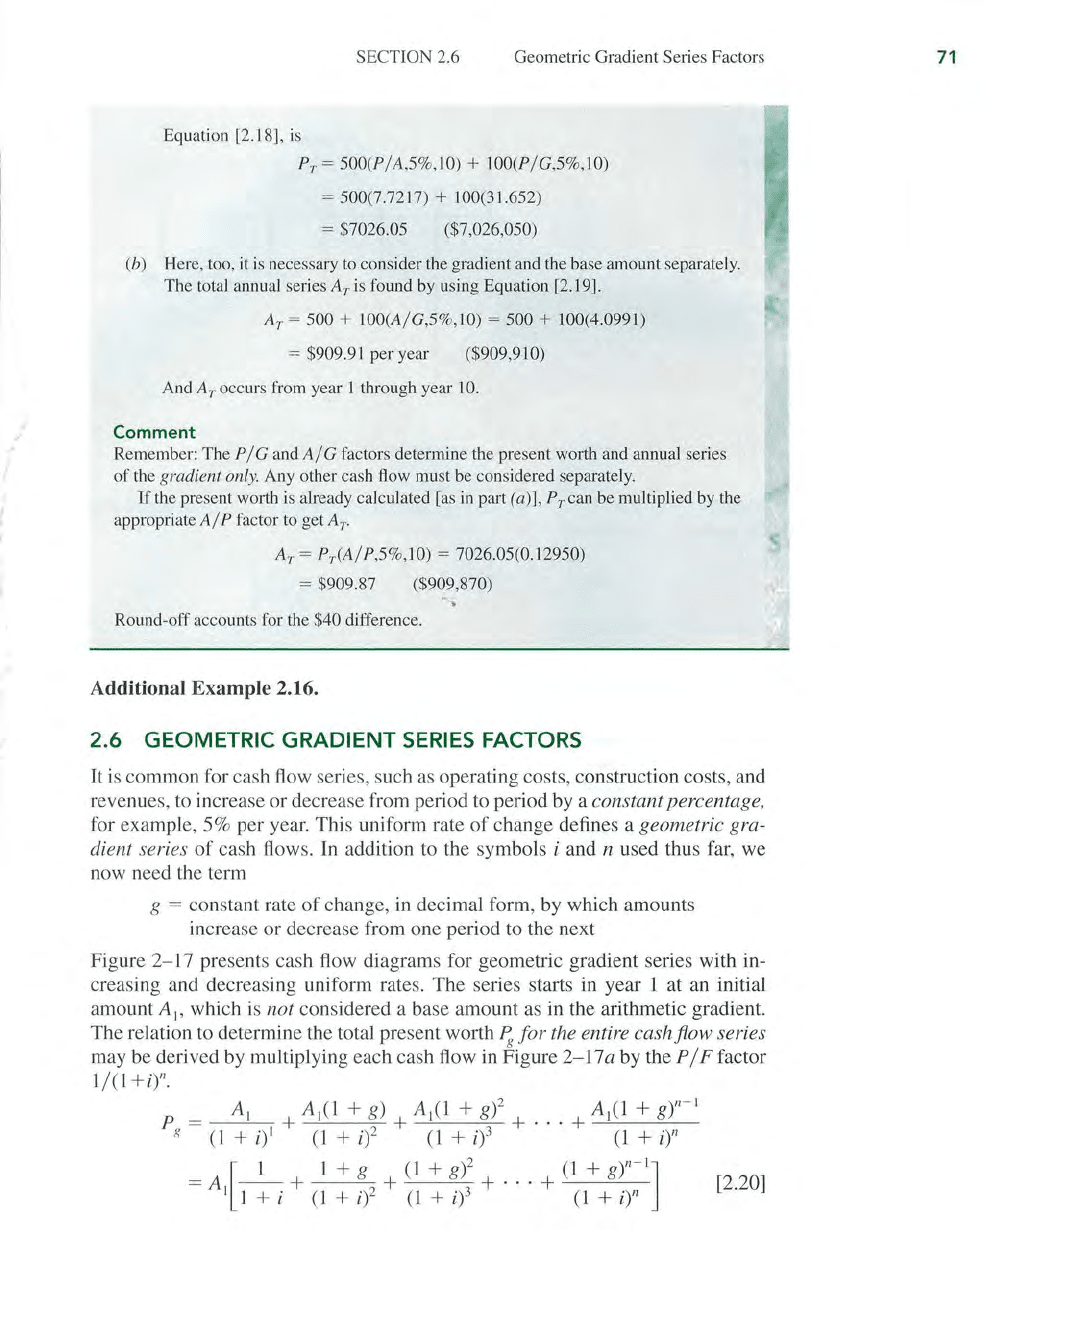
Figure
2-17
presents cash flow diagrams for geometric gradient series with in-
creasing and decreasing uniform rates. The series starts in year 1 at an initial
amount
A
I'
which is
not
considered a base amount as in the arithmetic gradient.
The relation to determine the total present worth
~
for
the entire
cashfiow
series
may be derived by multiplying each cash flow in Figure
2-17
a by the P / F factor
I/O
+i)l1.
AI AI
(l
+
g)
AI
(l
+
g)2
Aj(1
+
gt
-
I
P = + + + . . . + -""-'----"'-'---
~
(1
+
i)1
0+i)2
(1+i)
3
(1+it
= A
--
+ + + .
..
+ - ----''---
l
1 L + g
(1
+
g)2
(1
+
gY
-
I
]
I 1 + i
(1
+
i)2
(1
+
i?
(1
+ i)"
[2.20]
71
72
o
AI
Figure 2-17
CHAP
TE
R 2
Factors: How T
im
e a
nd
Interest Affect Money
i = given
g = given
2
3
4 n 0
AI(I + g)
......
AI(I +
gP
.....
A
ie
l + d ))(
"-
"-
AI
(l
+g),,
- I
(a)
'/
AI
i = given
g = given
2
3
4
n
J:-J
_ -
-J
f-A
-( 1 _ g
)"
- I
-A
I
(l
-g
)3 I
/A
1
(1
-g?
//A
I( l
-g)
(b)
Cash now
di
agram of (a)
in
creas
in
g and (b) d
ec
reas
in
g
geo
metric gra
di
ent se
ri
es and present worth P
g
.
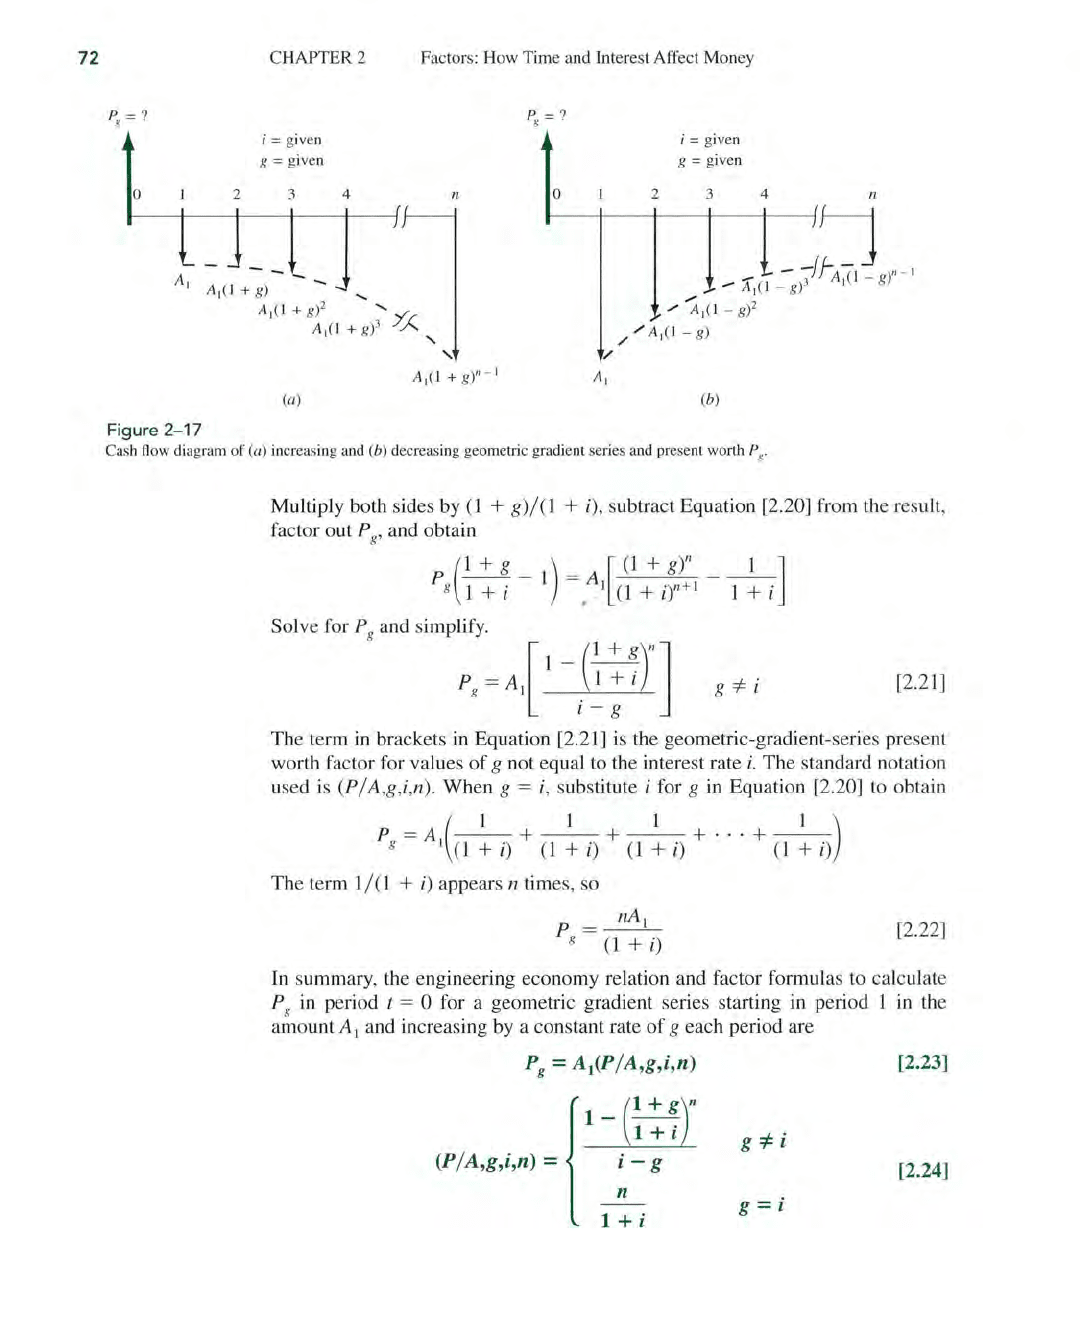
Multiply both sides by
(1
+
g)/(1
+
i)
, subtract Equation [2.20] from
th
e result,
factor out P
g
,
and obtain
P
--
- 1 - A
---
(
1
+ g ) [
(1
+ gY
1]
g 1 + i - . I
(1
+ i)n+ I 1 + i
Solve for P
g
a
nd
simplify. [ 1 + g)
ll
]
P
g
=
AI
1 -
.1+i
l
-g
g
*-
i
[2.
21
]
The term
in
brackets in Equation [2.21] is the geometric-gradient-series present
worth factor for values
of
g not equal to
th
e interest rate
i.
The standard notation
us
ed is (P / A,g,i,n). When g = i, substitute i for g in Equation
[2.
2
0]
to obtain
P
=A(
_ 1_ + _ 1
_+_
1_ +
..
.
+_
1_ )
g
1(1+i
)
(l
+
i)
(l
+ i)
(l+
i)
The term 1/
(1
+ i) appears n time
s,
so
nA I
P =
--
g
(1
+ i)
[2.22]
In summary,
th
e engineering economy relation and factor formulas to calculate
P
g
in
period t = 0 for a geometric gradient series starting in period 1 in
th
e
amount A I and increasing by a constant rate
of
g each period are
P
g
= A
1
(P/
A,g,i,n)
1 _
(1
+ g
11
1 + i
(P/
A,g,i,n)
= i - g
n
1 + i
[2.23]
[2.24]
g = i
SECTION 2.6 Geometric Gradient Series Factors
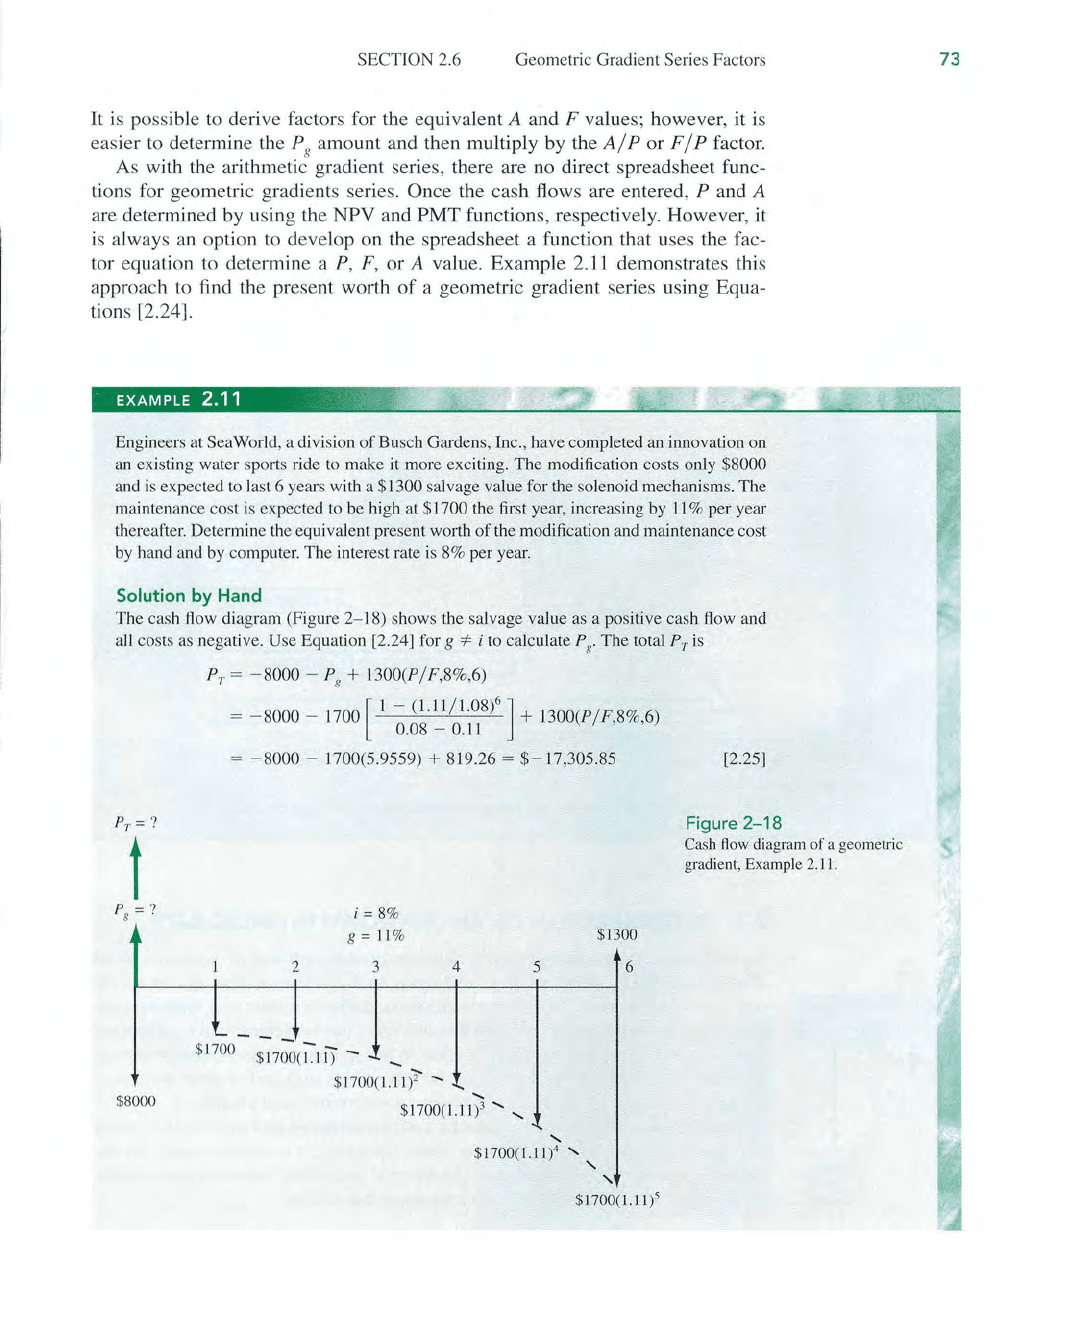
It is possible
to
derive factors for the equivalent A and F values; however, it
is
easier
to
determine the P
g
amount and then multiply
by
the
AlP
or F I P factor.
As
with the arithmetic gradient series, there are no direct spreadsheet func-
tions for geometric gradients series.
Once the cash flows are entered, P and A
are determined
by
using the NPV and PMT functions, respectively. However, it
is always an option
to
develop on the spreadsheet a function that uses the fac-
tor equation
to
determine a
P,
F, or A value. Example
2.11
demonstrates this
approach
to
find the present worth
of
a geometric gradient series using Equa-
tions [2.24].
EXAM
PLE
2.11
:~;
Engineers at Sea World, a division
of
Busch Gardens, Inc., have completed an innovation on
an
existing water sports ride to make
it
more exciting. The modification costs only $8000
and is expected to last 6 years with a $1300 salvage value for the solenoid mechanisms. The
maintenance cost
is
expected
to
be high at $1700 the first year, increasing
by
II
% per year
thereafter. Determine the equivalent present worth
of
the modification and maintenance cost
by
hand and
by
computer. The interest rate is 8% per year.
Solution
by
Hand
The cash flow diagram (Figure 2- 18) shows the salvage value
as
a positive cash flow and
all costs
as
negative. Use Equation [2.24] for g
*-
i to calculate P
g
.
The total PI' is
?T=
?
t
p
=?
g .
$8000
PI'
= - 8000 - P
g
+
1300(P/F,8%,6)
= - 8000 - 1700 [ 1 - (1.1
1/1.08)6]
+
1300(P/F
8% 6)
0.08 -
0.11
. "
= - 8000 - 1700(5.9559) + 819.26 =
$-17,305.85
2
i=8%
g = 11%
3
4
l
__
$1700 $17;;;(
1:"1
i)
-
$l700(1.l1l
......
.....
$1700(1.11)3
..........
5
"-
$1300
6
$1700(1.l1)4 "-
,
,
$1700(1.11)5
[2.25]
Figure
2-18
Cash flow diagram
of
a geometric
gradient, Example 2.11.
73
74
m
E·Solve
CHAPTER 2 Factors: How Time and Interest Affect Money
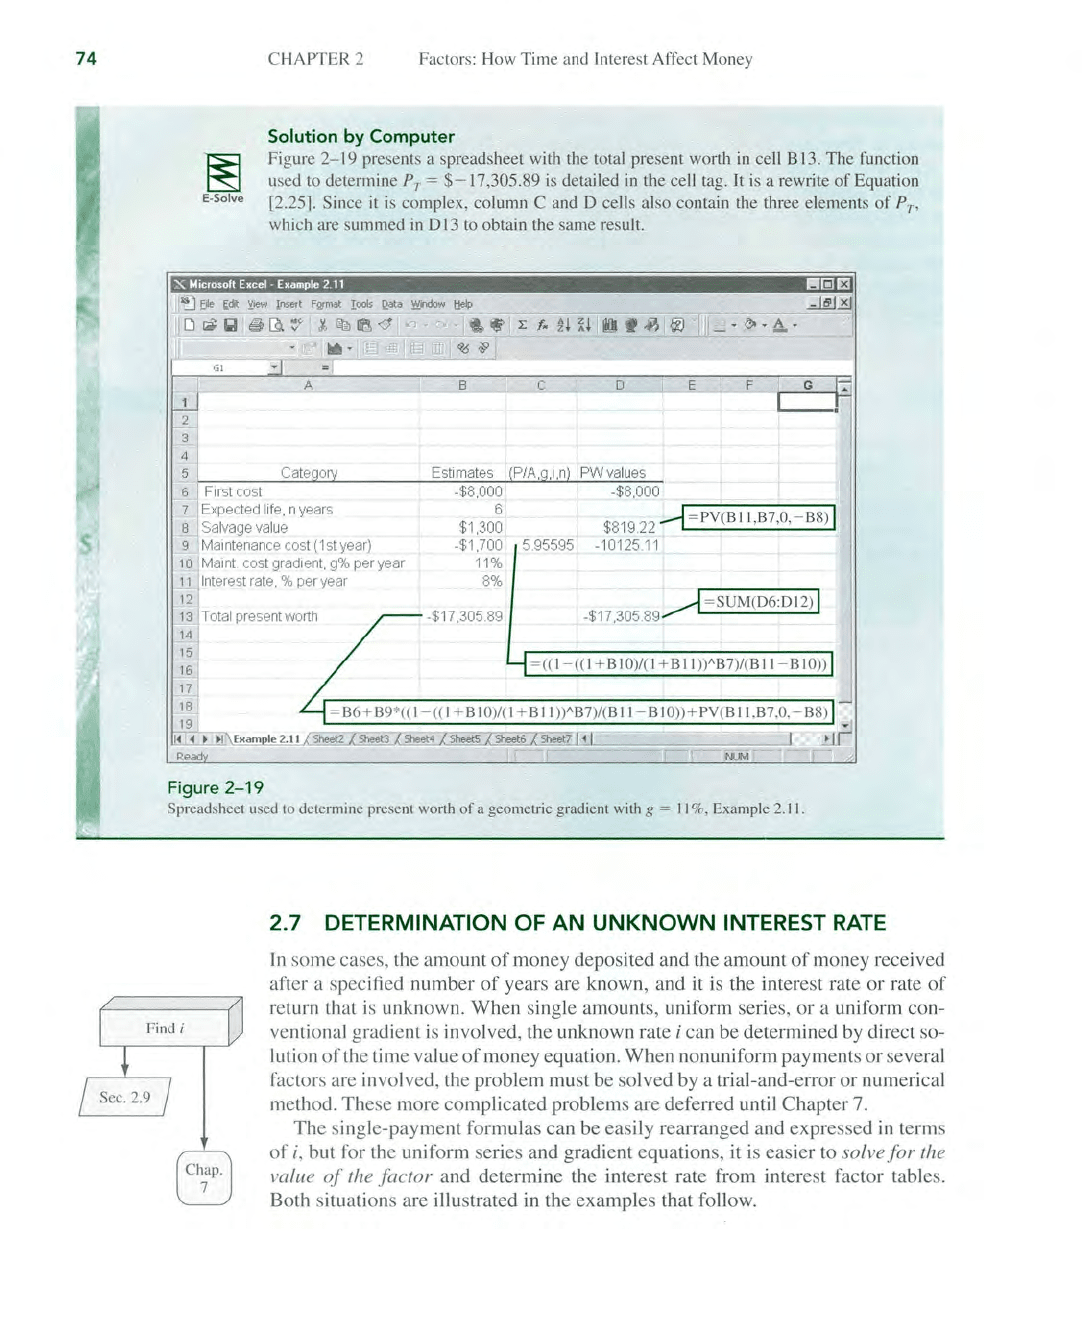
Solution by
Computer
Figure
2-19
presents a spreadsheet with the total present worth
in
cell B
13.
The function
used to determine
P
T
=
$-17,305.89
is
detailed
in
the cell tag.
It
is
a rewrite
of
Equation
[2.25].
Since
it
is
complex, column C and 0 cells also contain the three elements
of
P
T
,
which are summed
in
013
to obtain the same result.
X M,cro.oft
Excel·
Example
211
I!lIiII3
Cate 0
Estimates
PWv
a
lue
s
First cost
·$8,000
Ex
pected life. n years
8 Salvage
va
lu
e
·$8,000
6
$1,300
.$1 ,700
$819.22
--l
=PV(BI
I,B7,0
,-
B8) I
5.95595 ·10125.
11
9 Mai ntenan
ce
cost
(1
st year)
Maint cost
gradie
nt
, g% per year
In
terest
ra
te, % per year
11%
8%
12
13
Total prese
nt
wo
rth
14
.$
17,305.89
~
=
SUM(D6:DI2)
1
.$
17,305.89
15
~
= (( 1
-((
1 + B 10)/(1 + B
II))"B7)/
(B
11
- B 10))
181
= B6+ B9*(( 1
-((
1+ B
10
)l(
1+ B
11
))"B7)/(B
11
- B 10))+
PV(BII
,B7,0
,-
B8)
19
l.i
••
I\
E"ample2.ll
~
'
I
Read'
NUM
Figure
2-19
Spreadsheet used to determine present wOlth
of
a geometric gradient with g =
II
%, Example 2.
11
.
2.7 DETERMINATION OF
AN
UNKNOWN
INTEREST
RATE
In some cases, the amount
of
money deposited and the amount
of
money received
after a specified number
of
years are known, and it is the interest rate
or
rate
of
return that
is
unknown. When single amounts, uniform series,
or
a uniform con-
ventional gradient is involved, the unknown rate
i can be determined by direct so-
lution
of
the time value
of
money equation. When nonuniform payments
or
several
factors are involved, the problem must be solved by a trial-and-error
or
numerical
method.
These
more complicated problems
are
deferred until Chapter 7.
The single-payment formulas can be easily rearranged and expressed
in
terms
of
i,
but for the uniform series and gradient equations, it is easier to solve
for
the
value
of
the factor and determine the interest rate from interest factor tables.
Both situations are illustrated in the examples that follow.