Bergaya F. Handbook of Clay Science
Подождите немного. Документ загружается.

12.5.2. SAS BY CLAY MINERALS
There are two sets of publications dealing with the characterization of clay dis-
persions us ing SAS techniques.
The first set focuses on the hydration mechanisms by which a powder of smectite is
transformed into a concentrated gel or a paste. The SAS investigations consist of
observing the shift in diffraction peaks that occurs during clay mineral hydration, i.e.,
monitoring the profile change of the (001) reflections from the dry state (corresponding
to dE1 nm) to the gel state. During this process, the interlayer distances can increase to
several tens or even several hundreds of nanometers. This evolution was followed as a
function of various parameters such as clay concentration, nature of interlayer cation,
ionic strength, external pressure or temperature. As already mentioned, most inves-
tigations are concerned with natural di- and tri-octahedral smectites and vermiculites.
The second set relates to the relatively recent development of powerful SAS de-
vices, such as ultra SAS of neutrons and X-rays. These investigations focus on the
sol–gel transition mechanisms, the relationship between gel structure and rheological
behaviour and thermodynamic models of the swelling clay dispersions. In order to
minimize experimental difficulties associated with earlier studies, most of the second-
generation researchers used Laponite (synthetic hectorite) as the clay mineral. The
small diameter of Laponite platelets, in comparison with natural smectites, allows
interparticle interactions to be simplified. Laponite particles also have a narrow par-
ticle size distribution, and hence a ‘mean’ size may be used. The diameter of Laponite
platelets is much smaller than the size that is accessible to SAS techniques. In case of
Montmorillonite, even ultra SAS of X-rays or neutrons cannot include the whole
range of Montmorillonite particle diameters. Unlike montmorillonite, the structure
and behaviour of Laponite dispersions can be thoroughly studied. The light scattering
scale could be suitable, even if it is generally available for highly dilute dispersions.
A. Initial Hydration Stages and Osmotic Transition
SAS Analysis by Fourier Transform of Intensity
Rausell-Colom and Norrish (1962) and Norrish and Rausell-Colom (1963) have used
SAXS to investigate the swelling in salt-water solutions of orientated flakes of Na
+
-
montmorillonite (Wyoming) and single crystals of Li
+
-vermiculite (Kenya). The in-
crease in interlayer spacing was studied as a function of the ionic strength. The
scattering intensity was recorded along the direction perpendicular to the flake (or
single crystal) plane using a low-angle diffractometer and within an angular range
that allows interlayer distances to be measured just after the transition to ‘osmotic’
swelling, that is, from 3 to 50 nm. The scattered intensity can be expressed by Eq. (10),
in which the q vector is replaced by its component q
z
perpendicular to the flakes.
Iðq
z
Þ/F
2
ðq
z
ÞGðq
z
Þð12Þ
Chapter 12.5: Small-Angle Scattering Techniques886

The one-dimensional Fourier transform of G(q
z
) is given by:
WðrÞ1 ¼
d
m
p
Z
1
0
Gðq
z
Þcosðrq
z
Þ dq
z
ð13Þ
In this case, W(r) is the one-dimensional distance distribution. The most probable
basal distance d corresponds to the maximum of W(r). Because the structure of
these clay mineral-water systems is heterogeneous and disordered, W(r) gave poor
information. Nevertheless, the following conclusions can be made. Interlayer
(‘crystalline’) swelling occurs by a process that is highly dependent on the hydration
energy of the interlayer cations. With some monovalent interlayer cations such as
Na
+
and Li
+
, the interlayer distance ‘jumps’ at a high water content. Gel formation
can be explained in terms of repulsive osmotic forces resulting from the entry of
water into the interlayer space and the development of ionic double layers. After
passing the osmotic transition threshold, the increase in interlayer distance is
proportional to the water content, as is the case for swelling in pure water. In
salt solutions, the interlayer distance increases linearly with C
1/2
, where C is the
electrolyte concentration.
Andrews et al. (1967) carried out the same analysis with a SAS device that can
extend to smaller scattering angles, i.e., much larger parti cle size than in the above
experiment (about 100 nm). In agreement with Rausell-Colom and Norrish (1962)
and Norrish and Rausell-Colom (1963), they point out the inaccuracy of using a
direct Fourier transform for such samples.
Geometrical Simulation of SAS
The description of the gel structure can be improved by simulation of the scattering
curves. Experiments performed wi th standard laboratory SAS are not easy to model,
because a punctual collimation of X-ray sources is impossible to realize while main-
taining the intensity of scattering. It is then necessary to correct the experimental
data by using a heavy desmearing method or to introduce a complex optical transfer
function in the spectra simulation. This problem was overcome by using radiation
supplied by a synchrotron, allowing pinpoint collimat ion with a high intensity to be
achieved.
Pons et al. (1981, 1982a) performed small-angle X-ray experiments with a syn-
chrotron beam of the Laboratoire d’Utilisation du Rayonnement Synchrotron
(LURE, Orsay, France). They studied the swelling of Wyoming Na
+
-montmorillo-
nite and Li
+
-saponite in pure water, starting from a gel containing 17%, (w/w) clay.
The scattering evolution was observed in the course of alternate freezing at 70 1C
followed by slow warming up to room temperature. The time-resolved diffraction
patterns were recorded during temperature increase. The theoretical spectra were
simulated using the methods previous ly e laborated for the simulation of 00l reflec-
tions from disordered or interstratified layer stacking systems (see Section 12.5.1).
The simulation model of the dispersion consists of particles (layer stackings) that are
12.5.2. SAS by Clay Minerals 887

disoriented from each other. The intensity is given by:
IðqÞ¼
F
2
00
ðqÞ
Oq
2
X
M
aðMÞGðq; M; p
i
; d
i
Þð14Þ
where O is the unit cell area, F
00
(q) the structure factor of the unit layer along the 00l
direction, q the vector modulus, M, the number of layers in a particle, a(M), the
weight distribution of particles containing M layers, and G(q, M, p
i
, d
i
) is the inter-
ference function (or modulation function) that depends on M and on the interlayer
distance, d
i
with their respective probabilities, p
i
.
The spectra confirmed the increa se of basal spacing from 2 to more than 3 nm at
the osmotic transition threshold, and the reversibility of this transition. But the
primary aim of the study was to compare the scattering evolution between 0 1C and
room temperature (Fig. 12.5.2).
The peak position was the same at both temperatures, but the narrow peak at 0 1C
transformed into a diffuse modulation at room temperature, indicating that swelling
Fig. 12.5.2. Time-resolved experiments showing the evolution of experimental SAXS inten-
sity I(s) vs. basal distance d or S ¼ 1=d, of a gel after freezing at –70 1C and then slowly heated
to room temperature. From Pons (1980) and Calas et al. (1984).
Chapter 12.5: Small-Angle Scattering Techniques888

was not impeded at 0 1C. At this temperature, the system was constrained by the
presence of residual ice in equilibrium with water. At room temperature, a large
disorder in layer stacking took place but with the same most probable basal distance.
This would indicate that the energy spent in establishing a swelling equilibrium
contains an entropy term inducing a dispersion of unit layers and the form ation of
smaller particles (stacked layers) that are disoriented from each other.
Comparison of experimental and theoretical scattering curves showed that the
Na
+
-montmorillonite gel at 17% (w/w) formed at room temperature, consists of
particles containing between 1 and 8 parallel layers with interlayer distances of
4–20 nm, giving an average value of 10 nm. The particles themselves are completely
disoriented from each other. The proposed structural model was checked by high
resolution transmission electron microscopy (Pons et al., 1982b). Because of the high
clay concentration, other explanations may be proposed such as the formation of
nematic structures (see below).
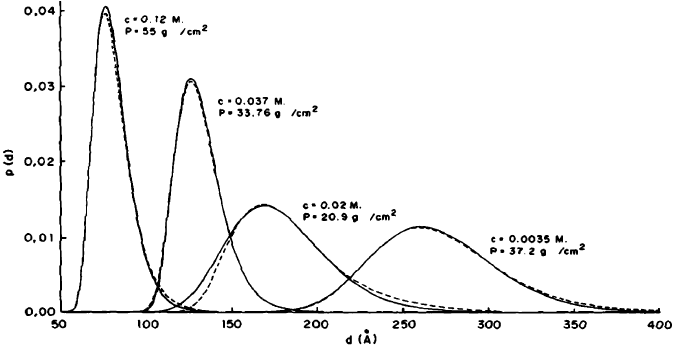
The same simulation and fitting method was used by Rausell-Colom et al. (1989)
to analyse the swelling of single crystals of Santa Olalla vermiculite in aqueous
solutions of
L-ornithine hydrochloride. They compared the basal spacing distribu-
tions obtained from SAS wi th those derived from the DLVO theory, taking into
account a Boltzmann distance distribution and a layer of water molecule on the clay
mineral surface (Cebula et al., 1980). Fig. 12.5.3 illustrates the fit between the two
types of plots for different ionic concentrations of the swelling solution.
Following Callaghan and Ottewill (1974), Ben Rhaiem et al. (1987) studied the
hydration–dehydration behaviour of Na
+
- and Ca
2+
-montmorillonite in 10
3
M
Fig. 12.5.3. Vermiculite wafer swelling. Comparison of basal spacing distributions computed
from diffuse double-layer interaction (broken line) and inferred from XRD data (continuous
line). c, ionic concentration of solvent; p, pressure applied on the wafer to balance the swelling
pressure. From Rausell-Colom et al. (1989).
12.5.2. SAS by Clay Minerals 889
NaCl and CaCl
2
by synchrotron SAS. The samples wer e examined during drying and
rewetting in an ultrafiltration cell by varying the suction. Their results again confirm
an osmotic transition and its reversibility for Na
+
-montmorillonite but not for
Ca
2+
-montmorillonite. They further show that the gel, at least at high clay contents,
is formed by stackings of expanded layers as in nematic domains with variable
interlayer distances that are disoriented from each other. These gel domains alternate
with pores whose hierarchical size distribution can be determined by comparing SAS
spectra and permeability results of pressure experiments.
Keren and Klein (1995) used SALS to determine the clay concentration in aque-
ous dispersions of bi-ionic Na
+
/Ca
2+
-montmorillonite. The samples were carefully
prepared by selecting particle size and stirring the two homoionic clay mineral dis-
persions for long periods. From experiments with various Na
+
/Ca
2+
ratios and a
0.1% clay concentration, they concluded that the SALS technique is not appropriate
for such systems because of the broad particle-size heterogeneity. A theory for mix-
tures is required to take into account the scattering of particles with different sizes
(cf. the light scattering theories in Table 12.5.1).
Indeed, it is always perilo us to analyse heterogeneous media without any pos-
sibility to perform contrast matching in SAS experiment. As described below, there
are techniques that can be used for particular cases.
B. Anomalous Small Angle X-ray Scattering
Anomalous small-angle X-ray scattering (ASAXS) refers to an extension of standard
SAXS experiments in which the energy of the probing X-rays are tun ed near the K, L
or M absorption edges of an element in the sample. By performing SAXS exper-
iments near one of the characteristic absorption edges of any given atom, it is
possible to vary the scattering contrast of that atom. This systematic variation in
contrast yields the partial scattering functions of the specific atomic species. In
general, the atomic scattering can be expressed as
f ðq; EÞ¼f
0
ðqÞþf
0
ðq; EÞþif
00
ðq; EÞð15Þ
where E is the energy of the probing X-rays and f
0
and f
00
the real and imaginary parts
of anomalous scattering. The variation of f
0
is responsible for the change in contrast
seen in the ASAXS signals.
Near the absorption edge the scattering intensity is given by
Iðq; lÞ¼I
n
ðqÞþf
0
ðlÞI
c
ðq; lÞþðf
0
2
ðlÞþf
00
ðlÞÞI
r
ðqÞð16Þ
Here I
n
(q) is the normal non-resonant scattering, I
c
is a cross term reflecting scat-
tering between the specific element of interest and the remainder of material and I
r
corresponds to the distance correlations of the resonant scattering centres.
Chapter 12.5: Small-Angle Scattering Techniques890
This matching method is easily accessible to elements having Z values between 20
and 36 for K edges, and between 50 and 82 for L edges. Since f
0
and f
00
are sharply
varying functions near the edge, these experiments require the highest possible en-
ergy resolution (Dl /lE 10
4
). To resolve Eq. (16) it is necessary to perform several
measurements with different wavelengths far and near the edge. Such a technique
can reveal the distribution of specific species within a multicomponent matrix.
Carrado et al. (1998) exploited ASAXS to monitor the solvation behaviour of
transition metal and lanthanide ions within the interlayer space of montmorillonite.
The experiments were performed a t the Stanford Synchrotron Radiation Laboratory
(SSRL, USA). The variations of scattering intensities, as a function of the absorption
energy were monitored for Cu
2+
-, Er
3+
- and Yb
3+
- montmorillonites as a functi on
of hydration.
C. Gel Structure and Sol– Gel Transition
The second series of investigations, using an ultra-small-angle X-ray scattering
(USAXS), neutrons and light scattering were devoted to study the structure of clay
gels and the sol–gel transition.
Gel Structure in Natural Smectite Dispersions
Cebula et al. (1980) performed SANS experiments at the Institute Laue-Langevin
(ILL) in Grenoble, France on aqueous dispersions, comparing the effect of ex-
changeble Li
+
,K
+
and Cs
+
cations on the structure of dilute montmorillonite sols
(0.8%, w/w).
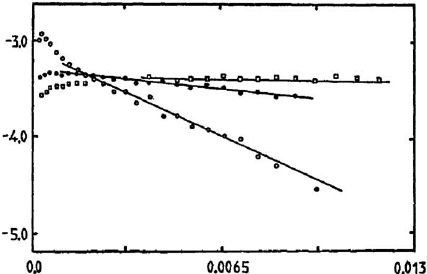
Fig. 12.5.4 illustrates the Guinier plots: ln (q
2
I) vs. q
2
. The particle thickness may
be derived from the slope of the linear part of each curve, using Eq. (8a). The
extrapolation of these straight lines to q ¼ 0 gives (Iq
2
)
0
. This last value was used to
control the exchange H
2
O - D
2
O. By changing the relative proportions between
H
2
O and D
2
O, it was possible to reach the condition ðIq
2
Þ
0
¼ 0 when the contrast
disappears. Matching allows even a very low exchange between D
2
O and H
2
O layers
at the clay mineral surface to be detected, and compared with the free H
2
O molecules
of the bulk solvent. Matching enhances the scattering contribution of these water
layers and allows their thickness (of about two water layers) to be evaluated. The
measurement of particle thickness, using the plots of Fig. 12.5.4, showed that Li
+
-
montmorillonite was completely de laminated with a layer thickness of ca. 1.10 nm
including the water layers. In K
+
-montmorillonite the average particle thickness was
ca. 2.6 nm, corresponding to two parallel clay miner al layers. In Cs
+
-montmorillo-
nite aggregation was more pronounced with a broad distribution of particles around
a thickness of about 4.2 nm corresponding to three associated layers with their hy-
dration layers. Matching of the particle–solvent scattering length contrast was ob-
tained with a solvent containing 65% D
2
O. This experimental defined amount of
D
2
O cannot be obtained theoretically by only considering the scattering length of the
clay mineral and of the solvent. This experimental value also depends on the very low
12.5.2. SAS by Clay Minerals 891

exchange rate between hydrogen and deuterium in water within the interlayer space,
even if this water is very mobile (self-diffusion coefficient E10
–10
m
2
/s).
Pinnavaia et al. (1984) used SANS (ILL, Grenoble) to study particle aggregation
and particle–pore distribution of Spur homoionic montmorillonites (in the Li
+
,Na
+
,
K
+
or Cs
+
forms). For 1% (w/w) dispersions, Li
+
-montmorillonite obeyed
Guinier’s law, while Cs
+
-montmorillonite followed Porod’s law (I(q)pq
4
), indi-
cating particle aggregation in the presence of Cs
+
ions. Na
+
-montmorillonite disper-
sions showed some aggregation of clay minerals layers, while K
+
-montmorillonite
gave a pattern similar to Cs
+
-montmorillonite. The dynamics of water and other
intercalated molecules were also investigated by quasi-elastic neutron scattering.
Comparing Montmorillonite with Laponite
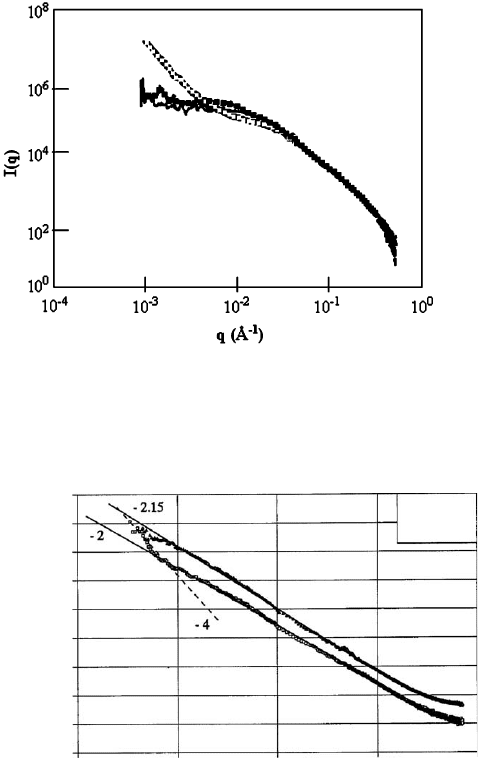
Morvan et al. (1994) performed USAXS and SAXS experiments (CEA, Saclay,
France) on Laponite in pure water and in salt solutions. Fig. 12.5.5 shows the
log–log plots of scattering curves at 1.8, 3.5 and 10% (w/w).
The 1.8 and 3.5% (w/w) samples give curves that are typical for ideally dispersed
disk-like particles. Their profile was simulated using the i(q) intensity expression of
Eq. (7) for randomly oriented cylinders of axial length 2H an d cross-sectional radius
R, and Eq. (3) taking into account the scattering length contrast. A plateau is
observed for the Guinier plot domain. Thus, the Laponite layers scatter independ-
ently without any interactions. For the 10% (w/w) concentration, the increase in
intensity at small q values has an exponent a ¼3 :1 indicative of a heterogeneous
medium.
Fig. 12.5.6 shows USAXS curves for a 4% (w/w) montmorillonite dispersions in
0.1 M NaCl. (Faisandier-Cauchois et al., 1995; Faisandier et al., 1998 ). Both plots
q
2
(Å
-2
)
ln (q
2
I)
Fig. 12.5.4. Guinier plots obtained from SANS experiments for aqueous dispersions of Li
+
-
montmorillonite (&). K
+
-montmorillonite (K) and Cs
+
-montmorillonite (
J
). Clay mineral
concentration was 0.8% (w/w). From Cebula et al. (1980).
Chapter 12.5: Small-Angle Scattering Techniques892

are typical of well-dispersed montmorillonites obeying scaling laws over the whole
q-range. Such behaviour is also typical of scattering by non-interfering very large
membranes with a diameter D ¼ p/q
m
E1 mm (where q
m
is the lowest experimental
q value), and a thickness of ca. 1 nm. This diameter is clearly larger than the usual
Fig. 12.5.5. Experimental USAXS intensity I(q) vs. the modulus of scattering vector q of
aqueous Laponite dispersions, presented as a log–log plot. The corresponding clay concen-
trations were (’’’) 1.8% (w/w); (—) 3.5% (w/w) and (&&&) 10% (w/w). From Morvan
et al. (1994).
q(Å
-1
)
I(q)
1E-04 1E-03 1E-02 1E-01 1E-00
1E+10
1E+09
1E+08
1E+07
1E+06
1E+05
1E+04
1E+03
1E+02
1E+01
Fig. 12.5.6. Experimental USAXS intensity I(q) vs. the modulus of scattering vector q of
aqueous montmorillonite dispersions in 0.1 M NaCl, presented as a log–log plot. Clay mineral
concentration is 4% (w/w). From Faisandier-Cauchois et al. (1995). The slope values (2.15,
2, 4) represent scale laws characteristic of the different structures.
12.5.2. SAS by Clay Minerals 893
diameter of one montmorillon ite unit layer. For the sample prepared at room tem-
perature the exponent 2.15 indicates that some layers are parallel. For the sample
under pressure (in sealed ampoules at 200 1C), the slope is 2 as expected for ideally
dispersed layers. These results show that at this clay concentration and ionic
strength, the unit layers form large bands by edge-to-edge contacts, as mentioned by
Low (1991).
Ramsay et al. (1990) compared neutron diffraction and SANS (PLUTO Harwell,
UK) data for Laponite RD and Wyoming montmorillonite in D
2
O. The structural
changes investigated concerned samples in which the clay platelets were initially
aligned in the dry state. The authors followed the development of orientational
disorder and eventually a randomly oriented isotropic structure, over a wide range of
D
2
O concentration (D
2
O/clay ratio. x ¼ 0:2 to 31 (w/w)).
The Por od’s part of the SAS curves followed a Q
a
law with same exponent for
both clays. As the heavy water concentration increased, the exponent varied from 4
in the compacted system to 2 for the highly dilute dispersions.
Because of the small size of Laponite particles (in comparison with montmo-
rillonite), the SAS in the lowest q-range allows particle diameters (25–30 nm) to be
determined, using Eqs. (8a) and (8b).
SANS Studies under Shear
Using SANS (ILL, Grenoble), Ramsay and Lindner (1993) compared the in situ
scattering of Laponite and montmorillonite dispersions under static conditions and
during shearing in a Couette-type cell. The patterns were recorded with a 2D
detector. The range of clay contents was chosen within 0.5–6.5% (w/w) where
time-dependent gelation and thixotropic behaviour occur. Spatial and orientation
correlations between the particles developed in dispersions of low ionic strength
(o10
3
mol/L). Such self-organized structures are limited to domains of restricted
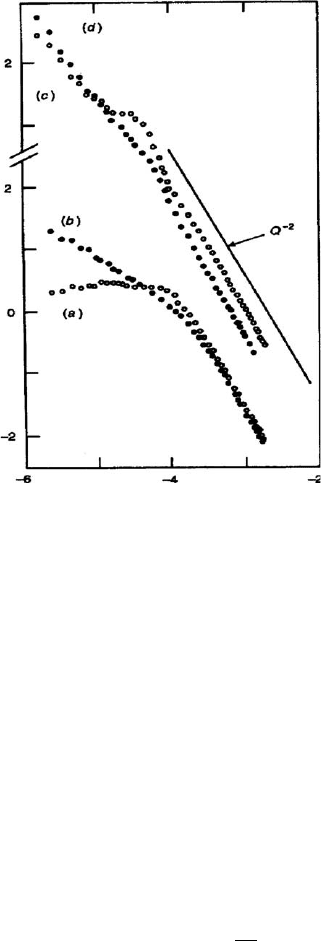
size, as indicated by the anisotropic scattering behaviour, and are influenced by the
clay mineral concentration, particle size and particle shape (Fig. 12.5.7).
Orientational correlations were more extensive for the relatively large montmo-
rillonite particles. Some preferential alignment was observed at distances b10
2
nm
under equilibrium conditions. The effect of shear on structures was indicated by the
anisotropic SANS patterns. At low rates of shear, montmorillonite dispersions showed
preferential alignment of particles in the direction of flow, but spatial correlations also
persisted. At high shear rates (ca. 10
4
s
1
) the three-dimensional structure broke down
and only the preferential alignment was observed. The time-resolved SANS studies of
montmorillonite dispersions showed a high degree of thixotropy.
Similarly, Hanley et al. (1994) carried out a SANS study of a 1% (w/w) dispersion
of Na
+
-montmorillonite using the instrument at CNR (Cold Neutron Research)
facility of the National Institute of Science and Technology (NIST), USA. The
spectra were recorded on a two-dimensional detector. At equilibrium, the plot of log
I vs. log q showed the classical scaling law with a slope of 2.2 indicating a
high degree of dispersion with scarcely detectable an isotropy. The behaviour of the
Chapter 12.5: Small-Angle Scattering Techniques894

dispersion under shear was as expected for disk-shaped particles. The disks aligned
under shear with the normal parallel to the velocity gradient.
Small-angle Light Scattering and Dynamic Light Scattering
Avery and Ramsay (1986) investigated a Na
+
-Laponite dispersion (p10 g/L) at low
ionic strength ([Na]E10
–3
mol/L) by static SALS, dynamic light scattering (DLS)
and SANS (PLUTO, AERE, Harwell, UK). This will be discussed below.
SALS. The data were evaluated using the scattering equation based on the Ray-
leigh–Debye theory: because of the difficulty in measuring absolute intensities, the
Rayleigh ratio, R
q
, is generally used with R
q
¼ I
q
=I
0
, where I
0
and I
q
are the in-
tensity of the incident and scattered beam, respectively.
K
c
R
q
¼ M
W
hi
PðqÞ
1
þ 2Bc ð17Þ
Here c is the particle number density, qð¼ 4p sin y=
~
nlÞ the scattering vector, and
P(q) the particle scattering factor. Taking into account the size of the particle in
Ln q(Å
-1
)
Ln I(q)
Fig. 12.5.7. SANS curves for aqueous Laponite dispersions: (a) static, (b) sheared. For
montmorillonite dispersions: (c) static, (d) sheared. Clay mineral concentration, 0.05 g/cm
3
;
shear rate, g ¼ 1.2 10
4
s
–1
. Data are radially averaged. From Ramsay and Lindner (1993).
12.5.2. SAS by Clay Minerals 895
