ASM Metals HandBook Vol. 8 - Mechanical Testing and Evaluation
Подождите немного. Документ загружается.

Fatigue Testing of Brittle Solids
J.A. Salem, Glenn Research Center at Lewis Field; M.G. Jenkins, University of Washington
Strength-Based Test Methods
Strength-based methods or “indirect” methods employ smooth test specimens, such as flexural beams or tensile
specimens, and estimate fatigue properties from strengths measured over different time intervals. Strength-
based methods directly sample the flaw distribution within or on the surface of the test specimens. The cracks
thus develop from at least some of the same sources as in a component of the same material. However, the
results are subject to the scatter inherent in the strength distribution of the material, and thus a relative large
number of tests are required. Further, strength-based methods do not measure the actual crack size but infer it
from the measured strength.
Three basic strength test methods and accompanying analytical relations have been developed for determining
the fatigue parameters and behavior of ceramics and glasses: static loading, dynamic loading, and cyclic
loading.
Static Loading. Typically, tensile specimens or flexure specimens (e.g., beams or plates) are subjected to a
constant load in the environment of interest. The time-to-failure and the applied stress are recorded and used to
determine the fatigue parameters according to any of the Eq 1, 2, 3, 4, and 5. The generalized slow crack
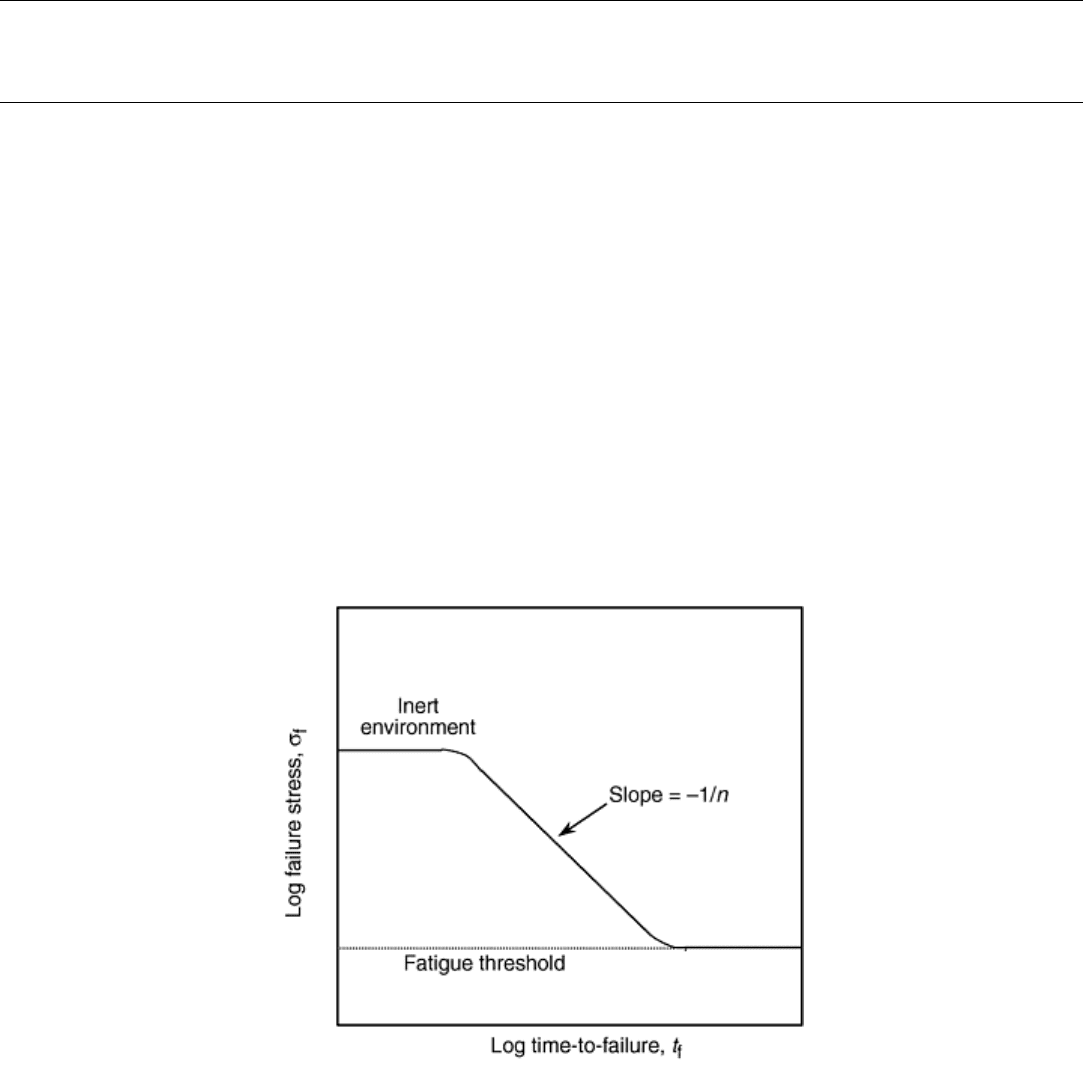
growth behavior for static loading is shown in Fig. 2.
Fig. 2 Generalized failure stress as a function of time-to-failure on a logarithmic scale for ceramics and
glasses exhibiting environmentally induced slow crack growth
One test method, Japanese Industrial Standard (JIS) 1632 “Test Methods for Static Bending Fatigue of Fine
Ceramics,” has been standardized for the determination of fatigue strength by static loading (Ref 18) at room or
elevated temperatures. The standard gives guidance on the test method but not in the calculation of fatigue
parameters such as A and n.
Uniaxial flexural test specimens are manufactured and tested in three- or four-point loading in accordance with
JIS R 1601, “Test Method for Flexural Strength (Modulus of Rupture) of Fine Ceramics” (Ref 56). The use of
at least three stress levels is recommended, and the breaking times at one of the stress levels must be distributed
between 0 and 100 h, minimum. No requirement on the number of test pieces is specified; however, three tests
per stress level are recommended. Tests may be stopped after 100 h if failure has not occurred. An initial
fatigue stress equal to 75% of the fracture strength is used. Subsequent stresses differing by 5 to 10% from the
initial fatigue load are applied, depending on the initial time-to-failure and scatter in the data. An example of
failure stress data as a function of the failure time is shown in Fig. 3 (Ref 18).
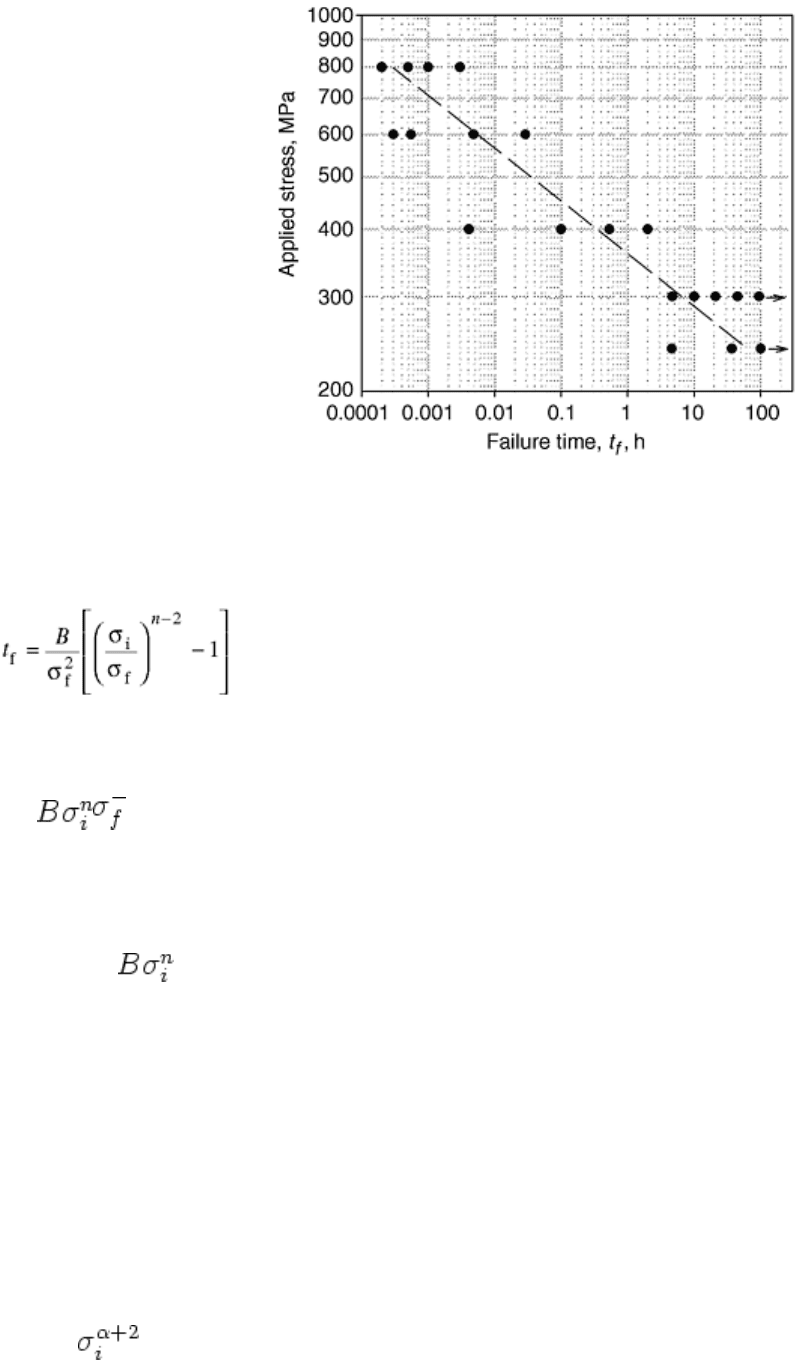
Fig. 3 Example of failure stress as a function of time-to-failure on a logarithmic scale for ceramics and
glasses exhibiting environmentally induced slow crack growth. Adapted from Ref 18
The stress at fracture or fatigue strength σ
f
, is related to the time-to-failure, t
f
, by (Ref 43, 57, and 58):
(Eq 7)
where B is a parameter associated with A, n, fracture toughness, crack geometry, and loading configuration, and
σ
i
is the “inert” strength or the strength under noncorrosive conditions for which no crack extension occurs. For
most ceramics and glass, n > 10 so that Eq 7 can generally be simplified to:
t
f
=
(Eq 8)
The fatigue parameter n can be determined from the slope of a log t
f
versus log σ
f
plot by writing Eq 8 as:
log t
f
= -n log σ
f
+ log D
(Eq 9)
where
log D = log( )
(Eq 10)
Once the slope and intercept of Eq 9 are estimated, the parameters n and D and the standard deviation SD
n
and
SD
D
can be estimated by a Taylor series expansion of the random variable of interest (Ref 59):
n = -α
(Eq 11)
SD
n
≈ SD
α
(Eq 12)
D = 10
β
(Eq 13)
SD
D
≈ (ln 10)(SD
β
)(10
β
)
(Eq 14)
where α is the slope and β is the intercept estimated by linear regression of Eq 9. For some design codes, the
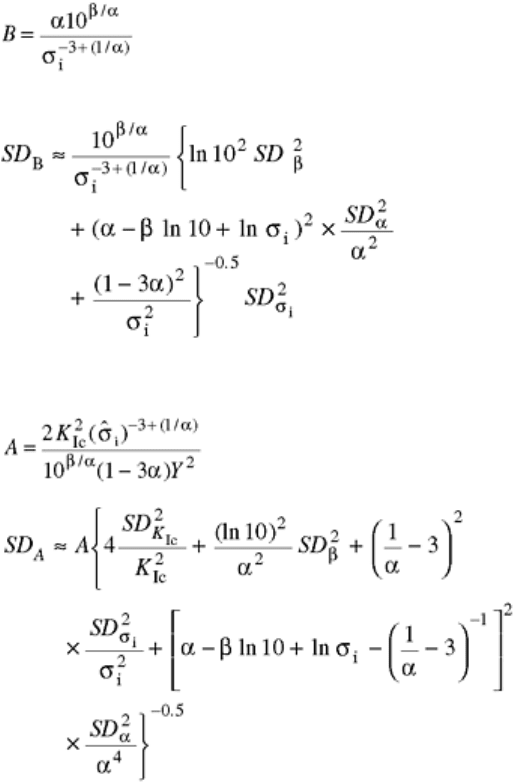
fatigue parameters B and A are necessary (Ref 60, 61, 62). The parameter B and the standard deviation can be
estimated from:
B = 10
β
(Eq 15)
(Eq 16)
The parameter A in Eq 2 can be calculated from:
(Eq 17a)
or
(Eq 17b)
with
(Eq 18)
where Y is the stress-intensity factor coefficient and treated as a constant.
Note that plots of static fatigue data (e.g., Fig. 3) are usually made with the applied stress appearing as the
dependent variable; however, the dependent variable actually is the time-to-failure, and it must be minimized in
the regression analysis.
Dynamic Loading. Typically, tensile or flexure test specimens (e.g., beams or plates) are subjected to a constant
stress rate in the environment of interest. The failure stress and the applied stress rate are recorded and used to
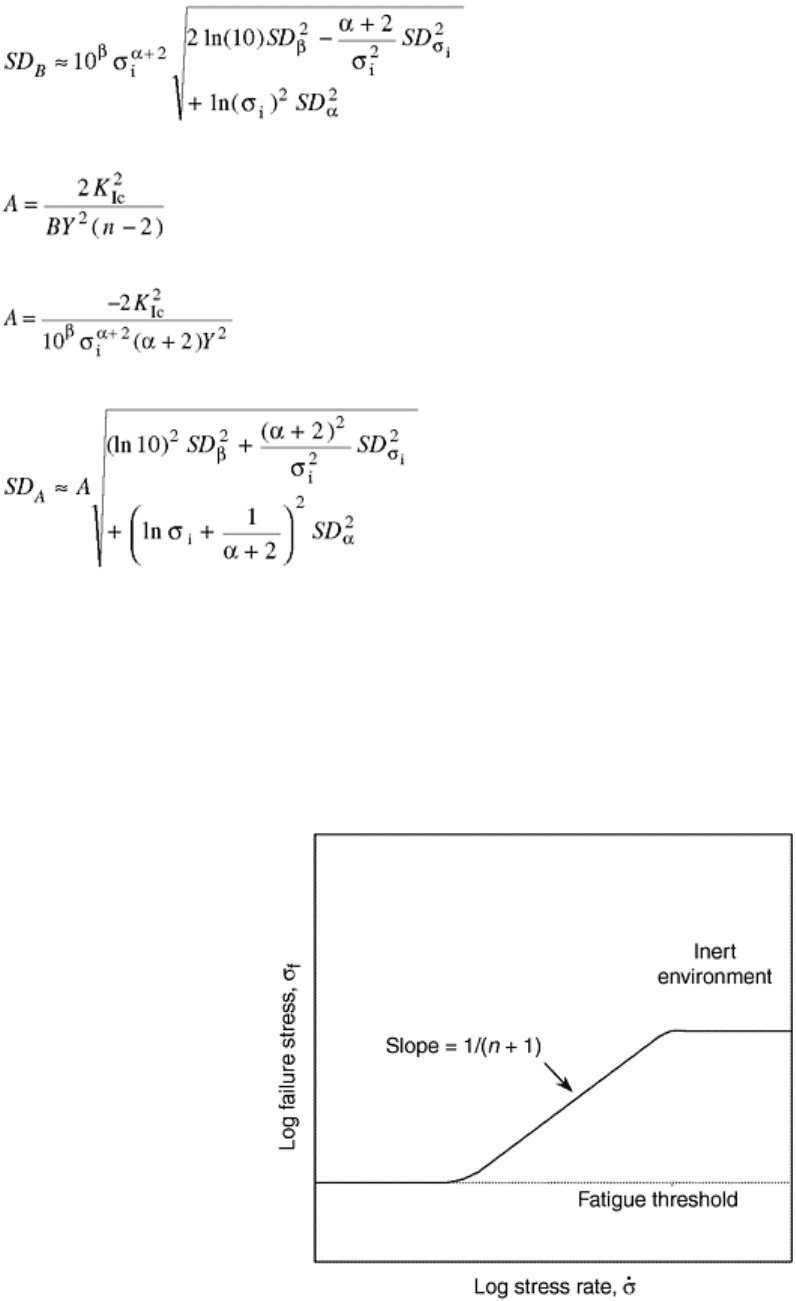
determine the fatigue parameters according to any of the Eq 1, 2, 3, 4, and 5. Figure 4 illustrates the observed
strength as a function of stress rate for dynamic loading. A detailed error analysis has been conducted for
dynamic loading (Ref 63).
Fig. 4 Generalized fracture strength as a function of stress rate on a logarithmic scale for ceramics and
glasses exhibiting environmentally induced slow crack growth
Two test methods have been standardized for the determination of fatigue strength by dynamic loading (Ref 15,
17). One standard (Ref 17), ASTM C 1368 “Standard Test Method for Determination of Slow Crack Growth
Parameters of Advanced Ceramics by Constant Stress-Rate Flexural Testing at Ambient Temperature” also
gives detailed guidance in the calculation of the fatigue parameter n, based on Eq 2. The standard uses uniaxial
flexural test specimens that are manufactured in accordance with ASTM C 1161 “Standard Test Method for
Flexural Strength of Advanced Ceramics at Ambient Temperature” (Ref 64) and tested in four-point flexure.
A total of 40 test specimen loaded at four stress rates that cover at least three orders of magnitude are required,
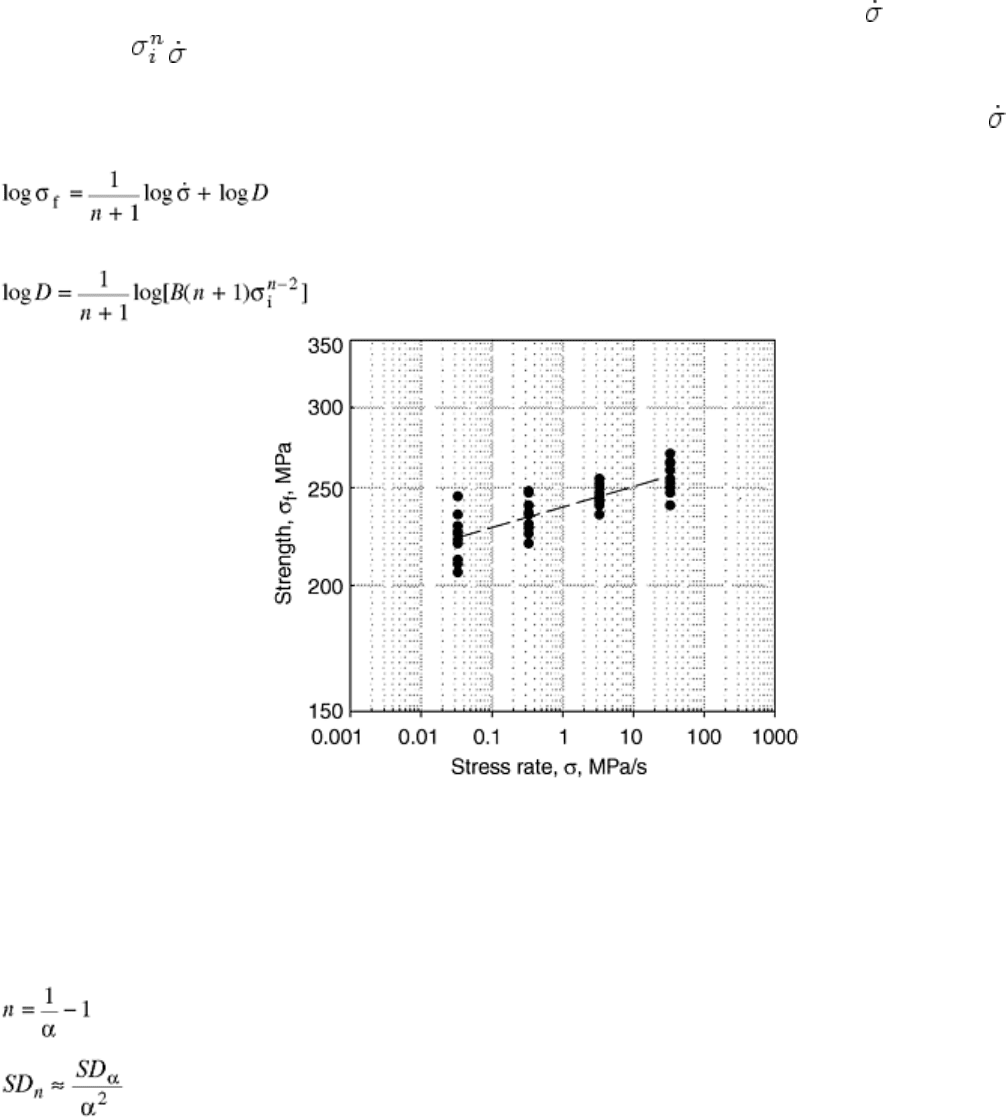
with a minimum of four tests at any of the rates. An example of failure stress data as a function of the stress rate
is shown in Fig. 5. The stress at fracture or fatigue strength, σ
f
, is related to the stress-rate, , by (Ref 57, 58):
σ
f
= [B(n + 1) ]
1/n+1
(Eq 19)
where B is a parameter associated with A, n, fracture toughness, crack geometry, and loading configuration, and
σ
i
is the inert strength. The fatigue parameter n can be determined from the slope of a log σ
f
versus log plot by
writing Eq 19 as:
(Eq 20)
where
(Eq 21)
Fig. 5 Example of failure stress as a function of stress rate on a logarithmic scale for ceramics and
glasses exhibiting environmentally induced slow crack growth. Adapted from Ref 17
The dependent variable is the fracture stress, and regression is performed to minimize fracture stress variation.
Once the slope and intercept of Eq 20 are estimated, the parameters n and D and the standard deviation SD
n
and
SD
D
are estimated from:
(Eq 22)
(Eq 23)
D = 10
β
(Eq 24)
SD
D
≈ (ln 10)(SD
β
)(10
β
)
(Eq 25)
where α and β are the slope and the intercept, respectively, estimated by linear regression of Eq 20. These
formulation follow a recently published standard (Ref 17) and provided values of n and D. For some design
codes, however, the parameters B and A are necessary (Ref 60, 61, and 62). The parameter B and the standard
deviation can be estimated from:
(Eq 26)
and
(Eq 27)
The parameter A corresponding to Eq 2 can be calculated from Eq 17aa or with the standard deviation of A
from:
(Eq 28)
(Eq 29)
In order to verify that the dynamic fatigue methodology is sufficiently robust for industrial use in the
development of design data, several round-robin test programs have been performed (Ref 65, 66, 67,and 68).
One round-robin involved dynamic fatigue testing of eight ceramic materials (Ref 65), with a given material
being tested by only one research institute and one manufacturer. A total of 30 specimens were tested in
distilled water at three to four stress rates ranging from 10
-2
to 10 MPa/s. In addition, the inert strength and
Weibull modulus were measured at 100 MPa/s. As Fig. 6 illustrates, good agreement occurred between the
research and industrial laboratories for materials with a low fatigue parameter, n, but poor agreement for
materials with a high fatigue parameter. It was believed that increasing the number of test specimens would
improve the results, as a single data point tended to have an unduly large effect on the slope for materials with
high n values.
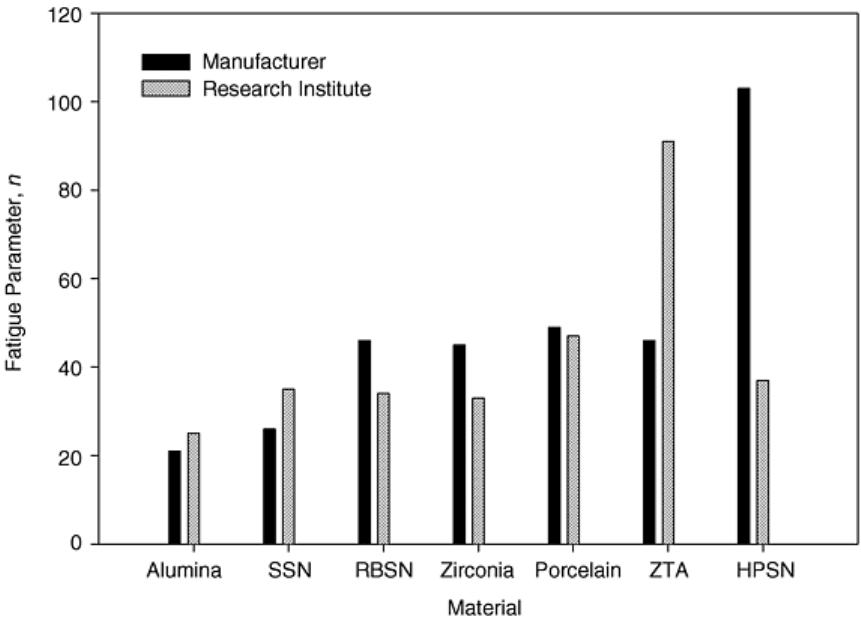
Fig. 6 Round-robin results comparing fatigue parameters of various ceramics determined by using
dynamic loading. SSN, sintered silicon nitride; RBSN, reaction-bonded silicon nitride; ZTA, zirconia-
toughened alumina; HPSN, hot pressed silicon nitride. Source: Ref 66
A second round-robin tested alumina flexure specimens in distilled water (Ref 66, 67). The participants were
instructed to test 15 specimens in the as-received condition and 15 specimens with a 5 kg indentation. Most
participants covered less than two orders of magnitude in the stress rate, and the combined participant data
covered nearly five orders of magnitude. Figure 7 summarizes the fatigue parameters generated by the
participants for the as-received condition. Generally, the results improve as the number of specimens increases
from 15 to 33. However, even 33 test specimens can be inadequate. Most troublesome is the fact that the fatigue
parameter has been overestimated two out of three times. If the data points that appear to be outliers are
removed, a slight improvement results, as shown in Fig. 8. Although the final recommendations from the
round-robin were not published, the initial recommendations were that at least three orders of magnitude be
covered. Also, for testing at rates greater than 100 MPa/s, a piezoelectric load cell was recommended.
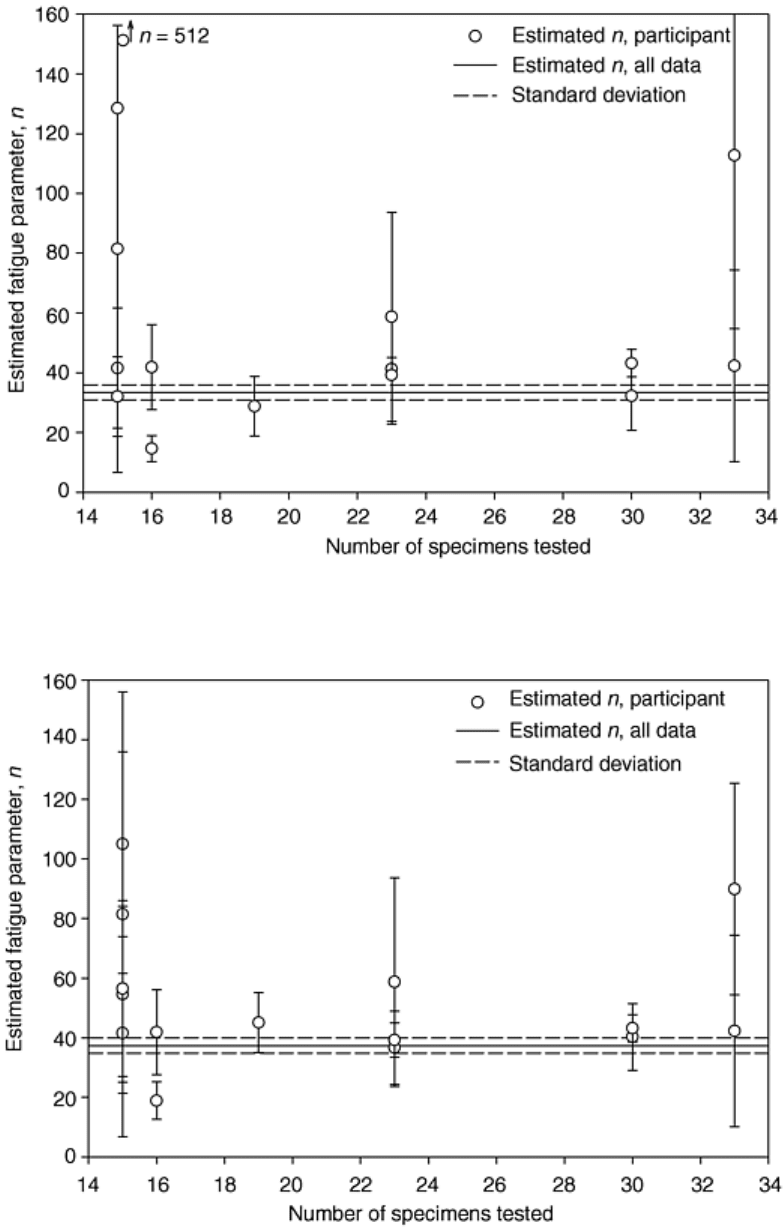
Fig. 7 Round-robin results comparing estimated fatigue parameters measured by dynamic loading of an
alumina in distilled water
Fig. 8 Round-robin results comparing estimated fatigue parameters for an alumina in distilled water.
Outlying data were censored.
The effect of the range of the stress rate can be seen in Fig. 9. If three orders of magnitude are covered, the
estimated value of n improves somewhat; however, more data are needed. It is not effective to increase the
number of tests without increasing the stress range. For example, one data set consisting of 33 tests measured
over 2.4 orders of magnitude still resulted in an estimated fatigue parameter three times greater than that for all
the data. Based on these results, it appears that at least 30 specimens and three orders-of-magnitude separation
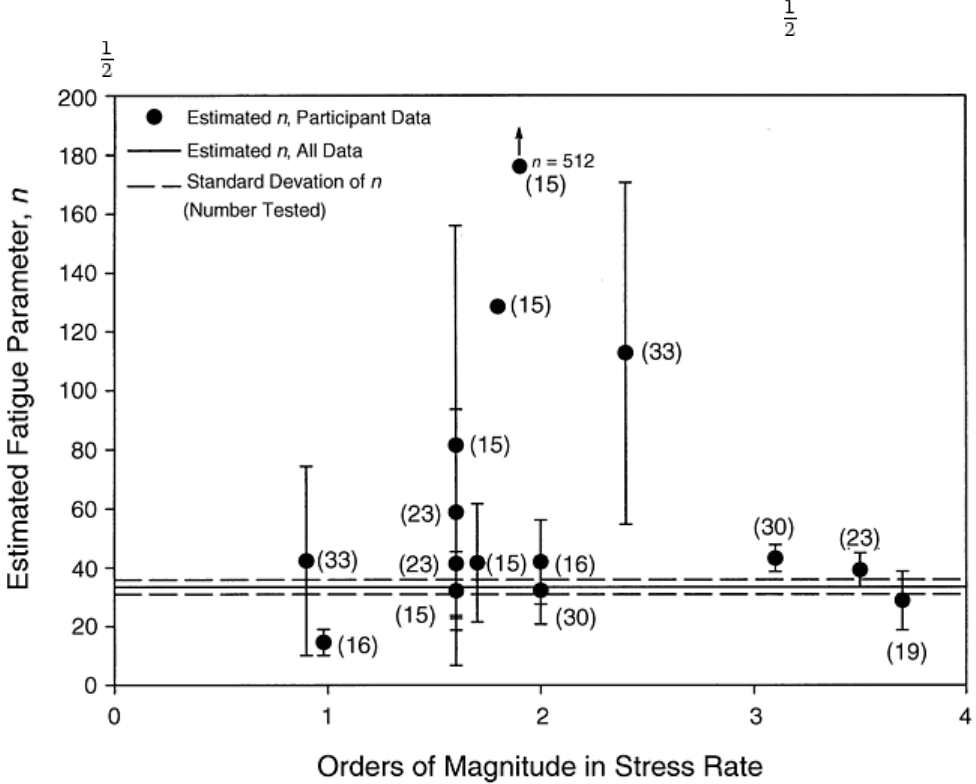
are required. Better results from a statistical viewpoint could be attained by testing of the specimens at the
lowest rate and at the highest rate (Ref 63).
Fig. 9 Round-robin results comparing estimated fatigue parameters for an alumina tested in distilled
water. Numbers in parentheses represent the number of specimens tested.
The round-robin results prompted the National Physical Laboratory to sponsor a follow-up, United Kingdom
only, round-robin (Ref 68). This led to another testing standard, ENV 843-3 “Determination of Subcritical
Crack Growth Parameters from Constant Stressing Rate Flexural Strength Tests” (Ref 15).
Cyclic Loading. Cyclic loading of ceramics and glasses has been performed for quite some time (e.g., Ref 1).
Initial results on glasses and materials with glass boundaries indicated little synergy of cycling on the life. Thus,
simpler test methods such as static and dynamic loading have generally been used, and the analysis adjusted to
account for load variation (Ref 45). However, as ceramics materials have been made less glasslike by
devitrification treatments and have been toughened by elongating the grain structure, transformation
toughening, or adding second phase particles, cyclic loading has been recognized as a significant issue (Ref 22,
23, 24, 25, 26, 27, 28, 29, 30, 31, and 32), and fatigue effects independent of the environment have been
measured.
Two testing methods have been standardized for the determination of cyclic fatigue strength of ceramics (Ref
16, 19). The standards focus on the method of data generation and give no guidance on how the data are to be
used. The two standards are somewhat complementary because one uses flexure of rectangular beam (Ref 16),
while the other uses uniaxial tension (Ref 19).
Test method JIS R 1621 “Testing Method for Bending Fatigue of Fine Ceramics” (Ref 16) recommends
applying a 20 Hz sinusoidal wave with an R-ratio of 0.1 to standard three- or four-point flexure configurations
(Ref 56). Other waveforms and frequencies are allowed. Three tests at three different maximum stress levels
that result in specimen fracture before 10
7
cycles are recommended. If three tests in a row result in lives greater
than 10
7
cycles, the remaining tests are conducted at a higher stress. The initial stress level is based on the
monotonic strength of the materials as measured with the same specimen and testing configuration. Testing can
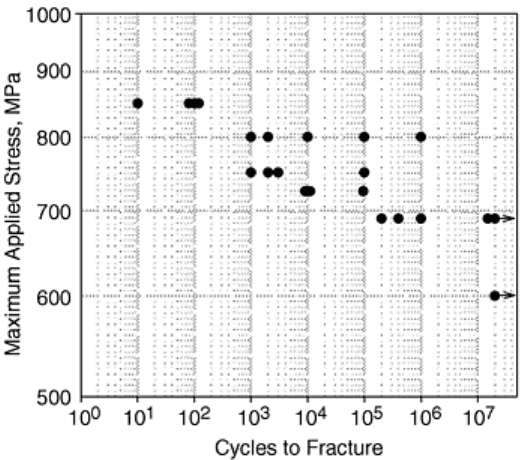
be halted after 10
7
cycles. An example of failure stress data as a function of the applied cycles is shown in Fig.
10.
Fig. 10 Example of the cycles to fracture for a ceramic material subjected to cyclic loading. Adapted
from Ref 16
Axial cyclic tensile fatigue testing can be performed with ASTM C 1361 “Standard Practice for Constant-
Amplitude, Axial Tension-Tension Cyclic Fatigue of Advanced Ceramics at Ambient Temperatures” (Ref 19).
Any of the tensile test specimens specified in ASTM C 1273 “Standard Test Method for Tensile Strength of
Monolithic Advanced Ceramics at Ambient Temperatures” (Ref 69) are allowed. These include a variety of
cylindrical button-head specimens, pin-loaded dog-bone specimens, and shoulder-loaded dog-bone specimens.
The standard allows any frequency, waveform, and R ratio as needed for a particular application. A test may be
terminated for any of four reasons: specimen fracture, reaching a predetermined number of run-out cycles,
reaching a predetermined specimen compliance or material elastic modulus, or reaching a predetermined phase
lag between control mode and response.
Tension-compression cyclic fatigue has been attained by use of the button-head tensile specimen and a
clamping and alignment fixture (Ref 39). Fully reversed bending fatigue can also be attained with flexure
specimens by use of two symmetric sets of load and support pins (Ref 70).
Another cyclic fatigue test method that has been applied to ceramics is rotary bending (Ref 71, 72). This
approach is particularly relevant to applications involving shafts, such as ceramic turbocharger rotors. The
method avoids problems associated with edge finish by using cylindrical specimens, and a wide range of
frequencies is easily attained. Tests run on alumina and silicon nitride at 57 Hz indicate a linear S-N curve to
10
7
cycles at which an indistinct knee occurs, implying a fatigue limit at ~10
8
cycles. The endurance stress
corresponded to about ¼ of the strength of the alumina and about ½ that of the silicon nitride. The fatigue
parameter n was 13 for the alumina and 25 for the silicon nitride, respectively, which is lower than those
typically determined for aluminas and silicon nitrides by static or dynamic techniques. The differences in the
fatigue parameters were attributed to the effect of reversed bending.
Cyclic fatigue of ceramics has also been performed by using cantilever bending of rectangular, dog-bone, and
tapered-beam test specimens at a variety of frequencies. Tapered beams and dog-bone specimens reduce the
probability that failure will occur at the support where the stress is a maximum. Figure 11 illustrates a tapered-
cantilever beam used to obtain 3000 Hz accelerated fatigue data on silicon nitride (Ref 39).
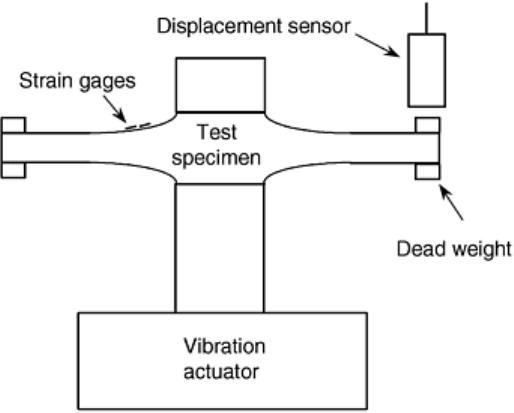
Fig. 11 Schematic of a high-frequency, tapered-cantilever beam test apparatus. Source: Ref 39
Testing of silicon nitride using tapered-cantilever beams at frequencies as high as 3000 Hz indicated a fatigue
limit at 40% of the monotonic strength (Ref 39). Interestingly, the life depended on the number of cycles rather
than the time and was well described by the modified Goodman diagram used to describe metallic fatigue. The
probability of failure was well described by the Weibull model. Axial tension-compression testing of the same
sintered silicon nitride indicated a fatigue limit around 10
7
cycles at a stress of 60% of the strength and an
increase in fatigue strength with increasing R ratio. The implication for this particular silicon nitride is that a
cyclic effect, rather than environmentally induced stress corrosion, dominated crack growth.
Tests using dog-bone specimens at 30 Hz (Ref 73) indicated no effect of cycling on the strength of two
different silicon nitrides for less than 10
7
cycles; however, relatively few specimens were tested. At
temperatures of 1200 and 1300 °C (2190 and 2370 °F), the effects of fatigue were more pronounced.
In contrast to the reversed fatigue results, tension-tension flexure fatigue of reaction-bonded, hot pressed, and
sintered silicon nitrides indicated environmentally related crack growth to be the failure-controlling mechanism
(Ref 74).
Fatigue testing of magnesia-partially-stabilized zirconia by using straight cantilever beams indicated a fatigue
limit around 10
8
cycles at a stress of 50% of the tensile strength (Ref 40). Reversed loading significantly
shortened the life of the material as compared with tension-tension loading.
Generally, servohydraulic actuators are used to generate cyclic fatigue loading of test specimens. However,
piezoelectric actuators in the form of stacks and cantilever spring plates also have been used (Ref 75, 76). These
systems allow relatively high frequencies (30 to 550 Hz) and compact test frames that do not require a
hydraulic pressure source. Figure 12 illustrates the test apparatuses.