ASM Metals HandBook Vol. 14 - Forming and Forging
Подождите немного. Документ загружается.

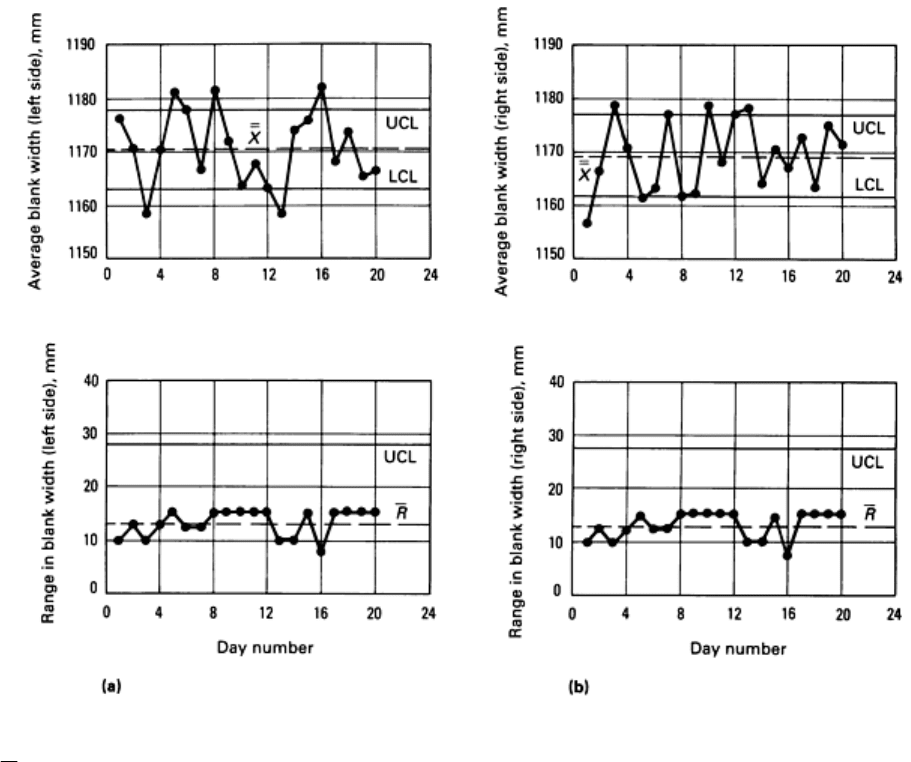
Fig. 6
X
-R control charts for left-side fender blanks (a) and right-
side fender blanks (b) taken as separate
populations.
Further observation of the blanking process revealed frequent tandem adjustment of both the right- and left-side guides in
response to changes in the width of the coil of steel. Even if the coil of steel did not change in width, movement of the
right and left guides would cause one blank to increase in width while the other blank would decrease in width. This
would cause the range to increase equal to twice the amount of the guide shift.
The first process change made was to weld the left-side guide into correct position. This meant that the left-side blank had
the correct width regardless of the width of the coil. As a result, all blank width variations were associated with the right-
side blank, and these variations could be related to the variations in the width of the coils of steel. These control charts
could be given to the steel supplier as a performance review of the as-supplied coil width variations.
Problem Solving Using Control Charts. Control charts are only signals to operators and management of the
operating conditions of the process. Personnel must respond to these signals and identify the sources of the variations.
Control charts are useful in many problem-solving situations (Ref 4); they can:
• Assist in distinguishing between special and common causes of variation
•
Help determine whether unacceptable variations can be improved by the personnel immediately involved in the
process (such as tightening a loose tool hold
er) or whether they are due to the system and can be corrected only
by management
• Identify trends in the process average
• Highlight increased process variability
The opportunities are limitless for using control charts as a key SPC tool. Data collection is the easiest aspect of the
process. Finding the cause of a problem will often require some difficult detective work, and elimination of the problem
may be a major task. For example, recording the scheduled times for a shuttle bus is easy. Determining the real cause of
deviation from the schedule may be difficult; periodic high traffic density may be due to maintenance being performed on
an adjacent street. To make the shuttle bus immune to delays and to improve trip time consistency would require a major
study and perhaps drastic modifications to the traffic control system.
Statistical Deformation Control
Each of the four components of a forming system--material, lubricant, tooling, and press--can be tracked using the SPC
techniques described above. Typical measurements could include:
• Material thickness, coil/blank dimensions, and properties
• Lubricant composition, viscosity, and application thickness
• Tooling pressures, surface treatment, and dimensional accuracy
• Press speed, stroke, and ram pressures
Many of these measurements are charted in an attempt to reduce process variability and to improve product quality.
However, the components of forming systems are complex, interactive, and synergistic; reliable models are not available
for predicting the output of the forming system based solely on the system inputs. Therefore, monitoring of the final
output of the system is required. Dimensional checking of the final product can be easily accomplished, but monitoring
forming severity is more difficult.
Numbers representing the percentage of scrap or the percentage of breakage are traditionally recorded to represent the
status of the forming system. These numbers are inadequate measures of forming severity. For example, many stamping
processes result in high levels of strain but not breakage. Therefore, the current behavior--no breakage--gives no
indication that breakage may be imminent; some measure of performance must be sought that permits a broader range of
conditions. Once breakage begins, the stamping process is out of control. General global straining ceases as the tear
develops and opens; other forming modes become active. In addition, the percentage of breakage averages the forming
severity over a large number of stampings instead of determining the forming severity at a preselected location in each
individual stamping. For these cases, percentage of breakage does not accurately define the various levels of severity.
One means of evaluating forming severity used in many sheet metal press shops is circle grid analysis and forming limit
diagrams; these are described in Ref 8, 9, 10, and 11. The actual amount of deformation that the sheet has experienced is
determined from the deformed circles (Fig. 7). The forming limit diagram shows the maximum amount of deformation a
stamping can undergo before failure. Forming severity can be defined as the maximum allowable deformation minus the
actual deformation. This forms the basis for monitoring and controlling stamping performance.
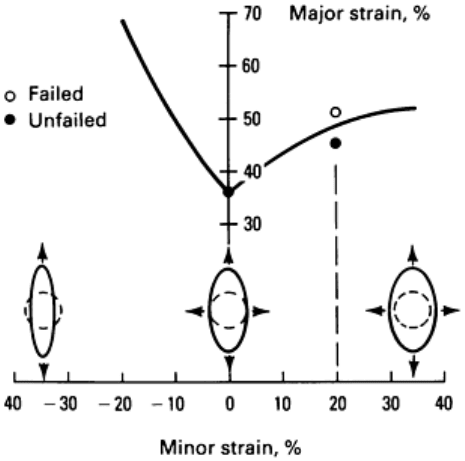
Fig. 7
Forming limit diagram showing strain states where forming is safe (below curve) and where stampings
will begin to fail from localized necking during forming (above curve). The strain values are determined from
deformed circle grids placed on the blank before forming.
The process of pregridding the blank before deformation and measuring the deformed circles presents logistical problems
if it is used for routine analyses of a large number of stampings over an extended period of time. These problems include
removing blanks from the material lifts for pregridding, the time required for gridding, careful reapplication of lubrication
to duplicate production levels, reinsertion of blanks into the production cycle without stopping production, proper lighting
for grid reading, the time required for accurate reading, and disposal of gridded blanks after analysis. Therefore, only one
or two stampings are commonly gridded to provide a single analysis (with respect to time) of the severity of the stamping.
No information can be deduced about the change of the forming system with time, nor can the single stamping be
characterized with respect to the dynamic changes of the system.
Dynamic changes, however, can be analyzed with statistical process control. A critical variable is measured at specified
intervals and plotted as a function of time to generate a control chart. From this control chart, using SPC analysis
techniques, the current status of the system can be identified relative to its historical performance. The dynamic variability
of the system can be defined, and determinations can be made as to whether the system is in control, out of control, or
changing.
Statistical deformation control (SDC) combines the best features of circle grid analysis, forming limit diagrams, and
statistical process control (Ref 12). The deformation severity of the stamping under investigation becomes the critical
variable that is tracked by statistical process control. To simplify the press shop procedures further, the amount of
deformation experienced by the stamping is defined by the ratio of final thickness t
f
to initial thickness t
0
. The thickness
ratio is determined from ultrasonic measurements of sheet metal thickness in the most critical zone of the stamping. The
ultrasonic measurements are rapid, the blanks do not have to be pregridded, and the stampings are not damaged by a grid
and therefore need not be scrapped after the measurement is made.
Like most analytical tools, statistical deformation control does not involve a single, invariant procedure. Several levels of
complexity are possible, and each level contributes an increased degree of understanding of the forming system. These
levels are:
• Level 1: generating a standard control chart
• Level 2: assigning a deformation severity value
• Level 3: separating material variability from process variability
• Level 4: determining sensitivity of the forming system to individual inputs

Again, like most analytical tools, statistical deformation control is flexible and should be applied only at the level
necessary to solve the problem. Therefore, routine applications of statistical deformation control to a system that is in
control will be at the level of the basic control chart.
All levels of statistical deformation control require a preliminary stamping analysis. Measurement of deformation at the
critical location is a key element of statistical deformation control. Therefore, an early circle grid analysis of the stamping
in question is required to identify the location, mode, and severity of strain in the most critical zone within the stamping.
Repetitive ultrasonic measurement of many stampings over an extended period of time requires a template to be made for
the ultrasonic probe; the simplest template is a section of an identical stamping with a hole drilled for the head of the
probe.
Template holes are drilled for the most critical location and for an area of the stamping that is undeformed. The latter
measurement is required to determine the initial thickness of the stamping in order to generate the final-thickness-to-
initial-thickness ratio without the inconvenience of premeasuring the blank thickness. The ability to measure critical and
initial metal thicknesses on the formed stamping means that random stampings can be selected for evaluation after
production.
SDC Level 1: Control Charting. Standard control-charting procedures are used. A typical application would require
the removal of five stampings in sequence at the end of the press line. Measurements of the thickness in the critical zone
and an undeformed zone would be made, and the thickness ratio calculated. These five ratio values would then be
converted into the traditional
X
-R values and plotted on the control chart. Control chart analysis procedures are used to
calculate upper and lower control limits and other SPC data.
The control chart is monitored to determine the viability of the forming system and to initiate corrective actions when
such actions are mandated (Ref 4). The importance of these analyses is the predictive capability, which can provide early
warning of impending forming process failures. Therefore, statistical deformation control can be used to show an increase
in the forming severity for a press line for which breakage is not yet a problem, as in the following example.
Example 3: Tracking a Sheet Metal Forming System by Monitoring Metal Thinning.
An appliance stamping for a range top was selected for study, using sheet metal thinning as a measure of stamping
severity. Measurements were conveniently made with an ultrasonic thickness gage, which permitted measured stampings
to be returned to the production line without loss of the stampings. Because breakage was not a problem with this
stamping, measurements were made only twice a week. The results of the measurements are shown in Fig. 8.
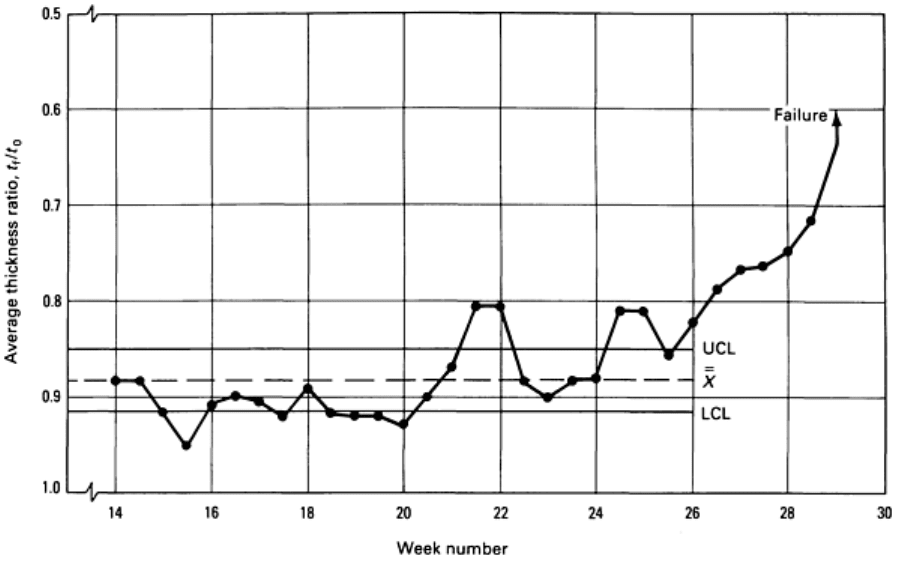
Fig. 8 Control chart of average thickness ratio t
f
/t
0
for a stamping. Note the increase in forming severity
(reduced thickness ratio) beginning at w
eek 21 and the continuous decrease in thickness ratio beginning at
week 25.
The stamping was shown to be out of control. However, because the amount of metal thinning did not cause breakage, the
stamping was not on the list of problem stampings. After 6 months of good performance, the amount of metal thinning
began to increase. Eventually, excessive production breakage of the stampings began to occur. Because this was a test of
the SDC procedure, no attempts were made to determine the cause of the increased thinning or to correct the cause. This
would have disrupted the test and would have changed the data base. However, the test did show that the stampings that
were not breaking could be statistically tracked over extended periods of time in order to detect changes in severity that
would lead to production problems if left uncorrected. The absence of breakage in a forming process does not necessarily
indicate that the process is in control.
SDC Level 2: Severity Assignment. A unique feature of statistical deformation control for formability analysis is
that each control chart can be subdivided and calibrated according to forming severity for each type of stamping made in
the press shop. This severity assignment is independent of whether the process is in or out of control. The severity ranges
are assigned based on the thickness forming limit diagram (Ref 12). The following example shows how a process can be
in control and producing good stampings and yet have an insufficient safety factor for good long-term reliability.
Example 4: Assigning a Severity Rating for Stampings With Only Sporadic Breakage.
Sporadic breakage was occurring in an automotive stamping. The question was asked whether this breakage was the
result of random events not typical of the normal system or whether the system was in fact critical and the breakage was a
normal by-product of statistical swings in severity. To determine this, metal-thinning readings were made for several
weeks (Fig. 9). The control chart showed that the system was in control.
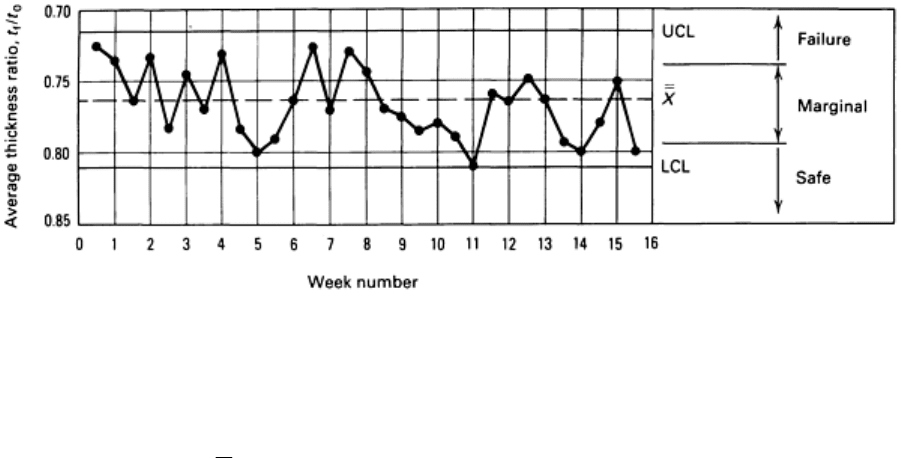
Fig. 9 Severity zones added to average thickness ratio control chart in a Level 2 SDC analysis.
Additional information was gained, however, when deformation severity zones were added to the control chart (Ref 12).
The severity zones showed that
X
was in the marginal zone and that some proportion of the control chart fell in the
breakage zone. This meant that the sporadic breakage was normal for the system as established and could be expected to
continue as long as the process was maintained as currently designed. However, the process was in control and therefore
amenable to a process change that would lower the upper control limit from the failure zone into the marginal zone.
Specifications, Control Limits, and Forming Severity. An important point of understanding is the differences
among engineering specifications, control limits, and forming severity. For example, a stamping is designed to have a
maximum metal thinning of 42% in order to meet in-service performance requirements. The control limits indicate
whether the process is in statistical control. The state of being in statistical control means that all special causes of
variation have been eliminated and that only common (random) causes remain. Special causes are intermittent sources of
variation that are unpredictable or unstable; sometimes called unassignable causes, these variations are signaled by points
beyond the control limits. An example of a special cause would be inserting the wrong material into the forming process.
On the other hand, common causes of variation are always present and indicate the random variation inherent in the
process itself. An example of this would be excess gap in the punch guidance system. Forming severity is the proximity
of a given stamping to breakage. This forming limit is independent of future in-service performance requirements or part-
by-part variation over time.
Example 5: Comparing Engineering Specifications and Forming Severities to Control
Charts.
Engineering specifications, control limits, and forming severity for a control arm are illustrated in Fig. 10. The allowable
maximum metal thinning specified by the part print (engineering specification) is rather high. In fact, the engineering
specification is in the failure zone of Fig. 10. This means that the stamping would fail before attaining the maximum
thinning allowed by the engineering specification. Therefore, the practical thinning limit of the process is established by
forming severity rather than engineering specifications.
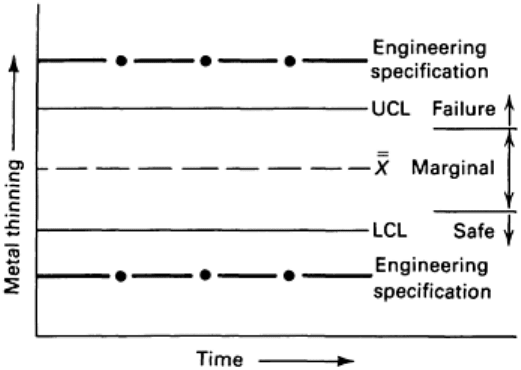
Fig. 10 Schematic control chart showing the differences among engineering
specifications, control limits, and
severity zones.
The control chart and its attendant control limits reflect the current operating status of the forming process. In Fig. 10, the
operating status of the control arm is shown to be in control but with a certain portion of the control chart in the failure
zone. This means that some quantity of pieces will break in the forming process. Changes in the forming process, such as
modifying the lubricant or reducing the die radii, could narrow the control limits shown in Fig. 10, but would not change
the position of the engineering specification or the severity limits. The initial assessment of forming severity and the
tracking of the severity through the production life cycle of the stamping--and especially through tooling modifications--
are important aspects of statistical deformation control.
SDC Level 3: Material Versus Process Variability. Statistical process control or statistical deformation control
can easily identify a forming system that is out of control. Determining the cause of the variability is a more difficult
problem. An important first step for most press shops is to separate variability in incoming material from process
variability (for example, lubricant, tooling, press, and other in-house variables).
Statistical deformation control provides a method of separating this variability. First, a list of reference material is set
aside. This reference material would typically be production material that has average, but consistent, properties. Ideally,
this would be verified by evaluating the mechanical properties and surface characteristics of the top and bottom sheets.
Each time a control chart measurement is made with production material, an equal number of identified reference blanks
are also formed, and the severity is measured. Two charts of severity versus time are maintained; one for the production
material and one for the reference material (Fig. 11). Comparison of Fig. 11(a) and 11(b) indicates whether the system
variability is due to the production material or the process.
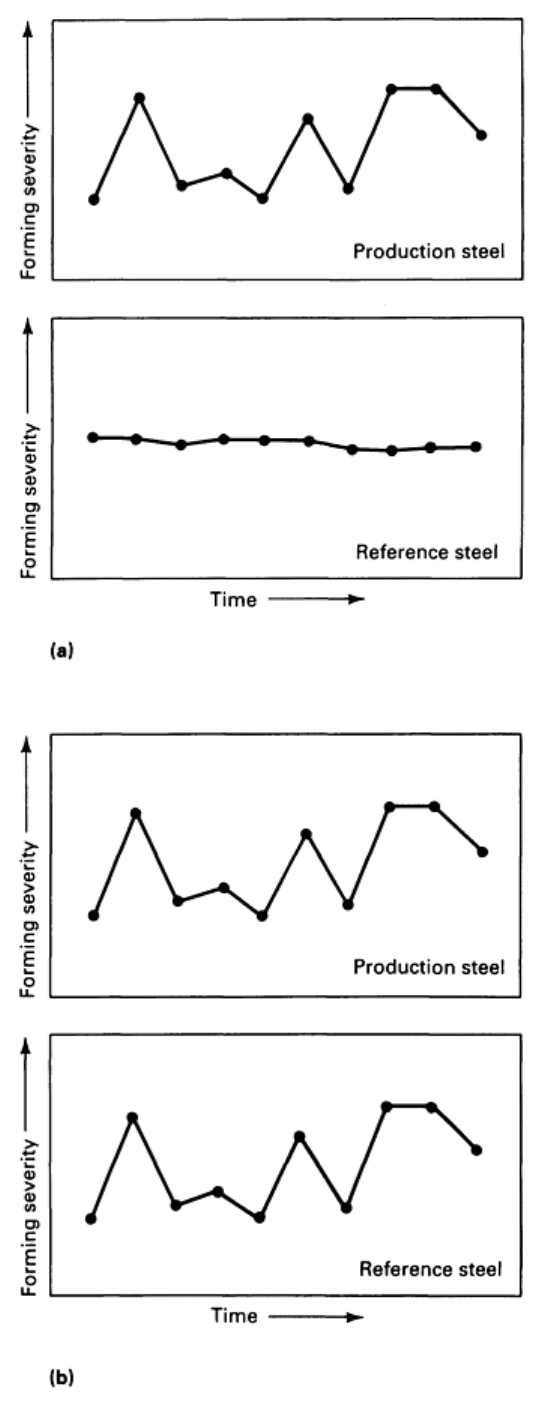
Fig. 11
Schematic control charts showing the effects of materials variables (a) and process variables (b). The
identical variations in forming severity for both production and
reference steel in (b) indicate that the
fluctuation in severity is caused by process variables.
In Fig. 11(a), the forming severity of the production steel is varying, while the forming severity of the reference steel is
relatively constant. This indicates that the process parameters are producing a stamping of constant severity and that
system variability is due to incoming material variability. The reverse is true in Fig. 11(b); the variability of the
production material is identical to that of the reference material. This indicates that all variation in forming severity is due
to process variables.
For most forming processes, the forming severities of both the production material and the reference material will vary,
but will not be identical to each other. This indicates the common situation in which both the material and the process
affect the output of the forming system. The variability must then be apportioned between material and process.
SDC Level 4: Input Sensitivity. Once the forming system variability has been identified as being either material or
process related, a more detailed analysis can be conducted to minimize this variability. A key control factor is identified
and changed to determine the improvement to the system variability (or conversely, system stability). Selection of the
factor can be based on experience or experimental techniques, such as the Taguchi method (see the section "Taguchi
Experiments" in this article).
There are at least two analysis possibilities. One is to process the new material according to the modified specification--
for example, a new metal thickness. This new material parameter is then processed with the reference material and the
severity data compared. The key is to run the reference material with the new material in order to isolate material
variability from process variability.
A second technique would be to substitute the modified material (alternate parameter) for the reference material. Severity
data are then collected for the regular production material and the modified material. The two severity curves can be
compared to separate the process variability (Fig. 12) and to permit judgments about the relative performance of the two
conditions. If sufficient data points (usually > 25) are collected, complete control chart information can be calculated.
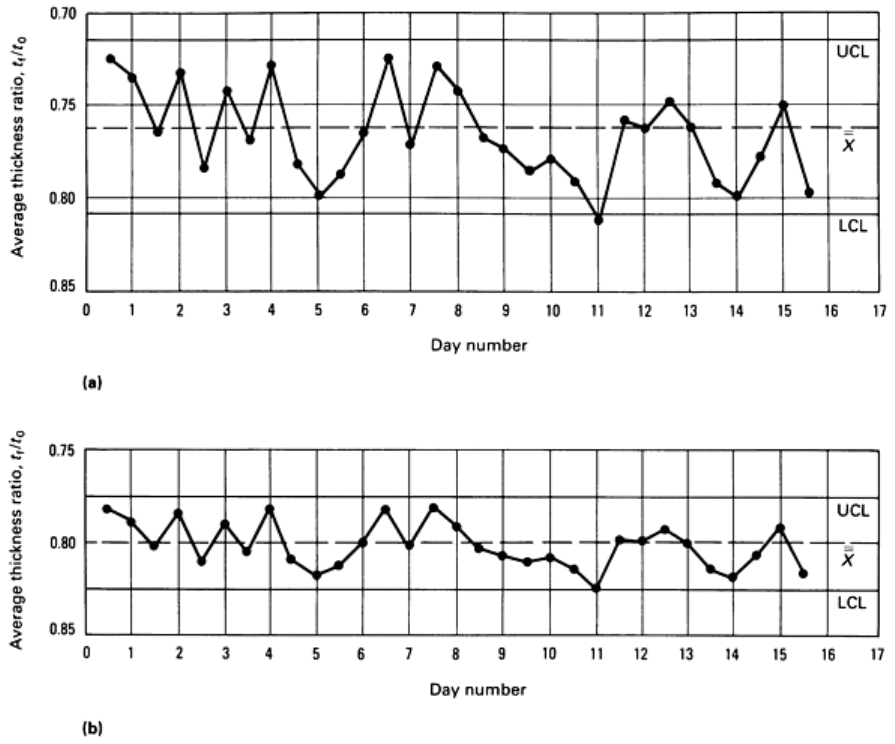
Fig. 12 Control charts showing original spread
of process means (a) and second chart showing reduced spread
of process means (b) after a change in the process.
The importance of statistical process control and statistical deformation control can be illustrated by describing two
alternative methods of process control and analysis, both of which contain major flaws. One common method of process
analysis is to produce a large quantity of output (in this case, sheet metal stampings) with condition A (the first level of
the parameter under investigation, such as material properties, type of lubricant, press setting, and so on). The next step is
to produce a large quantity of output with condition B (the second level of the parameter). The percentage of part
breakage is then compared. A major problem exists if breakage is zero for both levels of the parameter under study. Even
if the breakage is different for the two conditions, one cannot determine if the difference is due to the change from
condition A to condition B, a change in the process itself, or normal statistical variation.
A second method of process analysis is to produce one stamping with condition A and one with condition B. The
stampings are compared in some manner, such as degree of tearing or visual quality (Fig. 13). The argument is made that
if two sequential stampings are produced, then the process is unchanged. However, statistical information is needed to
compare the relative change of the two stampings with the normal expected statistical change between any two
consecutive stampings without any intentional system changes.