Allman E.S., Rhodes J.A. Mathematical Models in Biology: An Introduction
Подождите немного. Документ загружается.


316 Curve Fitting and Biological Modeling
most important feature of the data, and perhaps eventually lead to a deeper
understanding of the mechanism producing the pattern. Thus, fitting curves to
data is useful in data-driven fields even when our understanding is too limited
to produce more detailed models.
In this chapter, we will explore some of the basic ideas in curve fitting,
including the most heavily used technique, called least squares. Though the
computations necessary for basic curve fitting are readily performed by most
data analysis software, understanding the mathematical ideas behind them is
helpful in using such software effectively.
8.1. Fitting Curves to Data
As medical researchers develop a new drug, an important issue to be under-
stood is how the concentration of the drug in the bloodstream changes as the
drug is metabolized. To study this, a researcher might administer an initial
dose to bring the concentration to the level of 200 mg/l, and then monitor the
changing concentration over the next few days. Data such as that recorded in
Table 8.1 might be obtained. Notice that no measurement was recorded for
day 2; perhaps the patient missed an appointment or the laboratory work was
botched.
Suppose for therapeutic value, the concentration of drug in the blood needs
to be kept at a level above 100 mg/l. Then, because the table shows the level
dropping below that sometime between 1 and 3 days after the initial dose, the
new dose should be administered sometime in that time period. Unfortunately,
the missing data for day 2 makes it hard to pin down more closely when the
100 mg/l level is crossed.
Based on the available data, do you think the level that would have been
measured on day 2 is greater than or equal to 100 mg/l? How would
you try to persuade someone who disagreed with you?
One approach to answering this question begins with the observation that
the drop in level between times 0 and 1 is much larger than that between times
3 and 4. This might indicate that each passing day produces a smaller drop
Table 8.1. Concentration y of
Drug in the Bloodstream t Days
After Dosage
t (day) 0 1234
y (mg/l) 200 129 — 58 33
8.1. Fitting Curves to Data 317
0
20
40
60
80
100
120
140
160
180
200
t (days)
y (mg/l)
0 0.5 1 1.5 2 2.5 3 3.5 4 4.5
5
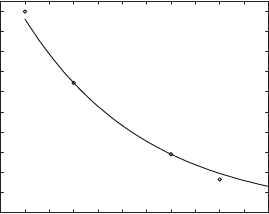
Figure 8.1. Data from Table 8.1 with an exponential decay trend.
in level, and so the measurement on day 2 would be lower than the midpoint
between the day 1 and day 3 measurements. Since (129 + 58)/2 = 93.5,
probably the day 2 measurement would have been less than 100 mg/l.
Although this sort of reasoning is fine as far as it goes, it’s inadequate for
answering more refined questions. For instance, what is the best estimate of
the level on day 2? This is a question of interpolating the data to estimate
values between entries in the table. If, instead, we wanted to estimate the level
on day 5, then we need to extrapolate, because we have data entries on only
one side of that day.
Plotting the above data produces the points marked in Figure 8.1. The
data points appear to cluster along an exponential decay curve like the one
shown. Finding a formula for that curve, or a similar one that fits the data
well, would enable us to both describe the data and estimate unknown values
easily. Interpolating and extrapolating could be performed by simply plugging
time values into the formula for the curve. A curve that describes the data
well overall, though perhaps not in all its particulars, serves as a model for the
data. Because exponential decay curves are described by formulas of the form
f (t) = ae
kt
with k < 0, our goal is to find the best choice of the parameters
a and k to ensure a good fit between the data and the model.
You might imagine that just collecting more data, by taking more frequent
measurements over a longer time, would be preferable to fitting a curve to the
data we have. Even if we collect more data, though, we would still find it useful
to fit a curve to it. Finding a formula that describes the overall trend in the data
would give a succinct description of it, and might give us more insight than the
raw numbers that were collected. Also, we should expect minor fluctuations in
the data around its overall trend, due to measurement errors and the specifics

318 Curve Fitting and Biological Modeling
of the patient’s activities during the period of the study. Fitting a simple curve
to the data is, like most models, a way of focusing attention on main features
and ignoring details we consider less important.
Our first approach to finding a and k is a simple one. We can use the data
points to get relationships between the parameters by plugging the points into
the equation f (t) = ae
kt
. For instance, the data point (1, 129) gives
129 = ae
k
.
With two unknowns in this equation, we cannot yet solve, so considering
another data point, say (3, 58), gives
58 = ae
3k
.
Now, the first equation gives a = 129e
−k
, which can be substituted into the
second to obtain
58 = (129e
−k
)e
3k
= 129e
2k
.
Thus
58
129
= e
2k
,
so taking a natural logarithm, we find
k =
1
2
ln
58
129
≈−.3997.
Now, because a = 129e
−k
, using this value of k to solve for a gives a ≈ 192.4.
Thus, our first attempt at fitting an exponential curve to the data yields
f
1
(t) = 192.4e
−.3997t
.
This curve is the one that was graphed in Figure 8.1.
What does this curve indicate as the amount of drug in the patient at
time t = 2? At time t = 5?
Looking at the figure carefully, we notice that the graph of y = f
1
(t) passes
through exactly two of the data points, but is only near the others. We should
have expected this, because we used only two data points to solve for a and
k. We have completely ignored 2 of the 4 measurements that were taken. This
is, of course, a significant drawback to our approach.
Suppose another researcher chooses the first two data points and solves
for the constants a and k. How would the resulting curve compare with
the one above? Do you think it would be a better model?
8.1. Fitting Curves to Data 319
If different researchers propose different curves as good fits to the data, an
objective way of measuring the fit is needed. A start at measuring goodness of
fit between a curve y = f
1
(t) and data is to look at the difference between the
y-coordinates of the data and the y-coordinates of f
1
(t). We can gather these
differences into an error vector e. For the data and curve y = f
1
(t) above, we
find the error is
e
1
≈ (200, 129, 58, 33) − (192.4, 129.0, 58.00, 38.89)
≈ (7.6, 0, 0, −5.89).
Note that a data point below the curve produces a negative error and that one
above produces a positive error. As already observed, at the two points used
in fitting the curve, the individual errors are zero, or at least very close to zero
due to rounding.
A major flaw in our first curve-fitting attempt is that it only used some of
the data points in finding an equation. One possible way around this problem
is to fit the data to a curve with more parameters. For instance, with the data
above, fitting an exponential of the form g(t) = ae
kt
+ b would use three data
points because of the three parameters a, k, and b. The resulting curve g(t)
will pass exactly through those three points, making three entries in the error
vector be equal to zero.
Although the idea of including more parameters in the curve seems attrac-
tive at first, it could be a real mistake. For instance, as one of the exercises
will show, there is a theoretical model that justifies why a curve of the form
f (t) = ae
kt
is really the appropriate one for dealing with the metabolization
of a drug. Even in situations where no such theory exists, it is often better to
use simple formulas to fit data rather than complicated ones. After all, some
of the details in the data may be due to experimental artifacts and random
variations, and are not really part of the trend we hope to capture. A simple
curve that comes close to all data points may therefore be a more valuable
description than a complicated curve that exactly hits all points.
Semilog and log–log graphs. As a second attempt to fitting a curve f (t) =
ae
kt
to the data above, we will try to use all the data points. Of the two unknown
parameters, a and k, we might think that k is more important because it
indicates the rate of decay. This suggests that we should focus on a technique
of finding the decay rate k using all of the data points.
A clever way to estimate k is to use a semilog plot. For the moment,
view our four data points as approximated by ordered pairs of the form
(t, y) = (t, ae
kt
). If we transform the data by taking natural logarithms of the
320 Curve Fitting and Biological Modeling
Table 8.2. Semilog Transformation of
the Data in Table 8.1
t01234
ln y 5.298 4.860 — 4.060 3.497
y-coordinates, we obtain ordered pairs of the form (t, ln y) = (t, kt + ln a).
Notice that the new second coordinates of these points have a simpler pat-
tern; they are now linear functions of t, because they have the form kt + ln a,
where k and ln a are just constants. If we could find the slope of the line
relating these transformed data points, then that would be a good estimate for
k, the decay rate.
In a semilog plot, we graph the transformed data (t, ln y). The name refers
to the fact that we take a logarithm of only one of the coordinates. (Although
it is also possible to form a different type of semilog plot using (ln t, y), that
would not help us here, since our goal is to estimate k as best we can.)
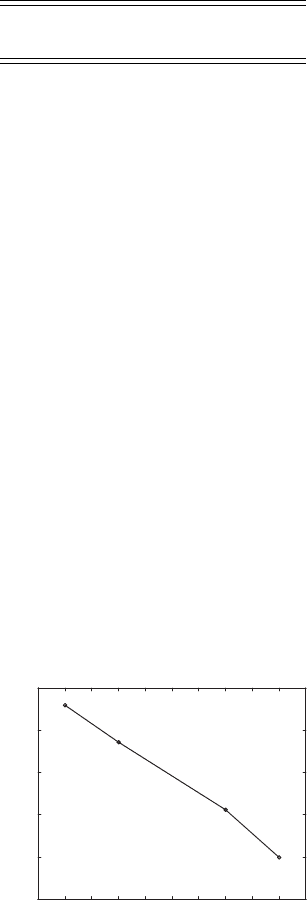
The semilog transformation of the data of Table 8.1 gives Table 8.2 and
Figure 8.2. The figure shows how a semilog transformation converts nearly
exponential data into nearly linear data.
Although Figure 8.2 might lead us to guess that k ≈−.5, it’s best to per-
form a calculation with all the data points to estimate the slope. A reasonable
idea is to first find the slopes of the line segments joining adjacent transformed
data points and then use the average of those three slopes as an estimate for k.
The slope between the first two transformed data points is m ≈ (4.860 −
5.298)/(1 − 0) =−.438. Similarly, we find the slopes between the other pairs
of consecutive points as −0.400 and −0.563. Finally, taking the average of
these slopes, we estimate k ≈ (−.438 − .400 − .563)/3 =−.467.
3
3.5
4
4.5
5
5.5
t (days)
ln(y)
0 0.5 1 1.5 2 2.5 3 3.5 4 4.5
Figure 8.2. Semilog plot of the data in Table 8.1: (t, ln y).
8.1. Fitting Curves to Data 321
Note that this estimate of the growth rate k is slightly different from that
found in our first attempt at curve fitting in which we used only two data
points. Although we still do not know if this estimate of k is better, we might
suspect that it is because we used all the data in the estimation procedure.
To finish finding the equation f
2
(t) = ae
−.467t
that models the data, we
must pick a value for a. A quick way is to use one of the data points to solve
for a. We will choose one of the middle data points, (1, 129), in the hope that
its central location in the data set might make the curve f
2
(t) fit the data the
best. Substituting t = 1 and y = 129 and solving, we obtain a ≈ 205.8, and
f
2
(t) = 205.8e
−.467t
.
How might you better estimate a in a way that uses all of the data?
The idea of transforming data with a logarithm was useful here because it
converted exponential decay into linear behavior. A similar approach is useful
when we believe a curve given by a power function y = ax
n
should fit our
data. For this particular curve, taking a logarithm of both x and y is useful,
because
y = ax
n
is equivalent to ln y = n ln x + ln a.
This means that a graph of the points (ln x, ln y) = (ln x, ln a + n ln x) will
form a line, with slope n. Such a plot is called a log–log plot. If a log–log
plot of data looks close to linear, then a good estimate of the slope of the line
will be a good estimate for the degree of the correct power function to fit.
Indeed, if we can find a good estimate for the equation of the line relating
ln x and ln y, say ln y ≈ m ln x + b for some m and b, then exponentiating
this equation gives y ≈ e
b
x
m
, which is a power function fitting the data.
Significantly, semilog and log–log transformations allow us to reduce the
problem of fitting either exponential or power functions to data to that of fitting
a line to transformed data. If we develop a means of finding good models for
linear relationships between variables, then by using various transformations
on our data if necessary, we will also know how to find good models of certain
other types of relationships.
Measures of error. So far, we have used two ad hoc methods to fit an
exponential curve to four data points. Both
f
1
(t) = 192.4e
−.3997t
and f
2
(t) = 205.8e
−.467t
are reasonable candidates for exponential curves fitting the data, but which
is better? Although we suspect that the second curve f
2
(t) = 205.8e
−.467t
probably describes the data better than f
1
(t) = 192.4e
−.3997t
, since we at
322 Curve Fitting and Biological Modeling
least used all the data in finding it, we need to be precise about what “better”
means. Using graphical perception or vague suspicions to choose which graph
is superior is too subjective; a different viewer might choose differently.
Earlier, we determined that the vector of errors for f
1
(t) was given by
e
1
≈ (7.6, 0, 0, −5.89).
Each of these numbers measures the vertical displacement between a data
point (t
i
, y
i
) and the point (t
i
, f
1
(t
i
)) on the graph of f
1
(t) with the same t
value. Calculating the error vector e
2
for f
2
(t)’s fit to the data gives
e
2
=
200
129
58
33
−
205.8e
−.467(0)
205.8e
−.467(1)
205.8e
−.467(3)
205.8e
−.467(4)
≈
−5.8
0
7.3
1.22
.
Note that only one of the entries of e
2
is zero. Also, whereas e
1
had two zero
entries, it also has an entry larger than any of those in e
2
. Apparently, there
has been a sort of trade-off, where fitting perfectly at two points produces a
worse fit at others.
Instead of comparing corresponding entries in error vectors one at a time,
the individual errors can be combined into a single scalar that measures the
overall fit. To compute a measure of the total error for each of the fitting
curves, we might try adding the components of the error vector. Unfortunately,
because some of the components of the error vectors are positive and some
are negative, there would be some cancellation. The number computed would
give too small a measure of the total error.
A better idea is to sum the absolute value of the errors. This is called the
total deviation for the fit of the curve to the data. For the error between f
1
and the data,
TD( f
1
) =|7.6|+|0|+|0|+|−5.89|=13.49,
whereas for f
2
,
TD( f
2
) =|−5.8|+|0|+|7.3|+|1.22|=14.32.
Total deviation, therefore, gives a quantitative reason to say that f
1
fits the
data better than f
2
.
A second way to overcome the cancellation problem is to square each of
the entries of the error vector. This is called the sum of squares for error.
SSE( f
1
) = (7.6)
2
+ 0
2
+ 0
2
+ (−5.89)
2
= 92.4521
SSE( f
2
) = (−5.8)
2
+ (0)
2
+ (7.3)
2
+ (1.22)
2
= 88.4184
8.1. Fitting Curves to Data 323
Note that using SSE to measure total fit indicates that f
2
was a better fit than
f
1
.
As this example shows, SSE and TDgive genuinely different criteria for
determining which fit is best. Although both are reasonable measures of total
error in fitting a curve to data, one must be chosen so that we have a standard
way of comparing. The SSE measure of fit is the one most heavily used by
scientists, and the one on which we will focus. As some of the exercises will
indicate, TD has some unpleasant properties that make it a poorer choice.
The use of SSE can also be grounded in statistical models of error.
But, even if we decide to use SSE to measure total fit, there might be an
exponential curve that fits the data even better than f
2
does. We have found
two particular curves, based on two approaches that happened to come to
mind, yet there may be a still better curve that we have not thought of. How
we can find the best curve will be a question for the next section.
Problems
8.1.1. Find a formula for the exponential f (t) = ae
kt
that passes through
the first two data points in Table 8.1. Then compute the error vector,
measuring its fit to the data. Is it a better or worse fit than the function
f
1
(t) found in the text when the total error is measured by TD? Than
f
2
(t) when total error is measured by SSE?
8.1.2. In the second approach of this section to finding an exponential curve
to fit the data in Table 8.1, all data points were used to estimate k,but
only one to estimate a.
a. Invent a scheme that uses all points to estimate a (after k has been
estimated) and carry it out.
b. Use SSE to determine if the curve you found in part (a) is a better
or worse fit than y = f
2
(t).
8.1.3. Consider the three data points: (2, 7.6), (5, 15.3), (10, 32.1). Three
candidates for best-fit line for this data are
y = 2.9x + 1.9, y = 2.9x + 2, y = 3x + 1.1.
a. Plot the data points and the three lines on the same graph. (In MAT-
LAB this can be done with the commands like: x=[2,5,10],
y=[7.6,15.3,32.1], plot(x,y,'o'), hold on, L1=
3*x+1.1, plot(x,L1).) Which of the three appears to be the
best fit?
324 Curve Fitting and Biological Modeling
b. For each line, compute the error vector and SSE. Which of the three
lines fits the data points best by giving the smallest SSE?
c. By looking at your graphs and making informed guesses, try to
find a line that produces a smaller SSE than any of the three given
ones.
8.1.4. Drug levels in the bloodstream are typically observed to decay expo-
nentially with time from the administration of a dose. A difference
equation model that describes this (and gives further reason to try to
fit the data of Table 8.1 to an exponential curve) is y
t+1
= (1 −r )y
t
,
where r is the percentage of the drug that is absorbed by tissue or
broken down by metabolization during one time step.
a. If the initial amount of the drug is y
0
, explain why this model leads
to y
t
= y
0
(1 − r )
t
.
b. Letting k = ln(1 − r) and a = y
0
, show this is equivalent to y
t
=
ae
kt
.
c. Explain why 0 < r < 1 for this model, and then why k < 0.
8.1.5. You might think that the four data points in Table 8.1 could be modeled
well with a straight line.
a. Using only the two middle data points, fit a straight line y = mt + b
to the data. Compute the error and SSE. Is your line a better or worse
fit than y = f
2
(t)?
b. Invent a scheme to find a straight line that fits the data better than
the line you found in part (a). Compute its SSE. Is it a better or
worse fit than y = f
2
(t)?
8.1.6. At times t = 1, 2, 3, 4, 5, and 6 seconds, data values y
t
= 3, 7, 17,
37, 82, and 182 are recorded.
a. Plot the data. (In MATLAB, after storing the t and y values in
vectors, use plot(t,y,'o').) From this graph, do you think
a linear, exponential, or power function is the best model for the
data?
b. Produce a semilog plot and use it to roughly estimate the growth
rate k for a model of the data given by a curve of the form y = ae
kt
.
(In MATLAB, plot(t,log(y),'o') will produce the plot.)
c. Produce a log–log plot and use it to roughly estimate the degree n
of a power function, for a model of the data of the form y = at
n
. (In
MATLAB, plot(log(t), log(y),'o') will produce the
plot.)
8.1.7. Using TDto measure total error can sometimes ignore a piece of data,
as this problem will show.
8.2. The Method of Least Squares 325
Consider the three points (0, 0), (1, C), and (2, 0), where C > 0,
and the problem of finding the best horizontal line y = b to fit these
points.
a. Explain why any horizontal line below all three points cannot be
the best fit, by drawing a plot and imagining what happens to TD
as the line is moved upward.
b. Explain similarly why any horizontal line above all three points
cannot be the best fit.
c. Explain why, if a horizontal line is below the middle point and
above the others, then TDcan be decreased by lowering the line to
go through the bottom two points.
d. Conclude y = 0 is the best-fit horizontal line when TDis used as
a measure of total error. Because this result does not depend on C,
the value of C has no effect on the line.
e. For a challenge, explain why y = 0 is the best-fit line (horizontal
or not) for the three data points.
8.1.8. Using TD to measure total error does not always produce a single
best-fit curve; there can be many curves that are all equally good.
To see how this can happen, consider the four points (0, 0), (1, 1),
(2, 1), and (3, 0), and the problem of finding the best horizontal line
y = b to fit these points.
a. As in the previous problem, explain why the best-fit horizontal line
cannot lie above all the points or below all the points.
b. Explain why any horizontal line above the two bottom points and
below the two top points will have TD= 2.
c. Conclude from parts (a) and (b) that there may not be a unique
solution to the problem of fitting a curve to data, if total error is
measured using TD. (If total error is measured by SSE, there is a
unique best-fit line.)
8.2. The Method of Least Squares
While exploring the idea of fitting curves to data in the last section, we
discovered that even fitting an exponential curve to data could be reformulated,
through the use of semilog graphs, as a problem of fitting a straight line.
In fact, the most common curve-fitting problems experimentalists face are
usually those of straight line fits. Data are collected, a plot is made (using
a transformation if necessary), and the data points often appear to cluster in
a roughly linear manner. Then, the best-fit line to describe the data must be
chosen.