Yung Y.L., DeMore W.B. Photochemistry of Planetary Atmospheres
Подождите немного. Документ загружается.

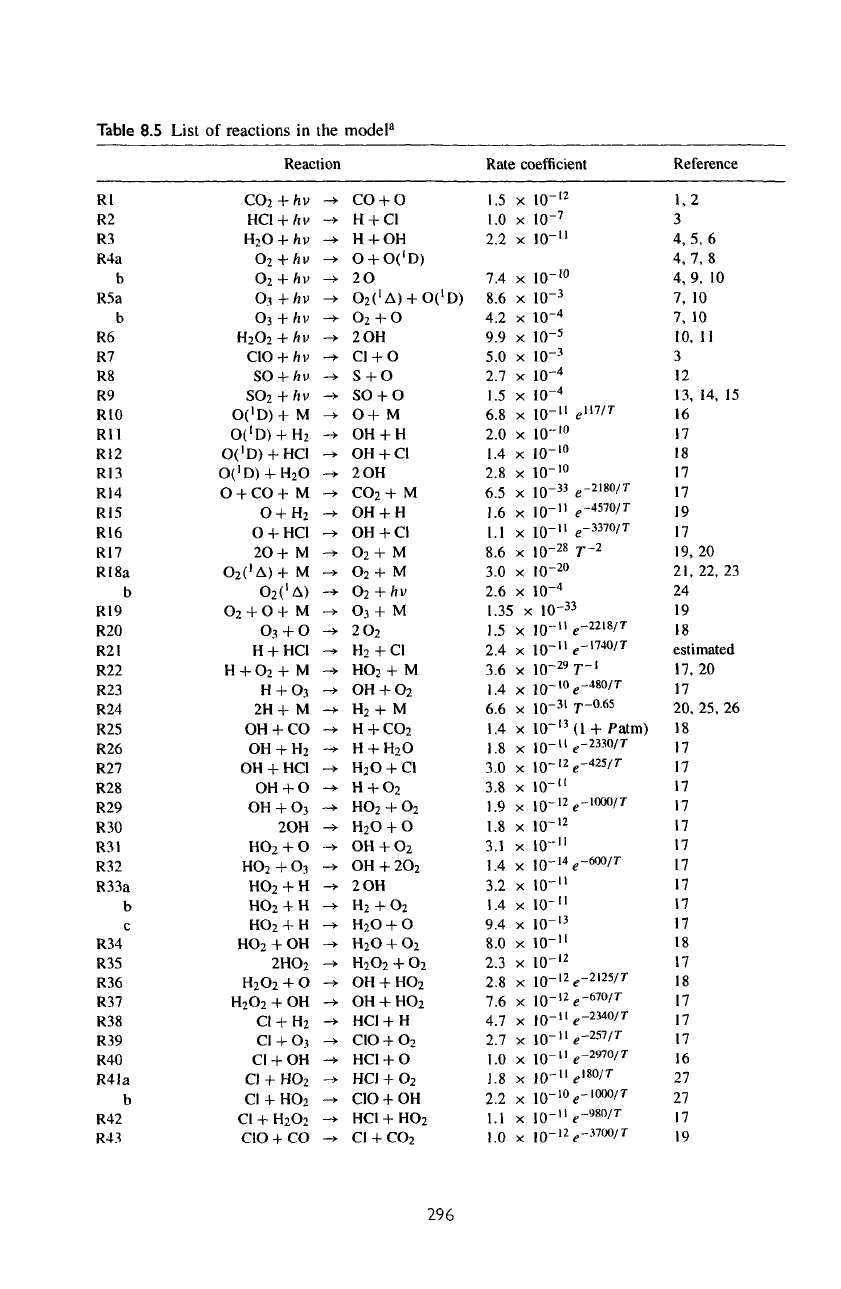
Table
8.5
List
of
reactions
in the
model"
Reaction
Rl
R2
R3
R4a
b
R5a
b
R6
R7
R8
R9
RIO
Rll
R12
R13
R14
R15
R16
R17
R18a
b
R19
R20
R21
R22
R23
R24
R25
R26
R27
R28
R29
R30
R31
R32
R33a
b
c
R34
R35
R36
R37
R38
R39
R40
R41a
b
R42
R43
CO
2
+ hv
HCl
+ hv
H
2
O
+ hv
O
2
+
hv
O
2
+ hv
O
3
+ hv
Os
+ hv
H
2
O
2
+
hv
C\O
+
hv
SO
+
hv
SO
2
+ hv
O('D)+
M
O('D)
+
H
2
O('D)
+ HC1
O('D)
+
H
2
O
O
+ CO + M
0+H
2
O
+ HC1
20+
M
O
2
('A)+
M
0
2
('A)
O
2
+ O + M
0
3
+0
H
+ HC1
H
+
0
2
+ M
H
+ O.1
2H+
M
OH
+ CO
OH
+
H
2
OH
+
HCI
OH+0
OH
+
0
3
2OH
HO
2
+ O
HO
2
+
O
3
HO
2
+H
HO
2
+ H
HO
2
+ H
HO
2
+ OH
2H0
2
H
2
O
2
+ O
H
2
O
2
+ OH
C1
+
H
2
Cl
+
O
3
CI
+ OH
Cl
+
HO
2
Cl
+
H0
2
Cl
+
H
2
0
2
CIO
+ CO
—
»
~>
_».
—
>
_>.
—
>
_>.
_,.
_,.
—
*
—
*
—
>
—
»
—
*
~>
—
>
—
>
—
>•
—
>•
—
»
—
»
_,.
—
>
—
»
—
>
—
>
—
>•
—
»
—>•
—
>
—
*•
—
>
—
>
—
>•
—
>
—
>
—
>
_>.
_>
_>
—
>
—
>
—
>
—
>
—
*
—
>
_>
—
»
->
co + o
H
+ C1
H
+ OH
O
+
O('D)
20
O
2
('A)
+
O('D)
O
2
+ O
2 OH
CI
+ O
S
+ O
SO
+ O
O+ M
OH
+ H
OH
+ CI
2 OH
CO
2
+
M
OH
+ H
OH
+ CI
O
2
+
M
O
2
+ M
O
2
+
hv
Oj+
M
20
2
H
2
+C1
HO
2
+ M
OH
+
O
2
H
2
+
M
H
+
C0
2
H
+
H
2
O
H
2
O
+ Cl
H
+
0
2
HO
2
+
O
2
H
2
O
+ O
OH
+
O
2
OH
+
2O
2
2 OH
H
2
+
0
2
H
2
0
+ O
H
2
O
+
O
2
H
2
0
2
+
0
2
OH
+
HO
2
OH
+
HO
2
HCI
+ H
CIO
+
O
2
HC1
+ O
HCI
+
O
2
CIO
+ OH
HCI
+
HO
2
Cl
+
CO
2
Rate
coefficient
1.5
1.0
2.2
7.4
8.6
4.2
9.9
5.0
2.7
1.5
6.8
2.0
1.4
2.8
6.5
1.6
l.l
8.6
3.0
2.6
1.35
1.5
2.4
3.6
1.4
6.6
1.4
1.8
3.0
3.8
1.9
1.8
3.1
1.4
3.2
1.4
9.4
8.0
2.3
2.8
7.6
4.7
2.7
1.0
1.8
2.2
1.1
1.0
X
X
X
X
X
X
X
X
X
X
X
X
X
X
X
X
X
X
X
X
X
X
X
X
X
X
X
X
X
X
X
X
X
X
X
X
X
X
X
X
X
X
X
X
X
X
X
X
io-
12
io-
7
10-"
,0-10
io-
3
io-
4
io-
5
io--
1
io-
4
io-
4
10-"
,0-10
,0-10
,0-10
io-
33
10-"
10-"
io-
28
10
-20
io-
4
io-
3
10-"
10-"
io-
29
10-
10
io-
31
io-
13
10-"
io-
12
10-"
io-
12
10-
12
10-"
,
0
-14
10-"
10-"
io-'
3
10-"
io-
12
io-'
2
Reference
1,2
3
4,5,
6
4,7,8
4, 9, 10
e"
7
/
7
'
e
-2180/r
e
-4570/r
e
-3370/T
7-
2
3
e
-2218/T
7, 10
7, 10
10, 11
3
12
13,
14,
16
17
18
17
17
19
17
19,20
21,
22,
24
19
18
15
23
e
-
1740/T
estimated
r
-l
e
-480/7-
j—
0.65
(1
+
Patm)
,,-2330/7-
e
-425/7-
e
-iooo/r
e
-600/7-
e
-2!25/r
,
0
-l2
e
-670/7-
10-"
10-"
10-"
io-"
,
0
-10
10-"
io-
12
^-2340/T
e
-257/T
^,-2970/T
^,180/T
£
-1000/T
e
-WO/T
^,-3700/r
17,
20
17
20, 25,
18
17
17
17
17
17
17
17
17
17
17
18
17
18
17
17
17
16
27
27
17
19
26
296
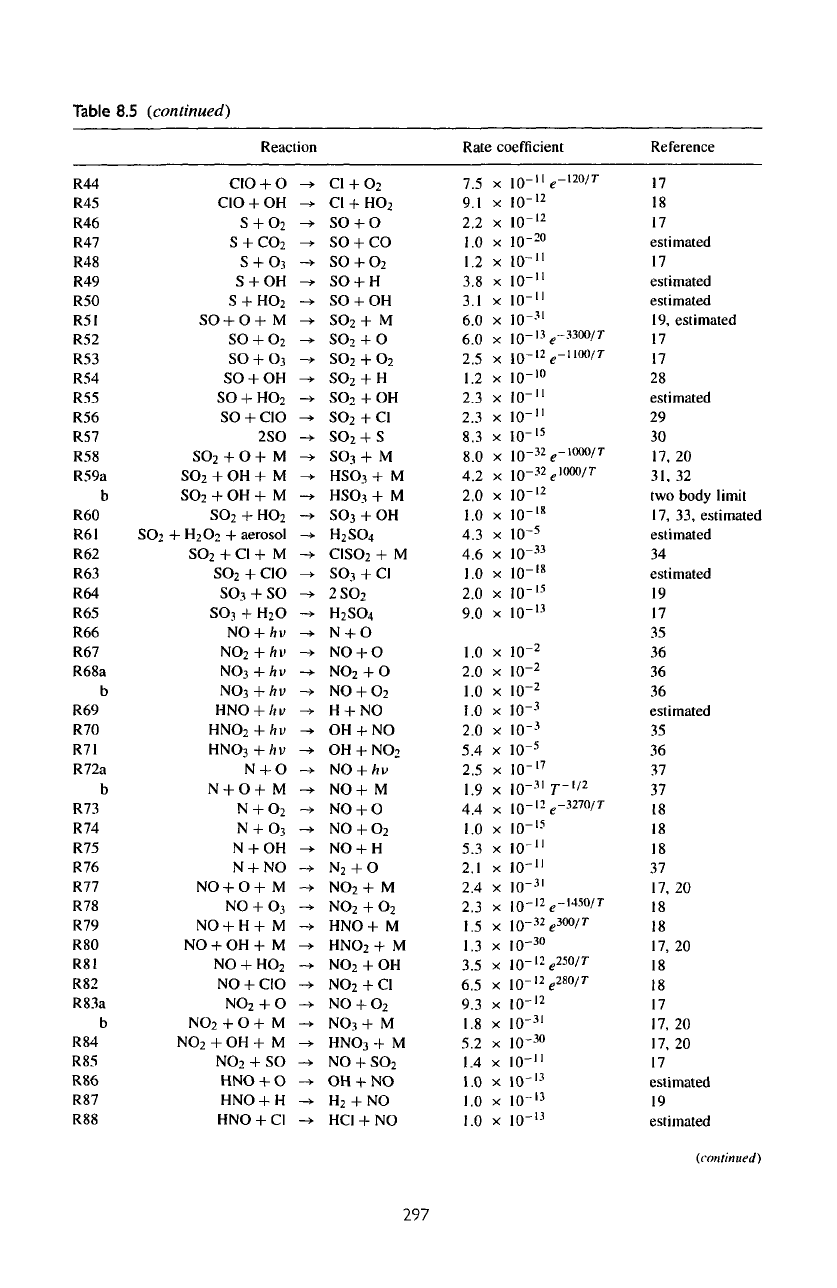
Table
8.5
(continued)
Reaction
R44
R45
R46
R47
R48
R49
R50
RSI
R52
R53
R54
R55
R56
R57
R58
R59a
b
R60
R61
R62
R63
R64
R65
R66
R67
R68a
b
R69
R70
R71
R72a
b
R73
R74
R75
R76
R77
R78
R79
R80
R81
R82
R83a
b
R84
R85
R86
R87
R88
CIO
+ O
CIO
+ OH
S
+
O
2
S
+
C0
2
S
+
O
3
S
+ OH
S
+
HO
2
SO
+ O + M
S0
+
0
2
SO
+
O
3
SO
+ OH
SO
+
HO
2
SO
+
CIO
2SO
SO
2
+ O + M
SO
2
+ OH + M
SO
2
+ OH + M
SO
2
+
HO
2
SOj
+
H
2
O
2
+
aerosol
SO
2
+ Cl + M
SO
2
+ CIO
S0
3
+ SO
SO,
+
H
2
O
NO
+
hv
NO
2
+
hv
NO,
+
hv
NO
3
+
h
v
HNO
+ hv
HNO
2
+ hv
HNO
3
+/iv
N
+ O
N
+ O+ M
N
+
O
2
N
+
0
3
N
+ OH
N
+ NO
NO
+ O + M
NO
+
O
3
NO
+ H + M
NO
+ OH + M
NO
+
HO
2
NO
+ CIO
NO
2
+ O
NO
2
+ O + M
NO
2
+ OH + M
NO
2
+ SO
HNO
+ O
HNO
+ H
HNO
+ Cl
_,
-,.
-».
->
_».
-j.
_>
-».
_».
_>.
->
-»
_»
-*
->
->
->
->
->
—
>
->
->
-*
_».
_>
->
_>
_».
_>
_»
_>
—
>•
_>
_»
_,.
—
>
->.
->
_».
—
»
-*
—
>
->
-*
-».
->
->
->
-»
C1
+
O
2
Cl
+
HO
2
SO
+ O
so + co
SO
+
O
2
SO
+ H
SO
+ OH
SO
2
+
M
SO
2
+ O
SO
2
+
O
2
SO
2
+ H
SO
2
+ OH
SO
2
+ Cl
SO
2
+ S
SO
3
+ M
HSO
3
+ M
HSOj
+ M
SO
3
+ OH
H
2
SO
4
CISO
2
+ M
SO}
+ Cl
2S0
2
H
2
SO
4
N
+ O
NO
+ O
NO
2
+ O
NO
+
O
2
H
+ NO
OH
+ NO
OH
+
NO
2
NO
+ ftf
NO+
M
NO
+ O
NO
+
O
2
NO
+ H
N
2
+O
NO
2
+
M
NO
2
+
O
2
HNO+
M
HNO
2
+ M
NO
2
+ OH
N0
2
+ Cl
NO
+
O
2
NO
3
+ M
HNO
3
+ M
NO
+
SO
2
OH
+ NO
H
2
+ NO
HCI
+ NO
Rate
7.5
9.1
2.2
1.0
1.2
3.8
3.1
6.0
6.0
2.5
1.2
2.3
2.3
8.3
8.0
4.2
2.0
1.0
4.3
4.6
1.0
2.0
9.0
1.0
2.0
1.0
1.0
2.0
5.4
2.5
1.9
4.4
1.0
5.3
2.1
2.4
2.3
1.5
1.3
3.5
6.5
9.3
1.8
5.2
1.4
1.0
1.0
1.0
coefficient
X
X
X
X
X
X
X
X
X
X
X
X
X
X
X
X
X
X
X
X
X
X
X
X
X
X
X
X
X
X
X
X
X
X
X
X
X
X
X
X
X
X
X
X
X
X
X
X
10
-n
e
-i20/r
io-
12
io-
12
io-
20
io-"
10-"
10-"
io--
11
,0-13^3300/7-
10
-
12^-1
100/7-
,0-10
10-"
10-"
10-
'
5
,
Q-32
?
-
1000/7-
jQ-32
e
!000/r
io-
12
,
0
-18
io-
5
,0-33
,
0
-I8
10-
"
io-
13
io-
2
io-
2
io-
2
io-
1
io--
1
IO-
5
io-
17
10-317-1/2
,
0
-l2
e
-3270/r
io-
15
10-"
10-"
io-
31
10
-l2
g
-l450/r
,0-32^300/r
,0-30
10
-l2
e
250/r
,0-12,280/7-
io-
12
io-
11
,0-30
io-"
io-
13
10~
13
io-'-
1
Reference
17
18
17
estimated
17
estimated
estimated
19,
estimated
17
17
28
estimated
29
30
17,20
31,
32
two
body
limit
17,
33,
estimated
estimated
34
estimated
19
17
35
36
36
36
estimated
35
36
37
37
18
18
18
37
17,
20
18
18
17,
20
18
18
17
17,
20
17,
20
17
estimated
19
estimated
(continued)
297
298
Photochemistry
of
Planetary
Atmospheres
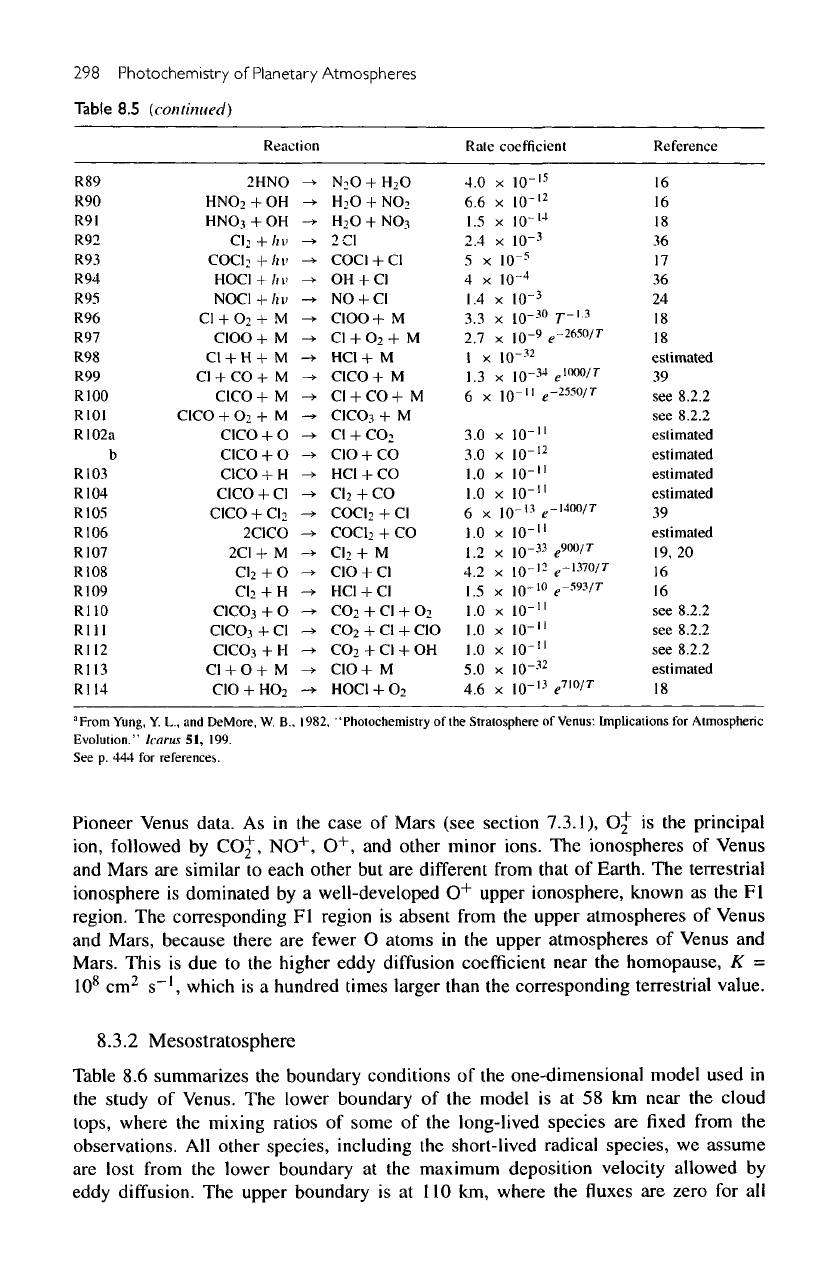
Table
8.5
(continued)
R89
R90
R91
R92
R93
R94
R95
R96
R97
R98
R99
R100
R101
R102a
b
R103
R104
R105
R106
R107
RI08
R109
R110
Rill
R112
R113
R114
Reaction
2HNO
-^
HNO
2
+ OH
->
HNO
3
+ OH
->
CI
2
+/n>
->
COCI
2
+/ii'
->•
HOC1
+
/H'
->
NOC1+/ID
->
Cl
+
O
2
+ M
->
CIOO
+ M
->
Cl
+ H + M
->
Cl
+ CO + M
->
CICO
+ M
->
CICO
+
O
2
+ M
->
C1CO
+ O
-s-
C1CO
+ 0
-*
C1CO
+ H
->
CICO
+
Cl
->
CICO
+
CI
2
->
2C1CO
->
2CI
+ M
-*
CI
2
+ O
-»
CI
2
+ H
->
CICO
3
+ O
-»•
CICO
3
+ Cl
->
C1CO
3
+ H
->
Cl
+ O + M
-»
CIO
+
H0
2
-»
N
2
O+H
2
O
H
2
O
+
NO
2
H
2
O
+
NO
3
2C1
COC1
+ Cl
OH
+
CI
NO
+
CI
CIOO+
M
Cl
+
O
2
+ M
HCI
+ M
C1CO+
M
Cl
+ CO + M
CICOj
+ M
Cl
+
CO
;
CIO
+ CO
HCI
+ CO
CI
2
+ CO
COCI
2
+ Cl
COC1
2
+ CO
CI
2
+
M
CIO
+ Cl
HCI
+ Cl
CO
2
+ Cl +
O
2
CO
2
+ Cl +
CIO
CO
2
+ Cl + OH
C1O+
M
HOC1
+
O
2
Rale
coefficient
4.0
x
10"
"
6.6 x
10-
12
1.5
x
10"
l4
2.4
x
10"
3
5 x
10~
5
4 x
1Q-
4
1.4
x
10~
3
3.3
x
10"
30
7-'-
3
2.7
x
10-'
f
-2650/r
1
x
10"
32
1.3
x
10--
14
e"
m
'
T
6
x
10-"
e-^o/r
3.0
x
10-"
3.0 x
10-
12
1.0
x
10-"
1.0
x
10-"
6
x
1Q-'
3
f-
|400
/
r
1.0
x
10-"
1.2
x
10--"
e
900
'
7
4.2
x
10-
12
e
-
im
'
T
1.5
x
10"
10
f-
59
-
1
/
7
"
1.0
x
10-"
1.0
x
10-"
1.0
x
10-"
5.0 x
10--
12
4.6
x
10"
13
i
w
'
T
Reference
16
16
18
36
17
36
24
18
18
estimated
39
see
8.2.2
see
8.2.2
estimated
estimated
estimated
estimated
39
estimated
19,
20
16
16
see
8.2.2
see
8.2.2
see
8.2.2
estimated
18
1
From
Yung,
Y
L.,
and
DeMore,
W.
B.,
1982,
"Photochemistry
of
the
Stratosphere
of
Venus'.
Implications
for
Atmospheric
Evolution."
Icarus
51,
199.
See p. 444 for
references.
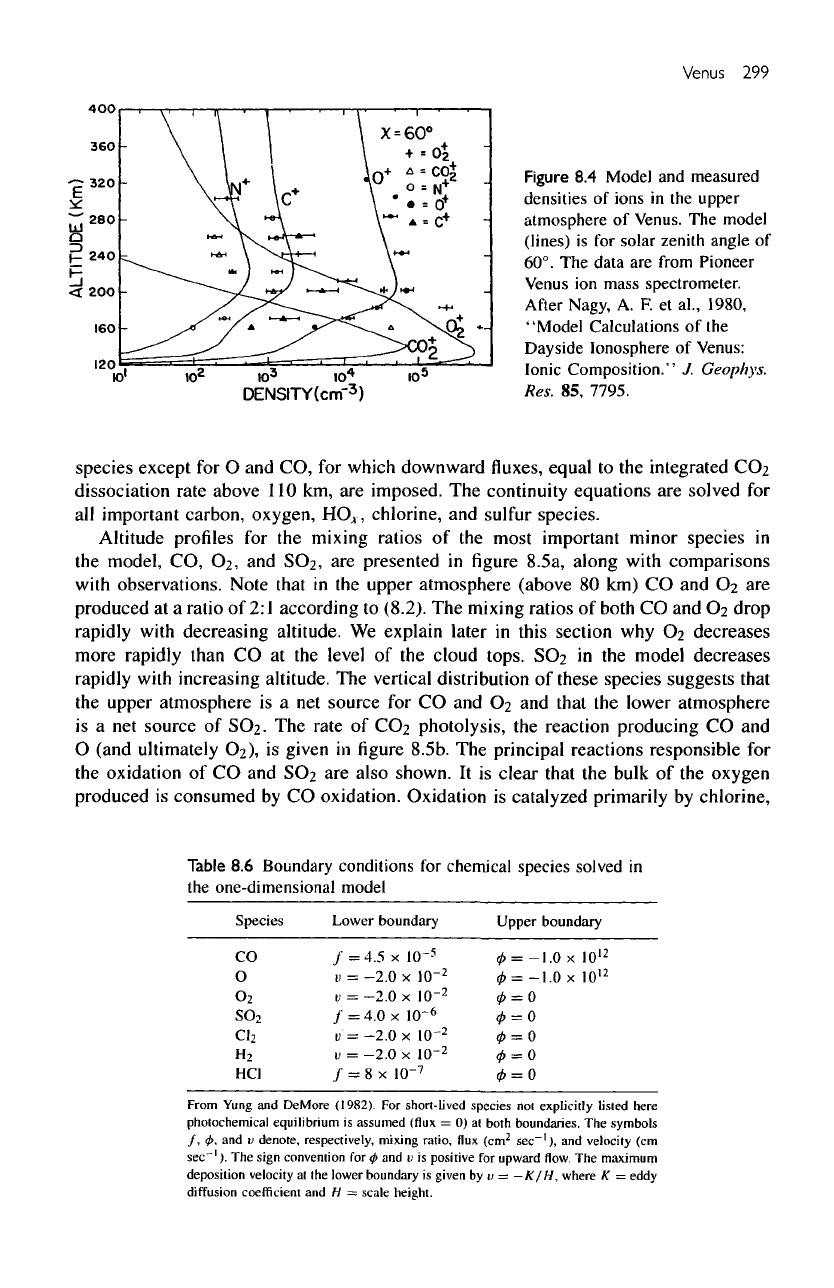
Pioneer
Venus data.
As in the
case
of
Mars (see section
7.3.1),
Oj
is the
principal
ion,
followed
by
COj,
NO
+
,
O
+
,
and
other minor ions.
The
ionospheres
of
Venus
and
Mars
are
similar
to
each other
but are
different
from
that
of
Earth.
The
terrestrial
ionosphere
is
dominated
by a
well-developed
O
+
upper ionosphere, known
as the
Fl
region.
The
corresponding
Fl
region
is
absent
from
the
upper atmospheres
of
Venus
and
Mars, because there
are
fewer
O
atoms
in the
upper atmospheres
of
Venus
and
Mars. This
is due to the
higher eddy
diffusion
coefficient
near
the
homopause,
K =
10
8
cm
2
s~',
which
is a
hundred times larger than
the
corresponding terrestrial value.
8.3.2
Mesostratosphere
Table
8.6
summarizes
the
boundary conditions
of the
one-dimensional model used
in
the
study
of
Venus.
The
lower boundary
of the
model
is at 58 km
near
the
cloud
tops,
where
the
mixing
ratios
of
some
of the
long-lived species
are fixed
from
the
observations.
All
other species,
including
the
short-lived radical species,
we
assume
are
lost
from
the
lower
boundary
at the
maximum
deposition velocity allowed
by
eddy
diffusion.
The
upper boundary
is at
110
km,
where
the fluxes are
zero
for all
Venus
299
Figure
8.4
Mode)
and
measured
densities
of
ions
in the
upper
atmosphere
of
Venus.
The
model
(lines)
is for
solar
zenith
angle
of
60°.
The
data
are
from Pioneer
Venus
ion
mass
spectrometer.
After
Nagy,
A. F.
el
al.,
1980,
"Model
Calculations
of the
Dayside Ionosphere
of
Venus:
Ionic
Composition."
J.
Geophys.
Res.
85,
7795.
species except
for O and CO, for
which downward
fluxes,
equal
to the
integrated
CO2
dissociation
rate above
110
km, are
imposed.
The
continuity
equations
are
solved
for
all
important
carbon, oxygen,
HCV,,
chlorine,
and
sulfur
species.
Altitude
profiles
for the
mixing
ratios
of the
most important minor species
in
the
model,
CO, O2, and
SO2,
are
presented
in figure
8.5a, along
with
comparisons
with
observations. Note
that
in the
upper atmosphere (above
80 km) CO and
©2
are
produced
at a
ratio
of
2:1
according
to
(8.2).
The
mixing
ratios
of
both
CO and
©2
drop
rapidly
with
decreasing altitude.
We
explain later
in
this section
why O2
decreases
more rapidly
than
CO at the
level
of the
cloud tops.
SO2 in the
model
decreases
rapidly
with
increasing
altitude.
The
vertical distribution
of
these species suggests that
the
upper atmosphere
is a net
source
for CO and 02 and
that
the
lower atmosphere
is
a net
source
of
SO2.
The
rate
of CO2
photolysis,
the
reaction producing
CO and
O
(and
ultimately
©2),
is
given
in figure
8.5b.
The
principal reactions responsible
for
the
oxidation
of CO and SO2 are
also shown.
It is
clear
that
the
bulk
of the
oxygen
produced
is
consumed
by CO
oxidation. Oxidation
is
catalyzed primarily
by
chlorine,
Table
8.6
Boundary conditions
for
chemical
species
solved
in
the
one-dimensional model
Species
CO
O
0
2
SO
2
C1
2
H
2
HC1
Lower
boundary
/
=
4.5
x
I(T
5
v
=
-2.0
x
10~
2
D
=
-2.0x
10-
2
/
=
4.0x
1(T
6
u'=
-2.0
x
10-
2
u
=
-2.0x
10~
2
/ = 8 x
10~
7
Upper
0
= -
«
= -
0
= 0
0
= 0
0
= 0
0
= 0
0 = 0
boundary
1.0
x
10
12
1.0
x
10
12
From
Yung
and
DeMore
(1982).
For
short-lived species
noi
explicitly
lisled
here
photochemical
equilibrium
is
assumed
(flux
= 0) at
both boundaries.
The
symbols
/,
<£,
and
u
denote,
respectively,
mixing
ratio,
flux
(cm
2
sec"
1
),
and
velocity
(cm
sec"
1
).
The
sign
convention
for
0
and
i;
is
positive
for
upward
flow. The
maximum
deposition
velocity
at the
lower
boundary
is
given
by
i;
=
—K/H,
where
K
=
eddy
diffusion
coefficient
and H
~
scale height.
300
Photochemistry
of
Planetary Atmospheres
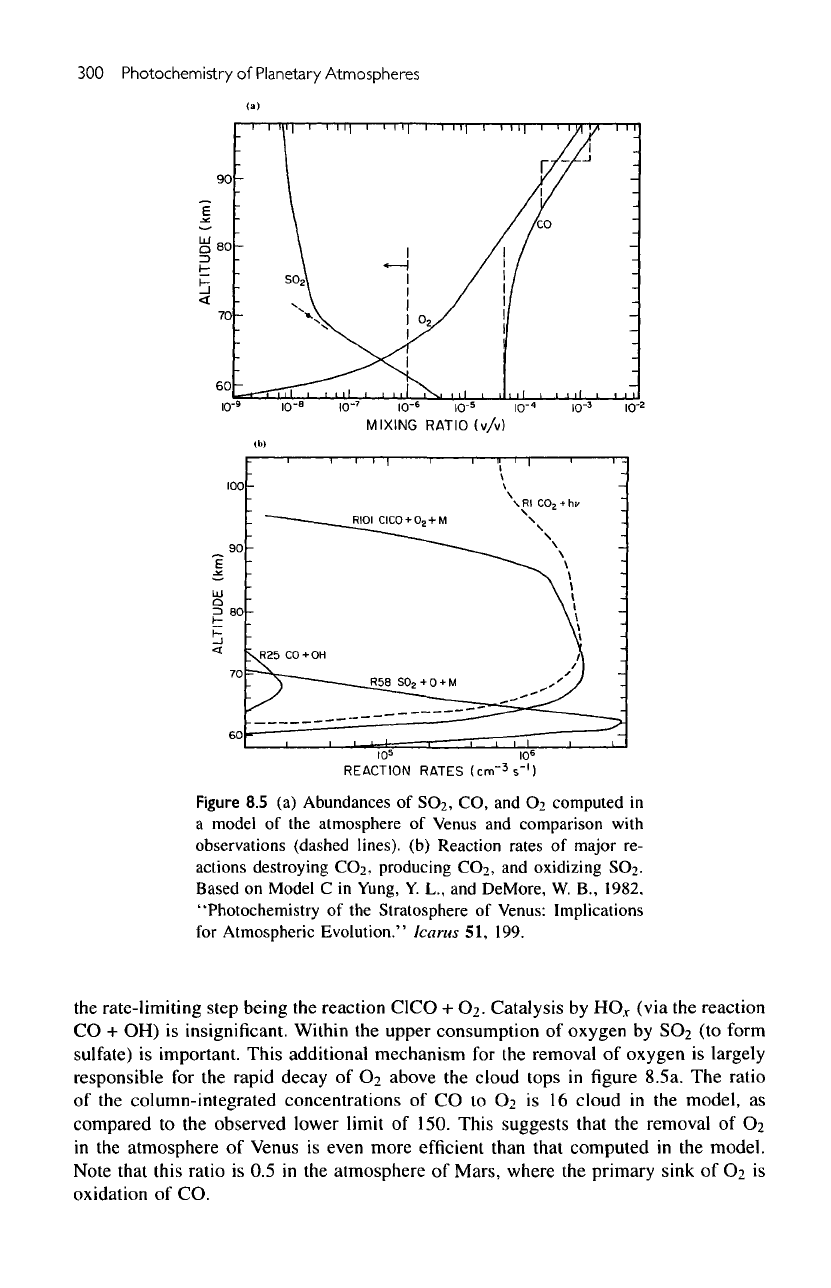
Figure
8.5 (a)
Abundances
of
SOz,
CO, and
Oi
computed
in
a
model
of the
atmosphere
of
Venus
and
comparison with
observations (dashed
lines),
(b)
Reaction rates
of
major
re-
actions destroying
CC>2,
producing
COi,
and
oxidizing
SO2.
Based
on
Model
C in
Yung,
Y. L., and
DeMore,
W.
B.,
1982,
"Photochemistry
of the
Stratosphere
of
Venus: Implications
for
Atmospheric
Evolution."
Icarus
51,
199.
the
rate-limiting step being
the
reaction
C1CO
+
O?.
Catalysis
by
HO.
V
(via
the
reaction
CO + OH) is
insignificant.
Within
the
upper consumption
of
oxygen
by SO2 (to
form
sulfate)
is
important. This additional mechanism
for the
removal
of
oxygen
is
largely
responsible
for the
rapid decay
of O2
above
the
cloud tops
in
figure
8.5a.
The
ratio
of the
column-integrated concentrations
of CO
to
O2 is 16
cloud
in the
model,
as
compared
to the
observed lower
limit
of
150.
This suggests that
the
removal
of 02
in
the
atmosphere
of
Venus
is
even more
efficient
than that computed
in the
model.
Note that
this
ratio
is 0.5 in the
atmosphere
of
Mars, where
the
primary sink
of O2 is
oxidation
of CO.
Venus
301
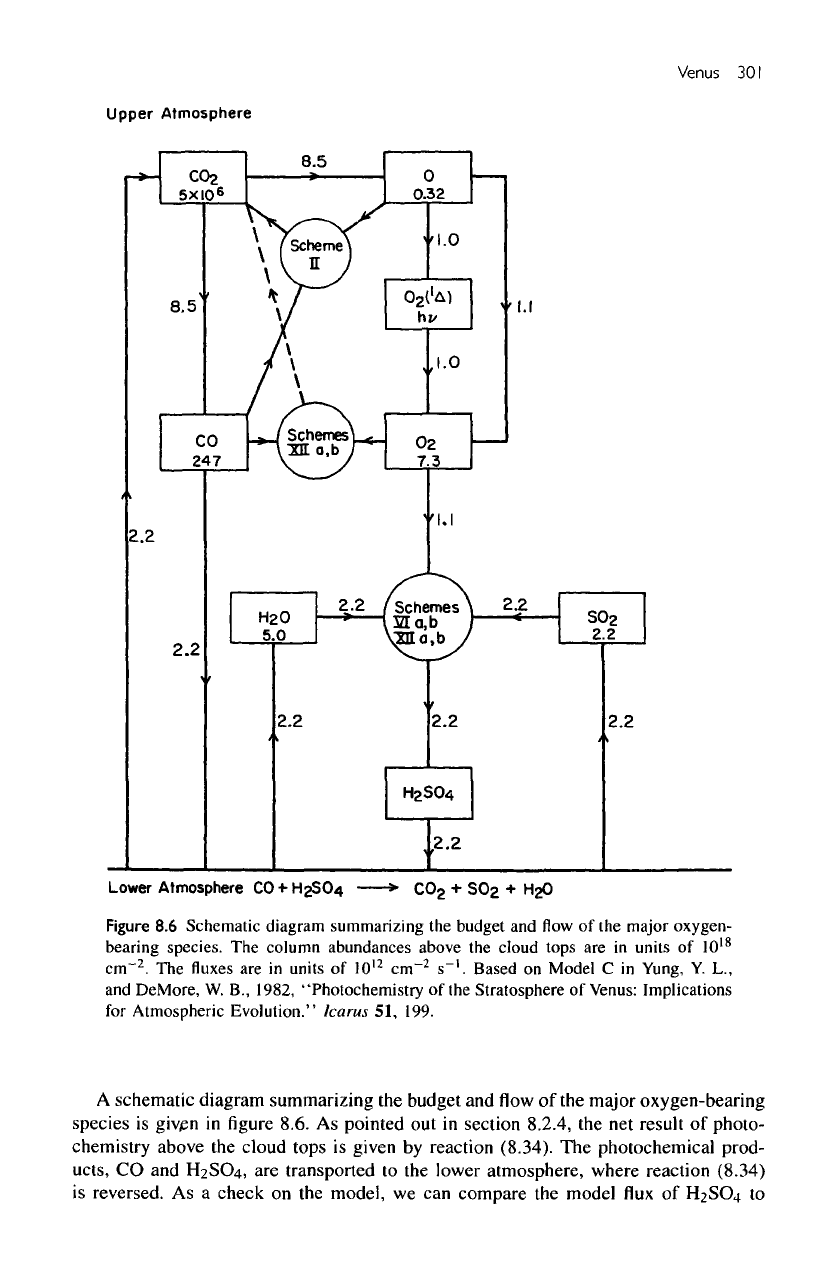
Figure
8.6
Schematic
diagram
summarizing
the
budget
and flow of the
major
oxygen-
bearing
species.
The
column
abundances
above
the
cloud
tops
are in
units
of
10
18
cm""
2
.
The fluxes are in
units
of
I0
12
crrT
2
s~'.
Based
on
Model
C in
Yung,
Y. L.,
and
DeMore,
W. B.,
1982,
"Photochemistry
of the
Stratosphere
of
Venus:
Implications
for
Atmospheric
Evolution."
Icarus
51,
199.
A
schematic diagram summarizing
the
budget
and flow of the
major oxygen-bearing
species
is
giv/en
in figure
8.6.
As
pointed
out in
section 8.2.4,
the net
result
of
photo-
chemistry
above
the
cloud tops
is
given
by
reaction
(8.34).
The
photochemical prod-
ucts,
CO and
H2SO4,
are
transported
to the
lower atmosphere, where reaction
(8.34)
is
reversed.
As a
check
on the
model,
we can
compare
the
model
flux of
H2SO4
to
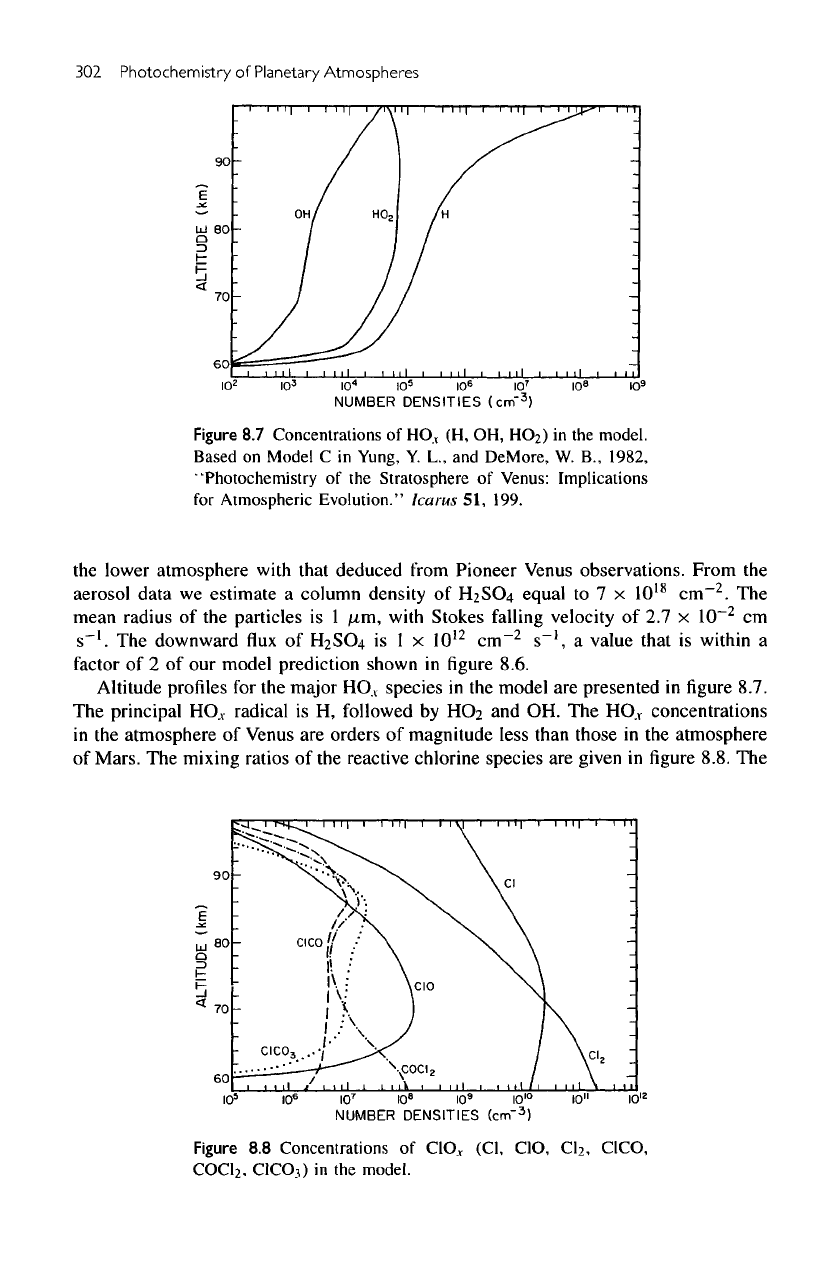
302
Photochemistry
of
Planetary Atmospheres
Figure
8.7
Concentrations
of
HO
X
(H, OH,
HO
2
)
in the
model.
Based
on
Model
C in
Yung,
Y. L., and
DeMore,
W. B.,
1982,
"Photochemistry
of the
Stratosphere
of
Venus: Implications
for
Atmospheric Evolution." Icarus
51,
199.
the
lower atmosphere
with
that deduced from Pioneer Venus observations.
From
the
aerosol data
we
estimate
a
column density
of
H2SO4 equal
to 7 x
IO
18
cm~
2
.
The
mean radius
of the
particles
is 1
/Mm,
with Stokes
falling
velocity
of 2.7 x
10~
2
cm
s~'.
The
downward
flux of
H2SO4
is 1 x
IO
12
cm~
2
s~',
a
value that
is
within
a
factor
of 2 of our
model prediction shown
in
figure
8.6.
Altitude
profiles
for the
major
HO
A
species
in the
model
are
presented
in figure
8.7.
The
principal
HO.
V
radical
is H,
followed
by
HO:
and OH. The
HO.,
concentrations
in
the
atmosphere
of
Venus
are
orders
of
magnitude
less
than those
in the
atmosphere
of
Mars.
The
mixing ratios
of the
reactive chlorine
species
are
given
in figure
8.8.
The
Figure
8.8
Concentrations
of
ClO.
r
(Cl,
CIO,
C1
2
,
C1CO,
COC1
2
,
ClCOj)
in the
model.
Venus
303
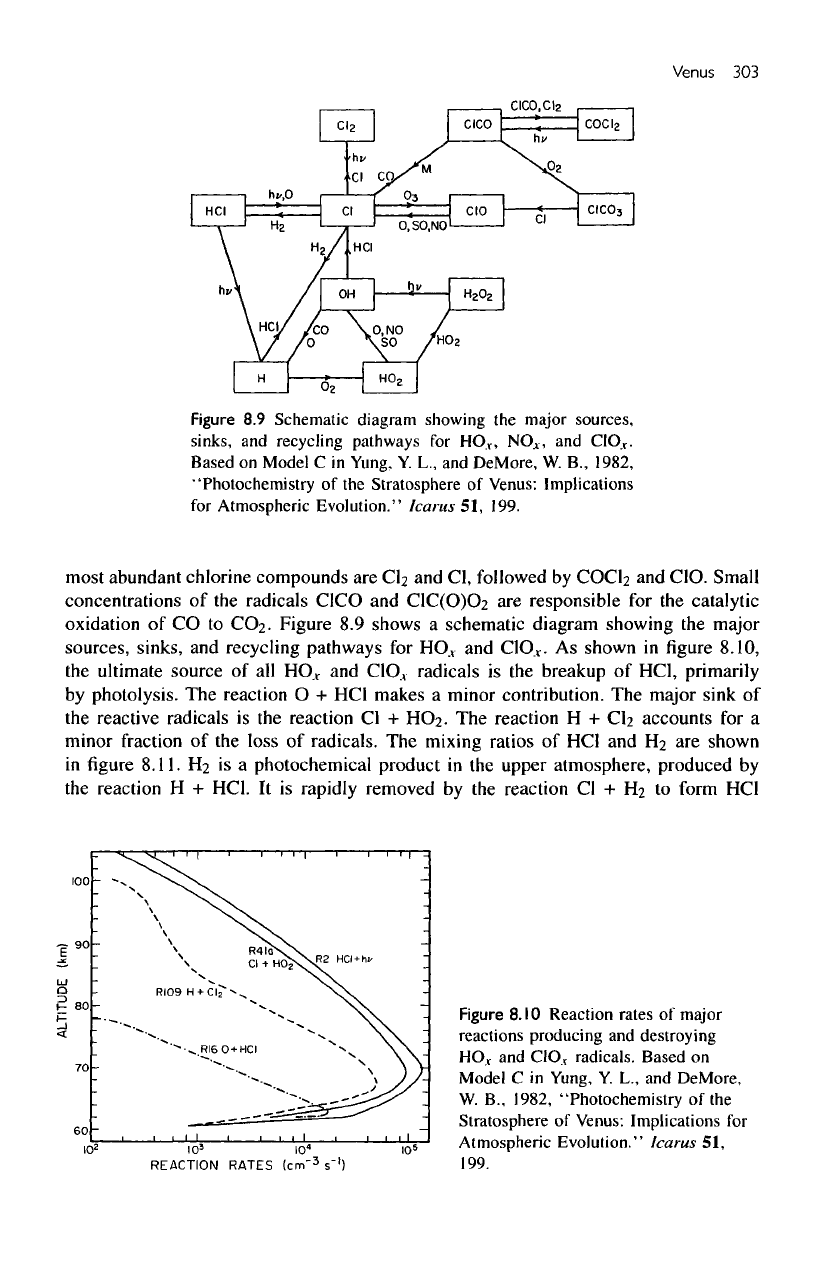
Figure
8.9
Schematic diagram showing
the
major
sources,
sinks,
and
recycling pathways
for
HO
V
,
NO*,
and
C1O
V
.
Based
on
Model
C in
Yung,
Y. L., and
DeMore,
W. B.,
1982,
"Photochemistry
of the
Stratosphere
of
Venus: Implications
for
Atmospheric
Evolution."
Icarus
51,
199.
most abundant chlorine compounds
are Cl2 and
Cl,
followed
by
COCb
and
CIO.
Small
concentrations
of the
radicals
CICO
and
C1C(O)O2
are
responsible
for the
catalytic
oxidation
of CO to
CO2. Figure
8.9
shows
a
schematic diagram showing
the
major
sources, sinks,
and
recycling pathways
for
HO.,
and
ClO
t
.
As
shown
in figure
8.10,
the
ultimate
source
of all
HO
r
and
CIO.,
radicals
is the
breakup
of
HC1, primarily
by
photolysis.
The
reaction
O + HC1
makes
a
minor contribution.
The
major
sink
of
the
reactive radicals
is the
reaction
Cl +
HO2-
The
reaction
H + C\2
accounts
for a
minor
fraction
of the
loss
of
radicals.
The
mixing
ratios
of HO and H2 are
shown
in
figure
8.11.
H2 is a
photochemical product
in the
upper atmosphere, produced
by
the
reaction
H +
HC1.
It is
rapidly removed
by the
reaction
Cl + H2 to
form
HC1
Figure
8.10
Reaction
rates
of
major
reactions producing
and
destroying
HO
V
and
C1O
V
radicals.
Based
on
Model
C in
Yung,
Y.
L.,
and
DeMore,
W.
B.,
1982,
"Photochemistry
of the
Stratosphere
of
Venus: Implications
for
Atmospheric Evolution."
Icarus
51,
199.
304
Photochemistry
of
Planetary
Atmospheres
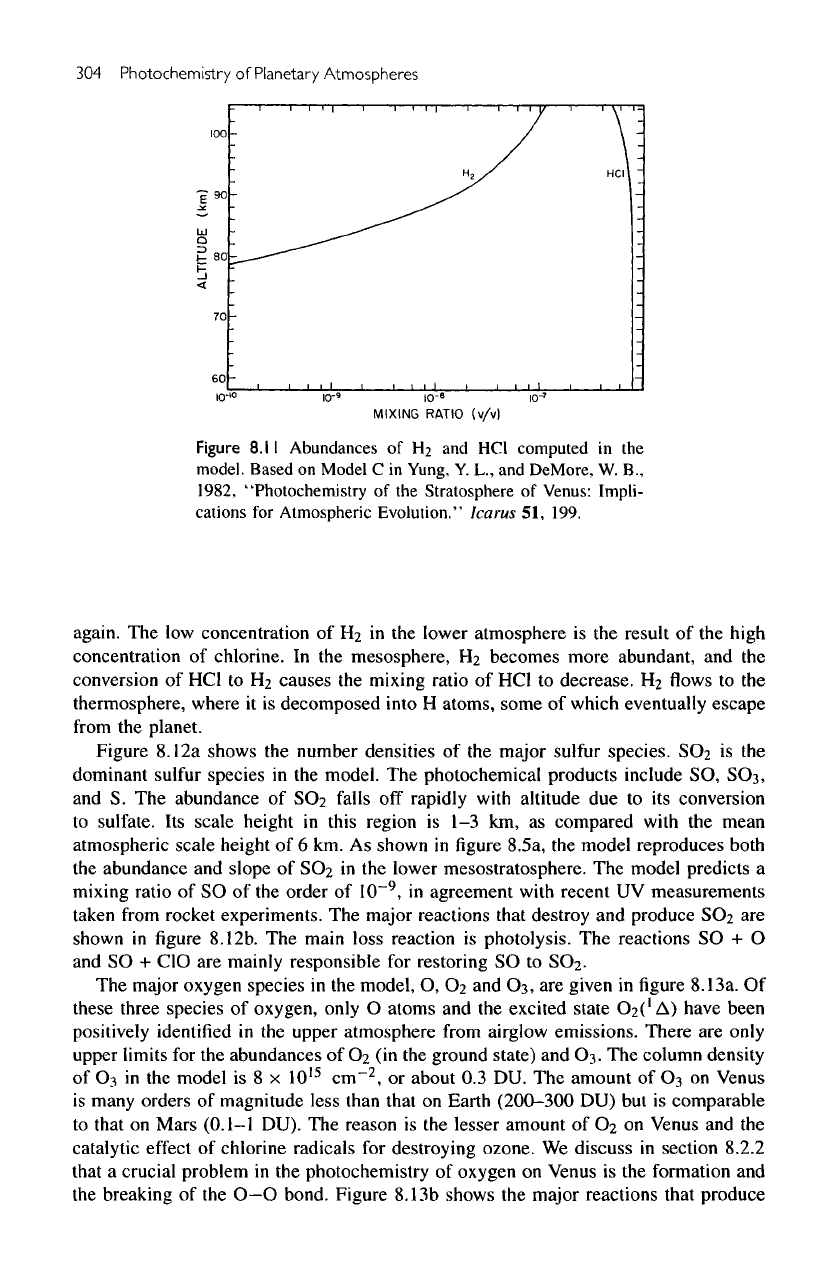
Figure
8.11
Abundances
of H2 and HC1
computed
in the
model.
Based
on
Model
C in
Yung,
Y. L., and
DeMore,
W. B.,
1982, "Photochemistry
of the
Stratosphere
of
Venus: Impli-
cations
for
Atmospheric
Evolution."
Icarus
51,
199.
again.
The low
concentration
of H2 in the
lower atmosphere
is the
result
of the
high
concentration
of
chlorine.
In the
mesosphere,
H2
becomes more abundant,
and the
conversion
of HC1 to H2
causes
the
mixing
ratio
of HC1 to
decrease.
Ha
flows to the
thermosphere,
where
it is
decomposed into
H
atoms, some
of
which eventually
escape
from
the
planet.
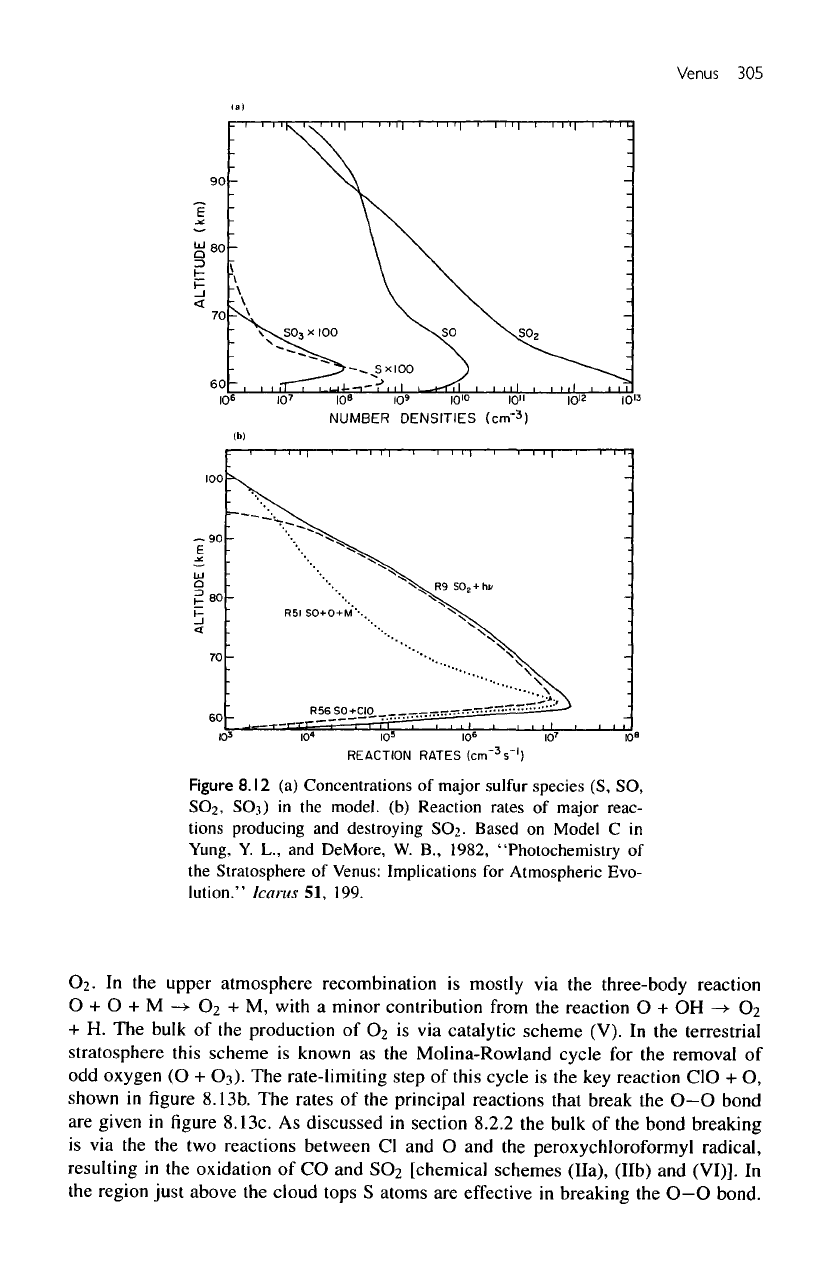
Figure
8.12a
shows
the
number densities
of the
major
sulfur
species.
SO2 is the
dominant
sulfur
species
in the
model.
The
photochemical products include
SO,
SQ^,
and S. The
abundance
of
SC>2
falls
off
rapidly
with
altitude
due to its
conversion
to
sulfate.
Its
scale
height
in
this region
is 1-3 km, as
compared with
the
mean
atmospheric
scale
height
of 6 km. As
shown
in figure
8.5a,
the
model reproduces both
the
abundance
and
slope
of
SC>2
in the
lower mesostratosphere.
The
model predicts
a
mixing
ratio
of SO of the
order
of
10~
9
,
in
agreement
with
recent
UV
measurements
taken
from rocket experiments.
The
major reactions that destroy
and
produce
SO2 are
shown
in figure
8.12b.
The
main loss reaction
is
photolysis.
The
reactions
SO + O
and
SO +
CIO
are
mainly
responsible
for
restoring
SO to
SO2-
The
major oxygen
species
in the
model,
O, O2 and
Os,
are
given
in figure
8.13a.
Of
these three species
of
oxygen,
only
O
atoms
and the
excited state
O2('A)
have been
positively
identified
in the
upper atmosphere from airglow emissions. There
are
only
upper
limits
for the
abundances
of O2 (in the
ground state)
and 03. The
column density
of
Os
in the
model
is 8 x
10
15
cm~
2
,
or
about
0.3 DU. The
amount
of
O^
on
Venus
is
many orders
of
magnitude less
than
that
on
Earth
(200-300
DU) but is
comparable
to
that
on
Mars
(0.1-1
DU).
The
reason
is the
lesser amount
of O2 on
Venus
and the
catalytic
effect
of
chlorine radicals
for
destroying ozone.
We
discuss
in
section
8.2.2
that
a
crucial problem
in the
photochemistry
of
oxygen
on
Venus
is the
formation
and
the
breaking
of the
O—O
bond. Figure
8.13b
shows
the
major reactions that produce
Venus
305
Figure
8.12
(a)
Concentrations
of
major
sulfur
species
(S, SO,
SO2,
SO.i)
in the
model,
(b)
Reaction rates
of
major
reac-
tions
producing
and
destroying
SOi.
Based
on
Model
C in
Yung,
Y. L., and
DeMore,
W.
B.,
1982,
"Photochemistry
of
the
Stratosphere
of
Venus: Implications
for
Atmospheric Evo-
lution."
Icarus
51,
199.
O2.
In the
upper atmosphere recombination
is
mostly
via the
three-body reaction
O + O +
M—>-C>2+M,
with
a
minor contribution from
the
reaction
O + OH
—>•
C>2
+ H. The
bulk
of the
production
of
O
2
is via
catalytic scheme (V).
In the
terrestrial
stratosphere
this
scheme
is
known
as the
Molina-Rowland cycle
for the
removal
of
odd
oxygen
(O +
O
3
).
The
rate-limiting
step
of
this cycle
is the key
reaction
CIO
+ O,
shown
in figure
8.13b.
The
rates
of the
principal reactions that break
the
O—O
bond
are
given
in figure
8.13c.
As
discussed
in
section 8.2.2
the
bulk
of the
bond breaking
is
via the the two
reactions between
Cl
and O and the
peroxychloroformyl radical,
resulting
in the
oxidation
of CO and
SO
2
[chemical schemes
(Ila),
(lib)
and
(VI)].
In
the
region just above
the
cloud tops
S
atoms
are
effective
in
breaking
the O-O
bond.