Water and Wastewater Engineering
Подождите немного. Документ загружается.

2-10 WATER AND WASTEWATER ENGINEERING
Example 2-1. Perform a complete series analysis on the Troublesome Creek data in Table 2-7 .
Determine the mean monthly d ischarge. If the average demand for Nosleep’s municipal sup-
ply is 0.25 m
3
/ s, and the regulatory agency will permit a withdrawal of 5% of the flow, will the
Troublesome Creek provide a safe yield?
Solution. A spreadsheet was used to perform the calculations and plot the duration curve. The
first few values in the spreadsheet are shown below. A sample calculation for the spreadsheet is
shown below the spreadsheet.
Rank Monthly discharge, m
3
/s % of time equaled or exceeded
1 69.1 0.38
2 59.8 0.76
356.6 1.14
4 47.4 1.52
5 45.1 1.89
6 41.1 2.27
7 40.8 2.65
There are 264 values in the table (12 months/year 22 years of data). The highest discharge
in the table is 69.1 m
3
/ s. It is assigned a rank of 1.
The percent of time this value is equaled or exceeded is:
%%%of time
1
264
100 0 38().
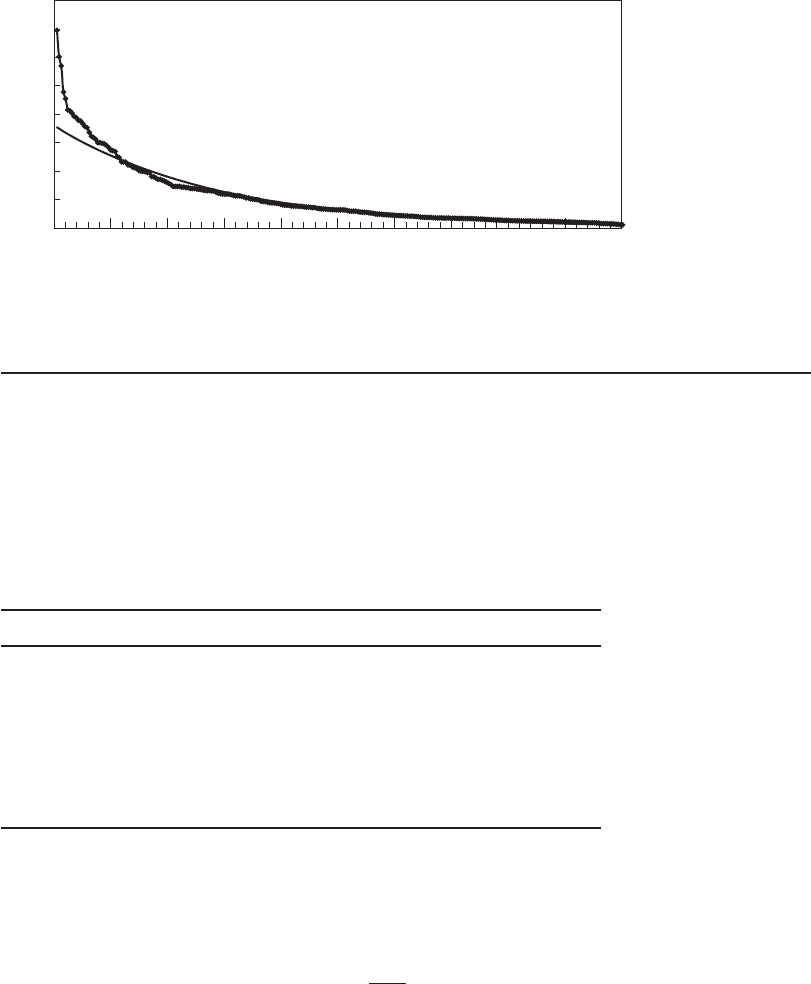
The plot of the duration curve is shown in Figure 2-3 . From the data sort, find that the flow rate
that is exceeded 50% of the time is 5.98 m
3
/ s.
0
10
20
30
40
50
60
70
80
0 20406080100
Percent of time equaled or exceeded
Monthly discharge, m
3
/s
Trendline equation: y = 35.494e
0.0352x
FIGURE 2-3
Complete series analysis for Troublesome Creek at Nosleep.

2-11
TABLE 2-7
Average monthly discharge of Troublesome Creek at Nosleep, m
3
/S
Year Jan Feb Mar Apr May JunJulAug Sep Oct Nov Dec
1987 2.92 5.10 1.95 4.42 3.31 2.24 1.05 0.74 1.02 1.08 3.09 7.62
1988 24.3 16.7 11.5 17.2 12.6 7.28 7.53 3.03 10.2 10.9 17.6 16.7
1989 15.3 13.3 14.2 36.3 13.53.62 1.93 1.83 1.933.29 5.98 12.7
1990 11.5 4.81 8.61 27.0 4.19 2.07 1.15 2.04 2.04 2.10 3.12 2.97
1991 11.1 7.90 41.1 6.77 8.27 4.76 2.78 1.70 1.46 1.44 4.02 4.45
1992 2.92 5.10 28.7 12.2 7.22 1.98 0.91 0.67 1.33 2.38 2.69 3.03
1993 7.14 10.7 9.63 21.1 10.2 5.133.03 10.9 3.12 2.61 3.00 3.82
1994 7.36 47.4 29.4 14.0 14.2 4.96 2.29 1.70 1.5
61.56 2.04 2.35
1995 2.89 9.57 17.7 16.4 6.833.74 1.60 1.13 1.13 1.42 1.98 2.12
1996 1.78 1.95 7.25 24.7 6.26 8.92 3.57 1.98 1.953.09 3.94 12.7
1997 13.8 6.91 12.9 11.33.74 1.98 1.33 1.16 0.85 2.63 6.49 5.52
1998 4.56 8.47 59.8 9.80 6.06 5.32 2.14 1.98 2.17 3.40 8.44 11.5
1999 13.8 29.6 38.8 13.537.2 22.8 6.94 3.94 2.92 2.89 6.74 3.09
2000 2.5113.1 27.9 22.9 16.1 9.77 2.44 1.42 1.56 1.83 2.58 2.27
2001 1.61 4.08 14.0 12.8 33.2 22.8 5.49 4.255.98 19.6 8.50 6.09
2002 21.8 8.21 45.1 6.43 6.15 10.53.91 1.64 1.64 1.90 3.14 3.6
5
2003 8.92 5.24 19.1 69.1 26.8 31.9 7.053.82 8.86 5.89 5.55 12.6
2004 6.20 19.1 56.6 19.5 20.8 7.735.75 2.95 1.49 1.69 4.45 4.22
2005 15.7 38.4 14.2 19.4 6.26 3.433.99 2.79 1.79 2.35 2.86 10.9
2006 21.7 19.9 40.0 40.8 11.7 13.2 4.28 3.31 9.46 7.28 14.9 26.5
2007 31.4 37.5 29.6 30.8 11.9 5.98 2.71 2.15 2.38 6.03 14.2 11.5
2008 29.2 20.534.9 35.3 13.55.47 3.29 3.14 3.20 2.11 5.98 7.62

2-12 WATER AND WASTEWATER ENGINEERING
The regulatory agency will only permit a withdrawal of 5%. Therefore, the allowable with-
drawal will be
()( )005598 0 30
33
.. .m /s m /s
This is sufficient to meet the safe yield of 0.25 m
3
/ s required for the municipality.
If the determination is made that the 50 percentile allowable withdrawal is less than the
required safe yield, then, even with storage, the safe yield cannot be met. An alternative source
should be investigated. If the determination is made that the allowable withdrawal will be adequate,
then an analysis is performed to d
etermine the need for a storage reservoir for droughts. This
analysis is called an annual series or extreme-value analysis.
Annual Series. Extreme-value analysis is a probability analysis of the largest or smallest values
in a data set. Each of the extreme values is selected from an equal time interval. For e
xample, if
the largest value in each year of rec ord is used, the extrem e-value analysis is called an annual
maxima series. If the smallest value is used, it is called an annual minima series.
Because of the climatic effec ts on most hydrologic phenom
ena, a water year or hydrologic
year i s adopted instead of a calendar year. The U.S. Geological Survey (U.S.G.S.) has adopted
the 12-month period from October 1 to September 30 as the hydrologic year for the United
States. This period was chosen for two reasons: “(1) to break the record during the low-water
period near the end of the summer season, and (2) to avoid breaking the recor
d during the winter,
so as to eliminate computation difficulties during the ice period.” (Boyer, 1964)
The procedure for an annual maxima or minima analysis is as follows:
1 . Select the minimum or maximum value in each 12-month interval (October to September)
over the period of record.
2. Rank each value starting with the highest (for annu
al maxima) or lowest (for annual
minima) as rank number one.
3. Compute a return period using Weibull’s formula (Weibull, 1939):
T
n
m
1
(2-1)
where T average return period, y
n number of years of record
m rank of storm or drought
4. Plot the annual maxima or minima series on a special probability paper known as Gumbel
paper. (A blank copy of Gumbel paper may be downloaded from the website: http//www.
mhprofessional.com/wwe .) Althou
gh the same paper may be used for annual minima series,
Gumbel recommends a log extremal probability paper (axis of ordinates is log scale) for
droughts (Gumbel, 1954).
From the Gumbel plot, the return period for a flood or drought of any magnitude may be deter-
mined. Conversely, for an
y magnitude of flood or drought, one may determine how frequently it
will occur.
GENERAL WATER SUPPLY DESIGN CONSIDERATIONS 2-13
In statistical parlance a Gumbel plot is a linearization of a Type I probability distribution. The
logarithmically transformed version of the Type I distribution is called a log-Pearson Type III
distribution. The return period of the mean ( X ) of the Type I distribution occurs at T 2.33 years.
Thus, the U.S.G.S. takes the return perio
d of the mean annual flood or drought to be 2.33 years.
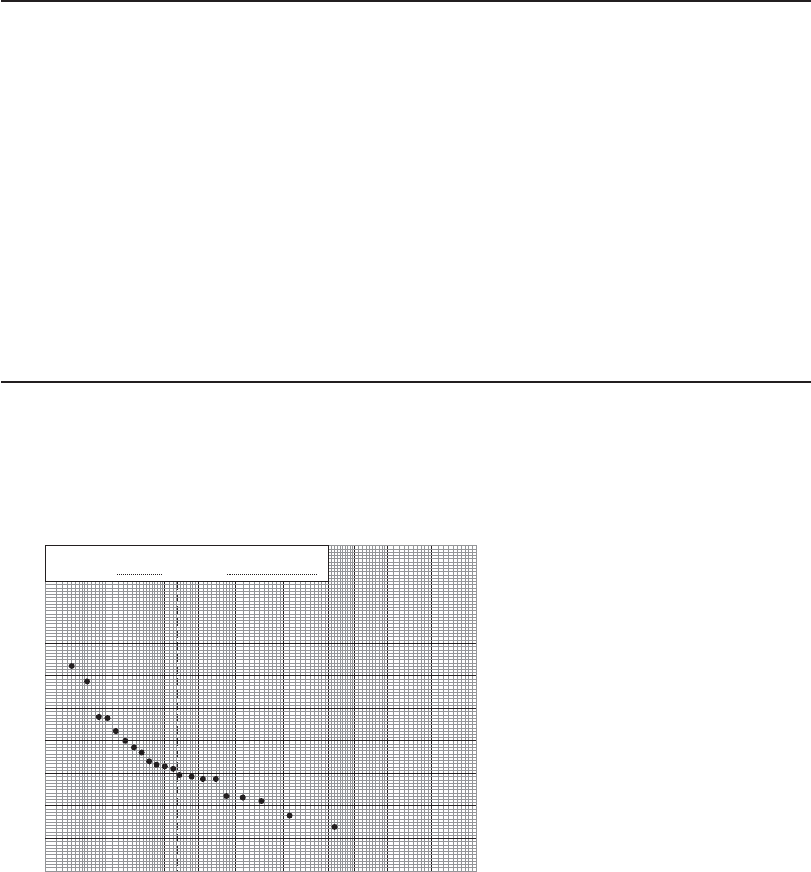
This is marked by a vertical dashed line on Gumbel paper ( Figure 2-4 ).
The data in Table 2-8 were used to plot the annual minima line in Figure 2-4 . The computa-
tions are explained in Example 2-2 .
Example 2-2. In continuing the evaluation of the Troubles ome Creek as a water s
upply for
Nosleep ( Example 2-1 ), perform an annual minima extreme-value analysis on the data in Table 2-7 .
Determine the recurrence interval of monthly flows that fail to meet an average demand of 0.31 m
3
/ s.
Also determine the discharge of the mean monthly annual minimum flow.
Solution. To begin, select the minimum discharge in each hydrologic year. The first nine
months of 1987 and the last three months of 2008 cannot be used because they are not complete
hydrologic years. After selecting the minimum val
ue in each year, rank the data and compute
the return period. The 1988 water year begins in October 1987.
The computations are summarized in Table 2-8 . The return period and flows are plotted in
Figure 2-4 . From Figure 2-4 find that for the 22 years of record, the minimum flow exceeds a
demand of 0.31 m
3
/ s and that the mean monthly minimum flow is about 1.5 m
3
/ s.
However, as noted in Example 2-1 , the regulatory agency will only permit removal of 5% of
the flow. The fifth column in Table 2-8 shows the computation of 5% of the flow. Obviously, stor-
age must be provided if the Troublesome Creek is to be used as a water source.
Partial-Duration Series. It often happens that the second largest or second s
mallest flow in a
water year is larger or smaller than the maxima or minima from a different hydrologic year. To
take these events into consideration, a partial series of the data is examined. The procedure for
performing a partial-duration series analysis is very similar to that used for an annual series. The
0
1.01
1.1
1.2
1.3
1.4
1.5
2
3
4
5
Return period, in
y
ears
6
7
8
9
10
20
30
40
50
100
200
0.5
1.0
1.5
2.0
Annual minimum monthly discharge, m
3
/s
2.5
3.0
3.5
Annual droughts on
Drainage area, sq. m.
Period
1988–2008
Troublesome Creek at Nosleep
FIGURE 2-4
Annual droughts on Troublesome Creek at Nosleep.

2-14 WATER AND WASTEWATER ENGINEERING
Year Annual minima, m
3
/s Rank Return period, years 5% of Minima, m
3
/s
1992 0.67 1 22.00 0.034
1997 0.85 2 11.00 0.043
1988 1.08 3 7.33 0.054
1995 1.13 4 5.50 0.057
1990 1.1554.40 0.058
1996 1.42 6 3.67 0.071
2000 1.42 7 3.14 0.071
1991 1.46 8 2.75 0.073
2004 1.49 9 2.44 0.075
1994 1.56 10 2.20 0.078
2001 1.61 11 2.00 0.081
2002 1.64 12 1.83 0.082
2005 1.69 13 1.69 0.085
1989 1.83 14 1.57 0.092
2003 1.90 15 1.47 0.099
1998 1.98 16 1.38 0.099
2007 2.15 17 1.29 0.108
2006 2.35 18 1.22 0.118
1993 2.38 19 1.16 0.119
1999 2.92 20 1.10 0.146
2008 3.14 21 1.05 0.157
TABLE 2-8
Tabulated computations of annual minima for Troublesome Creek at Nosleep
theoretical relationship between an annual series and partial series is shown in Table 2-9 . The
partial series is approximately equal to the annual series for return periods greater than 10 years
(Langbein, 1949).
If the time period over which the event occurs is also taken into account, the analysis is
termed a partial-duration series. While it is fairly easy to define a flood a
s any flow that exceeds
the capacity of the drainage system, in ord er to properly define a drought, one must specify the
low flow and its duration. For exam ple, if a roadway is covered with water for 10 minutes, one
can say that it is flooded. In contrast, if the flow in a river is below our demand for 10 minute
s,
one certainly would not declare it a drought! Thus, a partial-duration series is particularly rel-
evant for low-flow conditions.
Low-Flow Duration. From an environmental engineering point of view, three low-flow
durations are of particular interest. The 10-year return period of seven days of low flow has
been selected by many states as the critic al flow for water pollution control. Wa
stewater treat-
ment plants must be designed to provide sufficient treatment to allow effluent discharge without
driving the quality of the receiving stream below the standard when the dilution capacity of the
stream is at a 10-year low.
A longer duration low flow and longer return period are selected for water s upply. In the
Midwest, drought durations
of 1 to 5 years and return periods of 25 to 50 y ears are used in the

GENERAL WATER SUPPLY DESIGN CONSIDERATIONS 2-15
design of water-supply reservoirs. Where water supply is by direct draft (withdrawal) from a
river, the duration selected may be on the order of 30 to 90 days with a 10-year return period.
When alternate sources are available, shorter return periods may be acceptable.
When to Use Which Series. The probability of occurrence (l/ T ) computed
from an annual
series will not be the same as that found from a complete series. There are many reasons for this
difference. Among the most obvious is the fact that, in computing an annual series, 1/12 of the
data is treated as if it were all of the data when, in fact, it is not even a representative sample. It is
only the extreme end of the possible range of val
ues.
The following guidelines can be used to decide when to use which analysis:
1 . Use a complete series to determine the long-time reliability (yield) for water supply.
2. Use an annual minima series to determine the need for storage.
3. Use a partial-duration series to predict low-flow c
onditions.
In practice the complete-series analysis can be performed to decide whether or not it is worth
doing a partial series for water supply. If the complete series indicates that the mean monthly
flow will not supply the demand, then computation of an annual minima series to determine the
nee
d for storage is not worth the trouble, since it would be impossible to store enough water to
meet the demand.
Volume of Reservoirs. The techniques for determining the storage volume required for a res-
ervoir are dependent both on the size and use of the res ervoir. This discussion is limited to the
simplest procedure, which is quite s
atisfactory for small water-supply impoundments. * It is called
the mass diagram or Rippl method (Rippl, 1883). The main disadvantage of the Rippl method is
Partial series Annual series
0.5 1.18
1.0 1.58
1.45 2.08
2.0 2.54
5.0 5.52
10.0 10.5
50.0 50.5
100.0 100.5
TABLE 2-9
Theoretical relationship between partial
series and annual series return periods in years
Source: W. B. Langbein, “Annual Floods and Partial Duration
Series,” Transactions of the American Geophysical Union,
vol. 30, pp. 879–881, 1949.
*It is also useful for sizing storm-water retention ponds and wastewater equalization basins.

2-16 WATER AND WASTEWATER ENGINEERING
that it assumes that the sequence of events leading to a drought or flood will be the sam e in the
future as it was in the past. More sophisticated techniques have been developed to overcome this
disadvantage. These techniques are left for advanced hydrology classes.
The Rippl procedure for determining the
storage volume is an application of the mass bal-
ance method of analyzing problems. In this case it is assumed that the only input is the flow into
the reservoir ( Q
in
) and that the only output is the flow out of the reservoir ( Q
out
). Therefore,with
the assumption that the density term cancels out because the change in density across the reser-
voir is negligible,
dS
dt
d
dt
d
dt
() ( )In Out
(2-2)
becomes
dS
dt
QQ
in out
(2-3)
If both sides of the equation are multiplied by dt, the inflow and outflow become volumes (flow
rate time volume), that is,
dS Q dt Q dt( )()( )()
in out
(2-4)
By substituting finite time increments ( t ), the change in storage is then
( )()( )()QtQ tS
in out
(2-5)
By cumulatively summing the storage terms, the size of the reservoir can be estimated. For
water supply reservoir design, Q
out
i s the demand, and zero or positive values of storage ( S )
indicate there is enough water to meet the demand. If the storage is negative, then the reservoir
must have a capacity equal to the absolute value of cumulative storage to meet the demand. This
is illustrated in the following example.
Example 2-3. Using the data in Table 2-7 , determine the
storage required to meet Nosleep’s
demand of 0.25 m
3
/ s for the period from August 1994 through January 1997.
Solution. The computations are summarized in the table below.
Month
Q
in
(m
3
/s)
(0.05)(Q
in
)
(m
3
/s)
(0.05)(Q
in
)(t)
(10
6
m
3
)
Q
out
(m
3
/s)
Q
out
(t)
(10
6
m
3
)
S
(10
6
m
3
)
S (
S)
(10
6
m
3
)
1994
Aug 1.70 0.085 0.228 0.25 0.670 0.442 0.442
Sep 1.56 0.078 0.202 0.25 0.648 0.446 0.888
Oct1.56 0.078 0.209 0.25 0.670 0.461 1.348
Nov 2.04 0.102 0.264 0.25 0.648 0.384 1.732
Dec 2.35 0.1175 0.315 0.25 0.670 0.355 2.087
(continued)

GENERAL WATER SUPPLY DESIGN CONSIDERATIONS 2-17
1995
Jan 2.89 0.1445 0.387 0.25 0.670 0.283 2.370
Feb 9.57 0.4785 1.158 0.25 0.605 0.553 1.817
Mar 17.7 0.885 2.370 0.25 0.670 1.701 0.166
Apr 16.4 0.82 2.125 0.25 0.648 1.477
May 6.83 0.3415 0.915 0.25 0.670 0.245
Jun 3.74 0.187 0.485 0.25 0.648 0.163 0.163
Jul 1.60 0.08 0.214 0.25 0.670 0.455 0.619
Aug 1.13 0.0565 0.151 0.25 0.670 0.518
1.137
Sep 1.13 0.0565 0.146 0.25 0.648 0.502 1.638
Oct 1.42 0.071 0.190 0.25 0.670 0.479 2.118
Nov 1.98 0.099 0.257 0.25 0.648 0.391 2.509
Dec 2.12 0.106 0.284 0.25 0.670 0.386 2.895
1996
Jan 1.78 0.089 0.238 0.25 0.670 0.431 3.326
Feb 1.95 0.0975 0.236 0.25 0.605 0.369 3.695
Mar 7.25 0.3625 0.971 0.25 0.670 0.301 3
.394
Apr 24.7 1.235 3.201 0.25 0.648 2.533 0.841
May 6.26 0.313 0.838 0.25 0.670 0.169 0.672
Jun 8.92 0.446 1.156 0.25 0.648 0.508 0.164
Jul 3.57 0.1785 0.478 0.25 0.670 0.192 0.355
Aug 1.98 0.099 0.265 0.25 0.670 0.404 0.760
Sep 1.95 0.0975 0.253 0.25 0.648 0.395 1.155
Oct 3.09 0.1545 0.414 0.25 0.670 0.256 1.411
Nov 3.94 0.197 0.511 0.2
5 0.648 0.137 1.548
Dec 12.7 0.635 1.701 0.25 0.670 1.031 0.517
1997
Jan 13.8 0.69 1.848 0.25 0.670 1.178
The data in the first and second columns of the table were extracted from Table 2-7 . The
third column is the product of the second column and the regulatory restriction of 5%. The fourth
column is the product of the second column and the time interval for the month. For example, for
Augus
t (31 d) and September (30 d), 1994:
()()()
(
008531 86 400 227 664
0
33
.,,m /s d s/dm
.. , ,078 30 86 400 202 176
33
m /s d s/dm)( )( )
The fifth column is the demand given in the problem statement.
The sixth column is the product of the demand and the time interval for the month. For
example, for August and September 1994:
()()( )
(
02531 86 400 669 600
0
33
.,,
.
m /s d s/dm
22530 86 400 648 000
33
m /s d s/dm)( )( ),,

2-18 WATER AND WASTEWATER ENGINEERING
The seventh column ( S) is the difference between the third and fifth columns. For example,
for August and September 1994:
227 664 669 600 441 936
202 176
33 3
3
,, ,
,
mm m
m
648 000 445 824
33
,,mm
The last column(( S )) is the sum of the last value in that column and the value in the sixth
column. For August 1994, it is 441,936 m
3
since this is the first value.
For September 1994, it is
()()441 936445 824 887 760
333
,,,mmm
The following logic is used in interpreting the table. From August 1994 through March 1995,
the demand exceeds the flow, and storage must be provided. The maximum storage required
for this interval is 2.370 10
6
m
3
. In April 1995 , the storage (∆S ) e xceeds the deficit (Σ(∆ S ))
from March 1995. If the deficit is viewed as the volume of water in a virtual reservoir with a
total capacity of 2.370 10
6
m
3
, then in March 1995, the volume of water in the reservoir is
2.204 10
6
m
3
(2.370 10
6
0.166 10
6
). The April 1995 inflow exceeds the demand and
fills the reservoir deficit of 0.166 10
6
m
3
.
Because the inflow ( Q
in
) exceeds the demand (0.25 m
3
/ s) for the months of April and May
1995, no storage is required during this period. Therefore, no computations were performed.
From June 1995 through December 1996, the demand exceeds the inflow, and storage is
required. The maximum storage required is 3.695 10
6
m
3
. Note that the computations for stor-
age did not stop in May 1996, even though the inflow exceeded the demand. This is because the
storage was not sufficient to fill the reservoir deficit. The storage was sufficient to fill the reser-
voir deficit in January 1997.
Comment. These tabulations are particularly well suited to spread
sheet programs.
The storage volume determined by the Rippl method must be increased to account for water
lost through evaporation and volume lost through the accumulation of sediment.
Groundwater
Unlike surface water supplies, groundwater is less subject to seasonal fluctuations and long-term
droughts. The design basis is the long term or “safe” yield. The safe yield of a ground water basin
is the amount of water which can be withdrawn from it annually without producing an un
desired
result. (Todd, 1959) A yield analysis of the aquifer is performed because of the potential for over-
pumping the well with consequent failure to yield an adequate supply as well as the potential to
cause dramatic ground surface settlement, detrimental dewatering of nearby ponds or stream
s or,
in wells near the ocean, to cause salt water intrusion.
Confined Aquifer. The components of the evaluation of the aquifer as a water supply are:
(1) depth to the bottom of the aquiclude, (2) elevation of the existing piezometric surface,
(3) drawdown for sustained pumping at the design rate of demand, and (4) recharge and drought
implications
.
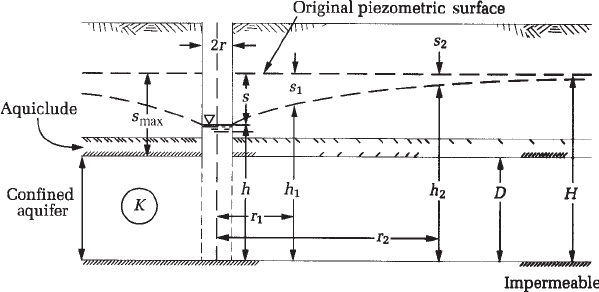
GENERAL WATER SUPPLY DESIGN CONSIDERATIONS 2-19
The depth to the bottom of the aquiclude ( Figure 2-5 ) sets the limit of drawdown of the
piezometric surface. If the piezometric surface drops below the bottom of the aquiclude, ground
settlement will begin to occur and, in addition to structural failure of the well, structural damage
will occur to build
ings and roadways. In populated areas of the United States, regulatory agen-
cies gather hydrogeologic data reported by well drillers and others that may be used to estimate
the depth to the aquiclude. In less densely populated areas, exploration and evaluation by a pro-
fessional hydrogeologist is requ
ired.
The existing piezometric surface sets the upper bound of the range of drawdown. That is,
the difference between the existing piezometric surface and the bottom of the aquiclude ( s
max
in Figure 2-5 ) is the m aximum allowable drawdown for a safe yield. As noted above, in popu-
lated areas, regulatory agencies will have a database that includes this information. Otherwis e,
a hydrogeologic exploration will be required.
Drawdown Estimation. The derivation of equations relating well discharge to water-level
drawdown and the hydraulic properties of the aq
uifer is bas ed on the following assumptions
(Bouwer, 1978):
1 . The well is pumped at a constant rate.
2. Flow toward the well is radial and uniform.
3. Initially the piezometric surface is horizontal.
4. The well fully penetrates the aquifer and is screened for the entire length.
5. The aquifer is homogeneous, isotropic, horizontal, and of infinite horizontal extent.
6. Water is released from the aquifer in immediate response to a drop in the piezometric
surface.
Although the steady state will seldom occur in practice, it may be approached after pro-
longed pumping when the piezometric surface declines at a very slow rate. The Thiem equation
FIGURE 2-5
Geometry and symbols for a pumped well in a confined aquifer. (Source: H. Bouwer, 1978.)