Vidakovic B. Statistics for Bioengineering Sciences: With Matlab and WinBugs Support
Подождите немного. Документ загружается.


11.13 Exercises 459
were stratified by MTHFR C677T genotype (k =3) and their measurements
summarized as in the table below.
CC: n
1
=312 CT: n
2
=378 TT: n
3
=125
Characteristics
X
1
(s
1
) X
2
(s
2
) X
3
(s
3
)
Homocysteine, nmol/l 14.1 (1.9) 14.2 (2.3) 15.3 (3.0)
Red blood cell folate, nmol/l 715 (258) 661 (236) 750 (348)
Serum folate, nmol/l 13.1 (4.7) 12.3 (4.2) 11.4 (4.4)
(a) Using one-way ANOVA, test the hypothesis that the population homo-
cysteine levels for the three genotype groups are the same. Use
α =0.05.
Hint:
Since the raw data are not given, calculate
MST r
=
1
k −1
k
X
i=1
n
i
(X
i
−X )
2
and MSE =
1
N −k
k
X
i=1
(n
i
−1)s
2
i
,
for
N
= n
1
+···+n
k
and X =
n
1
X
1
+···+n
k
X
k
N
.
Statistic F is the ratio MSTr/MSE. It has k
−1 and N−k degrees of freedom.
(b) For red blood cell folate measurements complete the ANOVA table.
SS DF MS F p
===================================================================
SSTr= DF1= MSTr=469904.065 F= p=
SSE = DF2= MSE = 69846.911
===========================
SST= DF=
11.5. Beetles. The following data were extracted from a more extensive study
by Sokal and Karten (1964). The data represent mean dry weights (in mil-
liggrams) of three genotypes of beetles, Tribolium castaneum, reared at a
density of 20 beetles per gram of flour. The four independent measurements
for each genotype are recorded.
Genotypes
++ +b bb
0.958 0.986 0.925
0.971 1.051 0.952
0.927 0.891 0.829
0.971 1.010 0.955
Using one-way ANOVA, test whether the genotypes differ in mean dry
weight. Take
α =0.01.
11.6. ANOVA Table from Summary Statistics. When accounts of one-way
ANOVA designs are given in journal articles or technical reports, the data

460 11 ANOVA and Elements of Experimental Design
and the ANOVA table are often omitted. Instead, means and standard de-
viations for each treatment group are given (along with the F-statistic, its
p-value, or the decision to reject or not). One can build the ANOVA table
from this summary information (and thus verify the author’s interpretation
of the data).
The results below are from an experiment with n
1
= n
2
= n
3
= n
4
= 10 ob-
servations on each of k
=4 groups.
Treatment n
i
X
i
s
i
1 10 100.40 11.68
2 10 103.00 11.58
3 10 107.10 10.05
4 10 114.80 10.61
(a) Write the model for this experiment and state the null hypothesis in
terms of the parameters of the model.
(b) Use the information in the table above to show that SST r
= 1186 and
SSE
=4357.
(c) Construct the ANOVA table for this experiment, with standard columns
SS, d f , MS, F, and p-value.
Hint:
SST r = n
1
(
X
1
− X)
2
+n
2
(X
2
− X)
2
+n
3
(X
3
− X)
2
+n
4
(X
4
− X)
2
and
SSE
=(n
1
−1)s
2
1
+(n
2
−1)s
2
2
+(n
3
−1)s
2
3
+(n
4
−1)s
2
4
.
Part (c) shows that it is possible to use treatment means and standard devi-
ations to reconstruct the ANOVA table, find its F-statistic, and test the null
hypothesis. However, without knowing the individual data values, one can-
not carry out some other important statistical analyses (residual analysis,
for example).
11.7. Protein Content in Milk for Three Diets. The data from Diggle et al.
(1994) are used to compare the content of protein in milk in 79 cows ran-
domly assigned to three different diets: barley, a barley-and-lupins mixture,
and lupins alone.
The original data set is longitudinal in nature (protein monitored weekly
for several months), but for the purpose of this exercise we took the protein
concentration at 6 weeks following calving for each cow.
b=[3.7700 3.0000 2.9300 3.0500 3.6000 3.9200...
3.6600 3.4700 3.2100 3.3400 3.5000 3.7300...
3.4900 3.1600 3.4500 3.5200 3.1500 3.4200...
3.6200 3.5700 3.6500 3.7100 3.5700 3.6300...
3.6000];
m=[3.4000 3.8000 3.2900 3.7100 3.2800 3.3800...
3.5700 2.9000 3.5500 3.5500 3.0400 3.4000...
3.1500 3.1300 3.2500 3.1500 3.1000 3.1700...
3.5000 3.5700 3.4700 3.4500 3.2600 3.2400...
3.7000 3.0500 3.5400];

11.13 Exercises 461
l=[3.0700 3.1200 2.8700 3.1100 3.0200 3.3800...
3.0800 3.3000 3.0800 3.5200 3.2500 3.5700...
3.3800 3.0000 3.0300 3.0600 3.9600 2.8300...
2.7400 3.1300 3.0500 3.5500 3.6500 3.2700...
3.2000 3.2700 3.7000];
resp = [b’; m’; l’]; %single column vector of all responses
class = [ones(25,1); 2
*
ones(27,1); 3
*
ones(27,1)]; %class vector
[pval, table, stats] = anova1(resp, class)
[cintsdiff,means] = multcompare(stats) %default comparisons
Partial output is given below.
(a) Fill in the empty spaces in the output.
%pval =
% 0.0053
%
%table
%’Source’ ’SS’ ’df’ ’MS’ ’F’ ’Prob>F’
%’Groups’ [
______
] [
____
] [0.3735] [
______
] [
_______
]
%’Error’ [
______
] [
____
] [
______
]
%’Total’ [5.8056] [
____
]
%
%stats =
% gnames: 3x1 cell
% n: [25 27 27]
% source: ’anova1’
% means: [3.4688 3.3556 3.2293]
% df: 76
% s: 0.2580
%
% cintsdiff =
% 1.0000 2.0000 -0.0579 0.1132 0.2844
% 1.0000 3.0000 0.0684 0.2395 0.4107
% 2.0000 3.0000 -0.0416 0.1263 0.2941
%
% means =
% 3.4688 0.0516
% 3.3556 0.0497
% 3.2293 0.0497
(b) What is H
0
here and is it rejected? Use α =5%.
(c) From the output
cintsdiff discuss how the population means differ.
11.8. Tasmanian Clouds. The data
clouds.txt provided by OzDASL were
collected in a cloud-seeding experiment in Tasmania between mid-1964 and
January 1971. Analysis of these data is discussed in Miller et al. (1979).
The
rainfalls are period rainfalls in inches. Variables TE and TW are the
east and west target areas, respectively, while
CN, CS, and CNW are the cor-
responding rainfalls in the north, south, and northwest control areas, re-
spectively.
S stands for seeded and U for unseeded. Variables C and T are
averages of control and target rainfalls. Variable
DIFF is the difference T-C.
462 11 ANOVA and Elements of Experimental Design
(a) Use additive two-way ANOVA to estimate and test treatment effects
Season and Seeded.
(b) Repeat the analysis from (a) after adding the interaction term.
11.9. Clover Varieties. Six plots each of five varieties of clover were planted
at the Danbury Experimental Station in North Carolina. Yields in tons per
acre were as follows:
Variety Yield
Spanish 2.79, 2.26, 3.09, 3.01, 2.56, 2.82
Evergreen 1.93, 2.07, 2.45, 2.20, 1.86, 2.44
Commercial Yellow 2.76, 2.34, 1.87, 2.55, 2.80, 2.21
Madrid 2.31, 2.30, 2.49, 2.26, 2.69, 2.17
Wisconsin A46 2.39, 2.05, 2.68, 2.96, 3.04, 2.60
(a) Test the hypothesis that the mean yields for the five clover varieties are
the same. Take
α =5%. What happens if your α is 1%.
(b) Which means are different at a 5% level?
(c) Is the hypothesis H
0
: 3(µ
1
+µ
5
) =2(µ
2
+µ
3
+µ
4
) a contrast? Why? If yes,
test it against the two-sided alternative, at an
α =5% level.
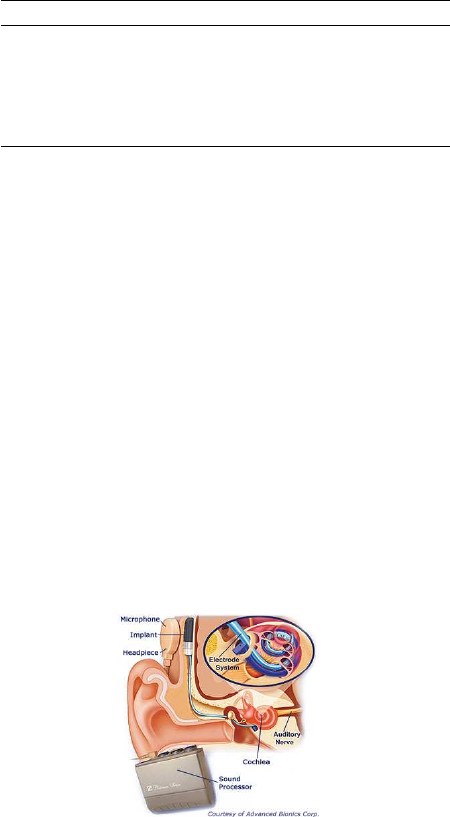
11.10. Cochlear Implants. A cochlear implant is a small, complex electronic de-
vice that can help to provide a sense of sound to a person who is profoundly
deaf or severely hard of hearing. The implant consists of an external portion
that sits behind the ear and a second portion that is surgically placed under
the skin (Fig. 11.11). Traditional hearing aids amplify sounds so they may
be detected by damaged ears. Cochlear implants bypass damaged portions
of the ear and directly stimulate the auditory nerve. Signals generated by
the implant are sent by way of the auditory nerve to the brain, which recog-
nizes the signals as sound. Hearing through a cochlear implant is different
from normal hearing and takes time to learn or relearn. However, it allows
many people to recognize warning signals, understand other sounds in the
environment, and enjoy a conversation in person or by telephone.
Fig. 11.11 Cochlear implant.

11.13 Exercises 463
Eighty-one profoundly deaf subjects in this experiment received one of
three different brands of cochlear implant (A/B/G3). Brand G3 is a third-
generation device, while brands A and B are second-generation devices.
The research question was to determine whether the three brands differed
in levels of speech recognition.
The data file is given in
deaf.xlsx. The variables are as follows:
Name Description
ID Patient ID number
Age Patient’s age at the time of implantation
Device Type of cochlear implant (A/B/G3)
YrDeaf Years of profound deafness prior to implantation
CS Consonant recognition score, sound only
CV Consonant recognition score, visual only (no sound)
CSV Consonant recognition score, sound and vision
SNT Sentence understanding score
VOW Vowel recognition score
WRD Word recognition score
PHN Phoneme recognition score
Run three separate ANOVAs with three response variables, which are dif-
ferent tests of speech recognition:
(a) CSV, audiovisual consonant recognition (subjects hear triads like “ABA,”
“ATA,” and “AFA” and have to pick the correct consonant on a touch screen);
(b) PHN, phoneme understanding (number of correct phonemes in random
5- to 7-word sentences like “The boy threw the ball.”); and
(c) WRD, word recognition (number of words recognized in a list of random,
unrelated monosyllabic words “ball,” “dog,” etc.).
11.11. Bees. The data for this problem are taken from Park (1932), who inves-
tigated changes in the concentration of nectar in the honey sac of the bee.
Syrup of approx. 40% concentration was fed to the bees. The concentra-
tion in their honey sacs was determined upon their arrival at the hive. The
decreases recorded in the table are classified according to date, both day
(September 1931) and time of day being differentiated. The question to be
answered is this: Were significant differences introduced by changes in the
time of gathering the data, or may the six groups be considered random
samples from a homogeneous population?

464 11 ANOVA and Elements of Experimental Design
3 3 3 10 11 12
10:20 11:10 2:20 4:00 1:10 10:30
1.1 1.0 0.6 −1.6 1.1 2.5
1.0 0.6 0.3 0.8 0.5 0.6
0.9 1.0
−0.1 2.1 2.2 1.1
1.1 0.4 0.0 1.1 1.1 0.6
0.9 0.4 1.5 0.6 0.4 1.8
1.1 0.9 0.9 0.6
−2.0 0.6
0.6 0.6 0.3 0.6 1.4 1.2
0.5 0.4 0.2 0.2
−0.4 1.2
0.5 1.1 0.4 0.8 2.4 0.4
0.7 0.7 0.4 0.6 0.0 1.0
11.12. SiRstv: NIST’s Silicon Resistivity Data. Measurements of bulk resis-
tivity of silicon wafers were made at NIST with five probing instruments
(columns in the data matrix) on each of 5 days (rows in the data matrix).
The wafers were doped with phosphorous by neutron transmutation doping
in order to have nominal resistibility of 200 ohm cm. Measurements were
carried out with four-point DC probes according to ASTM Standard F84-93
and described in Ehrstein and Croarkin (1984).
1 2 3 4 5
196.3052 196.3042 196.1303 196.2795 196.2119
196.1240 196.3825 196.2005 196.1748 196.1051
196.1890 196.1669 196.2889 196.1494 196.1850
196.2569 196.3257 196.0343 196.1485 196.0052
196.3403 196.0422 196.1811 195.9885 196.2090
(a) Test the hypothesis that the population means of measurements pro-
duced by these five instruments are the same at
α = 5%. Use MATLAB to
produce an ANOVA table.
(b) Pretend now that some measurements for the first and fifth instruments
are misrecorded (in italics) and that the modified table looks like this:
1 2 3 4 5
196.3052 196.3042 196.1303 196.2795 196.1119
196.2240 196.3825 196.2005 196.1748 196.1051
196.2890 196.1669 196.2889 196.1494 196.1850
196.2569 196.3257 196.0343 196.1485 196.0052
196.3403 196.0422 196.1811 195.9885 196.1090
Test now the same hypothesis as in (a). If H
0
is rejected, perform Tukey’s
multiple comparisons procedure (at Tukey’s family error rate of 5%).
11.13. Dorsal Spines of Gasterosteus aculeatus. Bell and Foster (1994) were in-
terested in the effect of predators on dorsal spine length evolution in Gas-
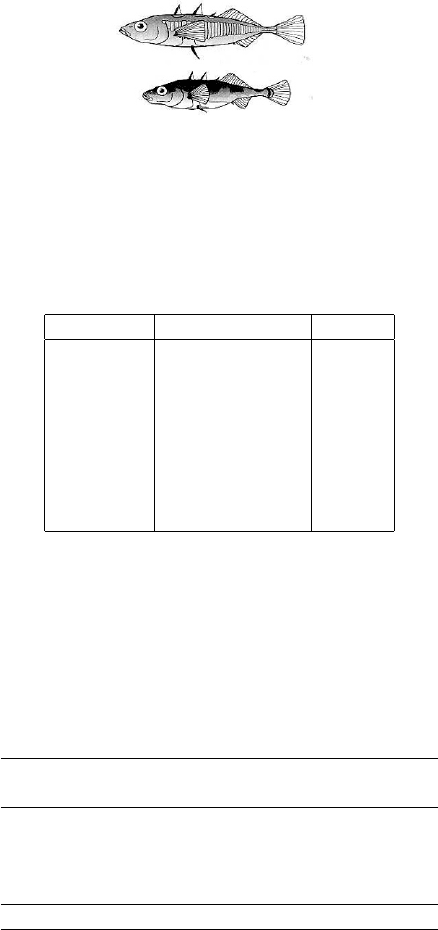
11.13 Exercises 465
terosteus aculeatus (threespine stickleback, Fig. 11.12). Dorsal spines are
thought to act as an antipredator mechanism.
Fig. 11.12 Gasterosteus aculeatus.
To examine this issue, researchers sampled eight sticklebacks from each
of Benka Lake (no predators), Garden Bay Lake (some predators), and Big
Lake (lots of predators). Their observations on spine length (in millimeters)
are provided in the following table.
Benka Lake Garden Bay Lake Big Lake
4.2 4.4 4.9
4.1 4.6 4.6
4.2 4.5 4.3
4.3 4.2 4.9
4.5 4.4 4.7
4.4 4.2 4.4
4.5 4.5 4.5
4.3 4.7 4.4
They would like to know if spine lengths differ among these three popula-
tions and apply ANOVA with lakes as “treatments.”
(a) Test the hypothesis that the mean lengths in the three populations are
the same at level
α =0.05. State your conclusion in terms of the problem.
(b) Would you change the decision in (a) if
α = 0.01? Explain why or why
not.
11.14. Incomplete ANOVA Table. In the context of balanced two factor ANOVA
recover entries a–m.
Source of Sum of Degrees of Mean
Variation Squares Freedom Square F p-value
A 256.12 2 a 4.18 b
B c 3 12.14 d e
A
×B 217.77 f g h i
Error j k l
Total m 119
11.15. Maternal Behavior in Rats. To investigate the maternal behavior of
laboratory rats, researchers separated rat pups from their mother and

466 11 ANOVA and Elements of Experimental Design
recorded the time required for the mother to retrieve the pups. The study
was run with 5-, 20-, and 35-day-old pups, six in each group. The pups were
moved to a fixed distance from the mother and the time of retrieval (in
seconds) was recorded (Montgomery, 1984):
5 days 15 10 25 15 20 18
20 days 30 15 20 25 23 20
35 days 40 35 50 43 45 40
State the inferential problem, pose the hypotheses, check for sphericity, and
do the test at
α =0.05. State your conclusions. .
11.16. Comparing Dialysis Treatments. In Example pretend that the three
columns of measurements are independent, that is, that 24 independent
patients were randomly assigned to one of the three treatments, 8 patients
to each treatment. Test the null hypothesis that there is no difference in
mean weight change among the treatments. Use
α =0.05. Compare results
with those in Example and comment.
11.17. Materials Scientist and Assessing Tensile Strength. A materials sci-
entist wishes to test the effect of four chemical agents on the strength of
a particular type of cloth. Because there might be variability from one bolt
to another, the scientist decides to use a randomized block design, with the
bolts of cloth considered as blocks. She selects five bolts and applies all four
chemicals in random order to each bolt. The resulting tensile strengths fol-
low. Analyze the data and draw appropriate conclusions.
Bolt
Chemical 1 2 3 4 5
1 73 68 74 71 67
2 73 67 75 72 70
3 75 68 78 73 68
4 73 71 75 75 69
11.18. Oscilloscope. Montgomery (1984) discusses an experiment conducted to
study the influence of operating temperature and three types of face-plate
glass in the light output of an oscilloscope tube. The following data are
collected.

11.13 Exercises 467
Temperature
Glass type 100 125 150
580 1090 1392
1 568 1087 1380
570 1085 1386
550 1070 1328
2 530 1035 1312
579 1000 1299
546 1045 867
3 575 1053 904
599 1066 889
11.19. Magnesium Ammonium Phosphate and Chrysanthemums. Walpole
et al. (2007) provide data on a study “Effect of magnesium ammonium phos-
phate on height of chrysanthemums” that was conducted at George Ma-
son University to determine a possible optimum level of fertilization, based
on the enhanced vertical growth response of the chrysanthemums. Forty
chrysanthemums seedlings were assigned to 4 groups, each containing 10
plants. Each was planted in a similar pot containing a uniform growth
medium. An increasing concentration of MgNH
4
PO
4
, measured in grams
per bushel, was added to each plant. The 4 groups of plants were grown un-
der uniform conditions in a greenhouse for a period of 4 weeks. The treat-
ments and the respective changes in heights, measured in centimeters, are
given in the following table:
Treatment
50 g/bu 100 g/bu 200 g/bu 400 g/bu
13.2 16.0 7.8 21.0
12.4 12.6 14.4 14.8
12.8 14.8 20.0 19.1
17.2 13.0 15.8 15.8
13.0 14.0 17.0 18.0
14.0 23.6 27.0 26.0
14.2 14.0 19.6 21.1
21.6 17.0 18.0 22.0
15.0 22.2 20.2 25.0
20.0 24.4 23.2 18.2
(a) Do different concentrations of MgNH
4
PO
4
affect the average attained
height of chrysanthemums? Test the hypothesis at the level
α
=
0
.
10
.
(b) For
α =10% perform multiple comparisons using multcompare.
(c) Find the 90% confidence interval for the contrast
µ
1
−µ
2
−µ
3
+µ
4
.

468 11 ANOVA and Elements of Experimental Design
11.20. Color Attraction for Oulema melanopus. Some colors are more attrac-
tive to insects than others. Wilson and Shade (1967) conducted an experi-
ment aimed at determining the best color for attracting cereal leaf beetles
(Oulema melanopus). Six boards in each of four selected colors (lemon yel-
low, white, green, and blue) were placed in a field of oats in July. The follow-
ing table (modified from Wilson and Shade, 1967) gives data on the number
of cereal leaf beetles trapped.
Board color Insects trapped
Lemon yellow 45 59 48 46 38 47
White
21 12 14 17 13 17
Green
37 32 15 25 39 41
Blue
16 11 20 21 14 7
(a) Based on computer output, state your conclusions about the attractive-
ness of these colors to the beetles. See also Fig. 11.13a.
In MATLAB:
ntrap=[ 45, 59, 48, 46, 38, 47, 21, 12, 14, 17,...
13, 17, 37, 32, 15, 25, 39, 41, 16, 11,...
20, 21, 14, 7];
color={’ly’,’ly’,’ly’,’ly’,’ly’,’ly’,...
’wh’,’wh’,’wh’,’wh’,’wh’,’wh’,...
’gr’,’gr’,’gr’,’gr’,’gr’,’gr’,...
’bl’,’bl’,’bl’,’bl’,’bl’,’bl’};
[p, table, stats] = anova1(ntrap, color)
multcompare(stats)
%
%’Source’ ’SS’ ’df’ ’MS’ ’F’ ’Prob>F’
%’Groups’ [4.2185e+003] [ 3] [1.4062e+003] [30.5519] [1.1510e-007]
%’Error’ [ 920.5000] [20] [ 46.0250] [] []
%’Total’ [5.1390e+003] [23] [] [] []
%
%Pairwise Comparisons
% 1.0000 2.0000 20.5370 31.5000 42.4630
% 1.0000 3.0000 4.7037 15.6667 26.6297
% 1.0000 4.0000 21.3703 32.3333 43.2963
% 2.0000 3.0000 -26.7963 -15.8333 -4.8703
% 2.0000 4.0000 -10.1297 0.8333 11.7963
% 3.0000 4.0000 5.7037 16.6667 27.6297
(b) The null hypothesis is rejected. Which means differ? See Fig. 11.13b.
(c) Perform an ANOM analysis. Which means are different from the (over-
all) grand mean?
11.21. Raynaud’s Phenomenon. Raynaud’s phenomenon is a condition result-
ing in a discoloration of the fingers or toes after exposure to temperature