Van Kreveld M., Nievergelt J., Roos T., Widmayer P. (eds.) Algorithmic Foundations of Geographic Information Systems
Подождите немного. Документ загружается.

the set of triangles forms a TIN, then one can prove that this is indeed the case:
the complexity of the region U(~,) is basically linear in the number of triangles in
T(~,). To be precise, it is at most
O(n,a(n,)),
where n~ is the number of triangles
in T(~) and where a 0 denotes the extremely slowly growing functional inverse
of Ackermann's function [1]. This can be used to show that the entire hidden-
surface removal algorithm can be implemented so that on a TIN of n triangles
it runs in
O(na(n)logn
+ ktogn) time, where k denotes the complexity of the
visibility map.
4 Levels of Detail
For a reMistic representation of a terrain millions of triangles are needed. In
applications such as flight simulation a terrain should be rendered at reM time,
but even with modern technology it is impossible to achieve this when the num-
ber of triangles is this large. Fortunately, a realistic image of the terrain is only
crucial when one is close to the terrain and only a small part of the terrMn is
visible; when one is flying high above the terrain a coarse representation suffices.
So what is needed is a
multiresolution model:
a hierarchy of representations at
various levels of detail. This makes it possible for a given view point to render
the terrain at an adequate level of detail. Fig. 12-14 shows an example of a hi-
erarchy consisting of three levels. On the left perspective (and shaded) 3D views
of the terrain are shown, and on the right 2D views of the underlying TIN.
One important property required from such a hierarchy is that subsequent
levels should not differ too much in appearance: switching to more and more
detailed representations when zooming in should not cause disturbing 'jumps'
in the image. On the other hand, the reduction of the number of triangles in
subsequent levels should not be too small, otherwise too many levels would be
needed, resulting in an unacceptable increase in storage.
Another desirable property is the following. It is in generM insufficient for
rendering purposes to use only one level of detail at a time: although some part
of the terrain may be close to the view point, another part--the horizon, for
example--can be far away. Hence, one would like to combine parts from different
levels into a single
variable-resolution representation
of the terrain, such that
each part of the terrain is rendered with appropriate detail. This means that the
levels cannot be completely independent, as it should be possible to glue them
together smoothly.
The idea of multiresolution models is quite old, and work on it is scattered
over literature in graphics, GIS, and other areas. Heckbert and Garland [18] and
De Floriani et al. [10] give nice surveys of many of the existing multiresolution
techniques. A related problem is the problem of simplifying general surfaces [19,
14] or terrains [16, 5, 21, 24].
The best known hierarchical data structure is probably the quadtree [29, 28].
Although quadtrees are based on regular grids, not on TINs, we discuss them
briefly because they are so widely used as multiresotution model. Fig. 15 shows a
three-level hierarchy based on a quadtree. The least detailed level simply consists
90
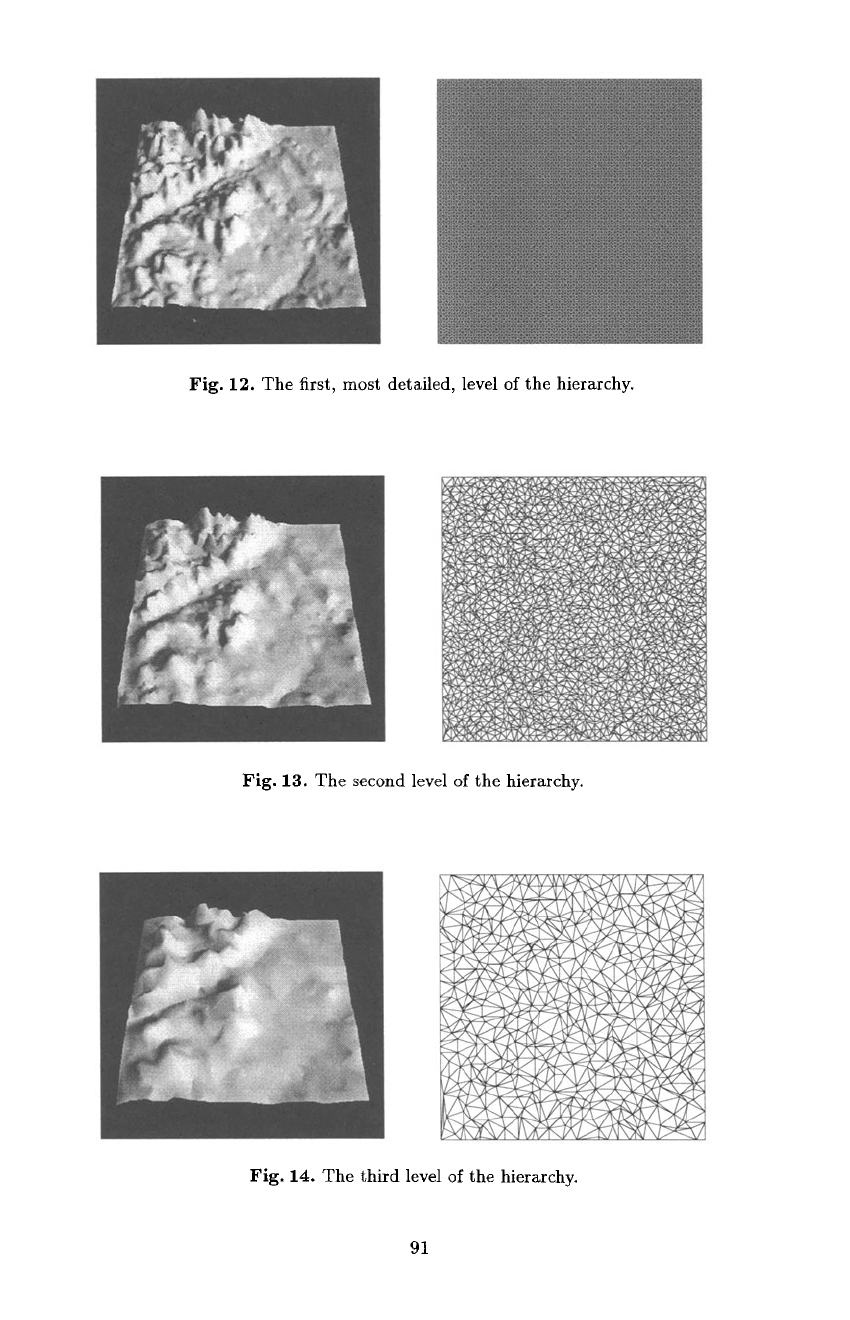
Fig. 12. The first, most detailed, level of the hierarchy.
Fig. 13. The second level of the hierarchy.
Fig. 14. The third level of the hierarchy.
91
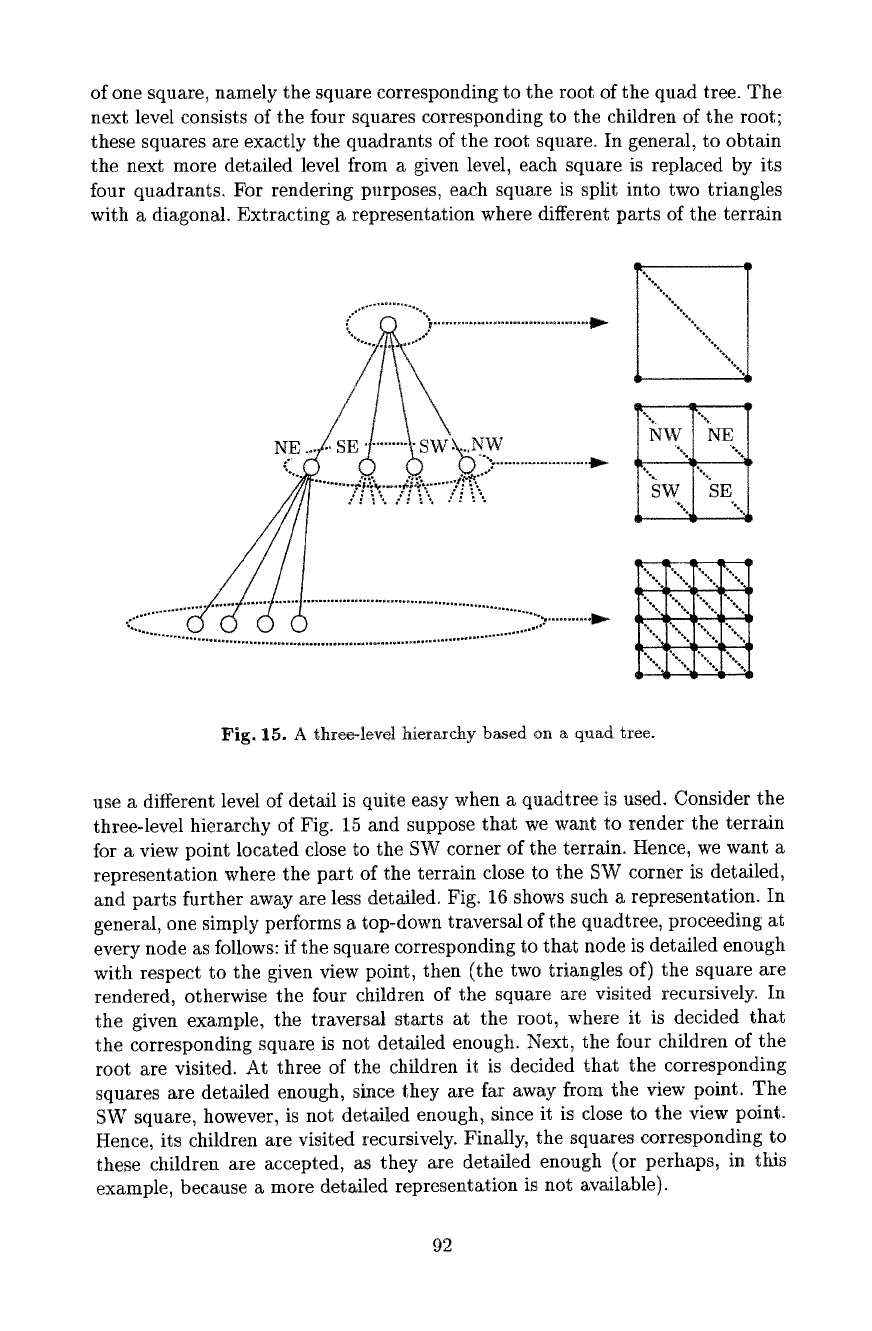
of one square, namely the square corresponding to the root of the quad tree. The
next level consists of the four squares corresponding to the children of the root;
these squares are exactly the quadrants of the root square. In general, to obtain
the next more detailed level from a given level, each square is replaced by its
four quadrants. For rendering purposes, each square is split into two triangles
with a diagonal. Extracting a representation where different parts of the terrain
"" ......... """"""""t
mmdo g~ *~t~mm
~mlm m~ml dj~
i".( i"...i ?"..i ."'--..
Fig. 15. A three-level hierarchy based on a quad tree.
use a different level of detail is quite easy when a quadtree is used. Consider the
three-level hierarchy of Fig. 15 and suppose that we want to render the terrain
for a view point located close to the SW corner of the terrain. Hence, we want a
representation where the part of the terrain close to the SW corner is detailed,
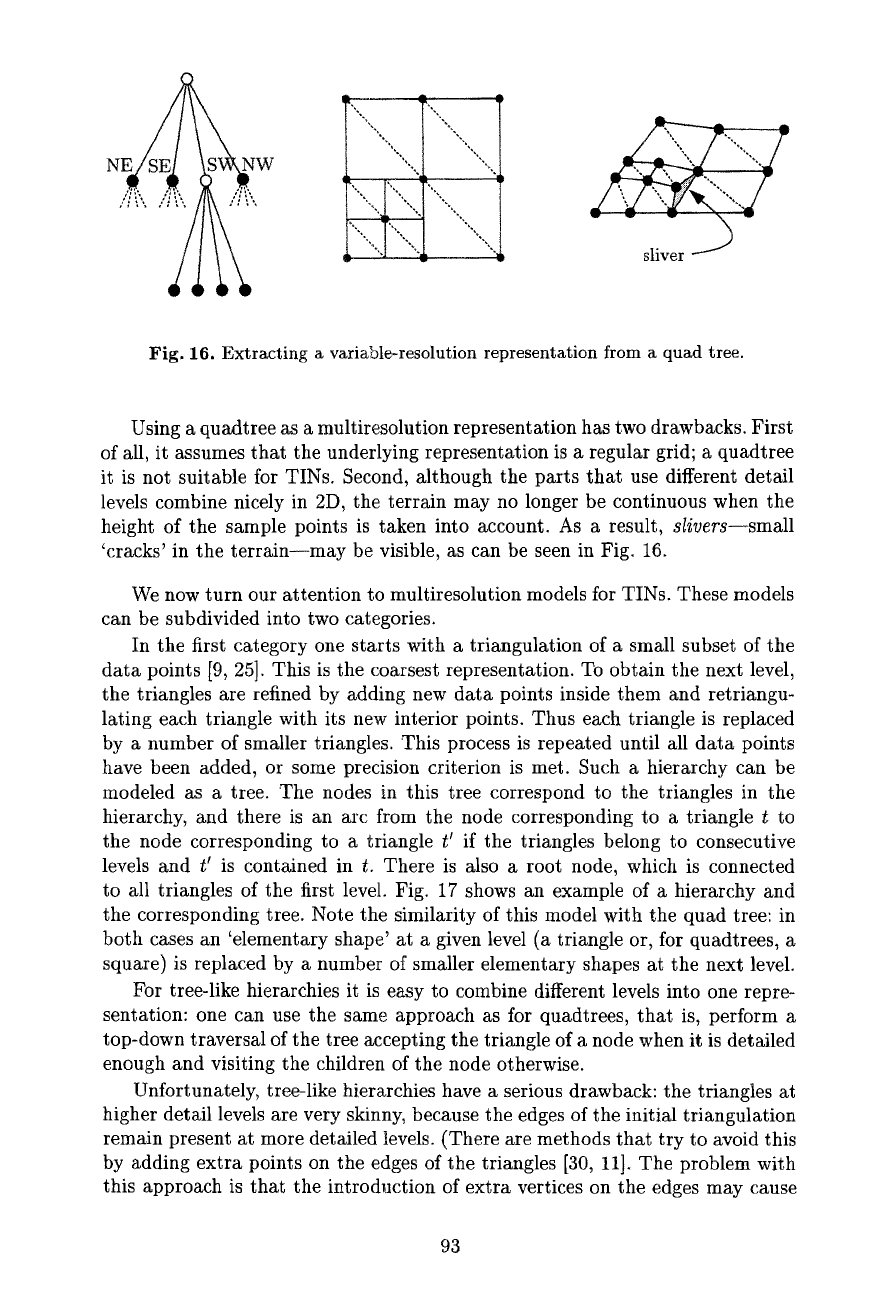
and parts further away are less detailed. Fig. 16 shows such a representation. In
generM, one simply performs a top-down traversal of the quadtree, proceeding at
every node as follows: if the square corresponding to that node is detailed enough
with respect to the given view point, then (the two triangles of) the square are
rendered, otherwise the four children of the square are visited recursively. In
the given example, the traversal starts at the root, where it is decided that
the corresponding square is not detailed enough. Next, the four children of the
root are visited. At three of the children it is decided that the corresponding
squares are detailed enough, since they are far away from the view point. The
SW square, however, is not detailed enough, since it is close to the view point.
Hence, its children are visited recursively. Finally, the squares corresponding to
these children are accepted, a~ they are detailed enough (or perhaps, in this
example, because a more detailed representation is not available).
92
/. ',:,,, :.': .',,,
sliver -~
Fig. 16. Extracting a variable-resolution representation from a quad tree.
Using a quadtree as a multiresolution representation has two drawbacks. First
of all, it assumes that the underlying representation is a regular grid; a quadtree
it is not suitable for TINs. Second, although the parts that use different detail
levels combine nicely in 2D, the terrain may no longer be continuous when the
height of the sample points is taken into account. As a result,
slivers--small
'cracks' in the terrain--may be visible, as can be seen in Fig. 16.
We now turn our attention to multiresolution models for TINs. These models
can be subdivided into two categories.
In the first category one starts with a triangulation of a small subset of the
data points [9, 25]. This is the coarsest representation. To obtain the next level,
the triangles are refined by adding new data points inside them and retriangu-
lating each triangle with its new interior points. Thus each triangle is replaced
by a number of smaller triangles. This process is repeated until M1 data points
have been added, or some precision criterion is met. Such a hierarchy can be
modeled as a tree. The nodes in this tree correspond to the triangles in the
hierarchy, and there is an arc from the node corresponding to a triangle t to
the node corresponding to a triangle t ~ if the triangles belong to consecutive
levels and t I is contained in t. There is also a root node, which is connected
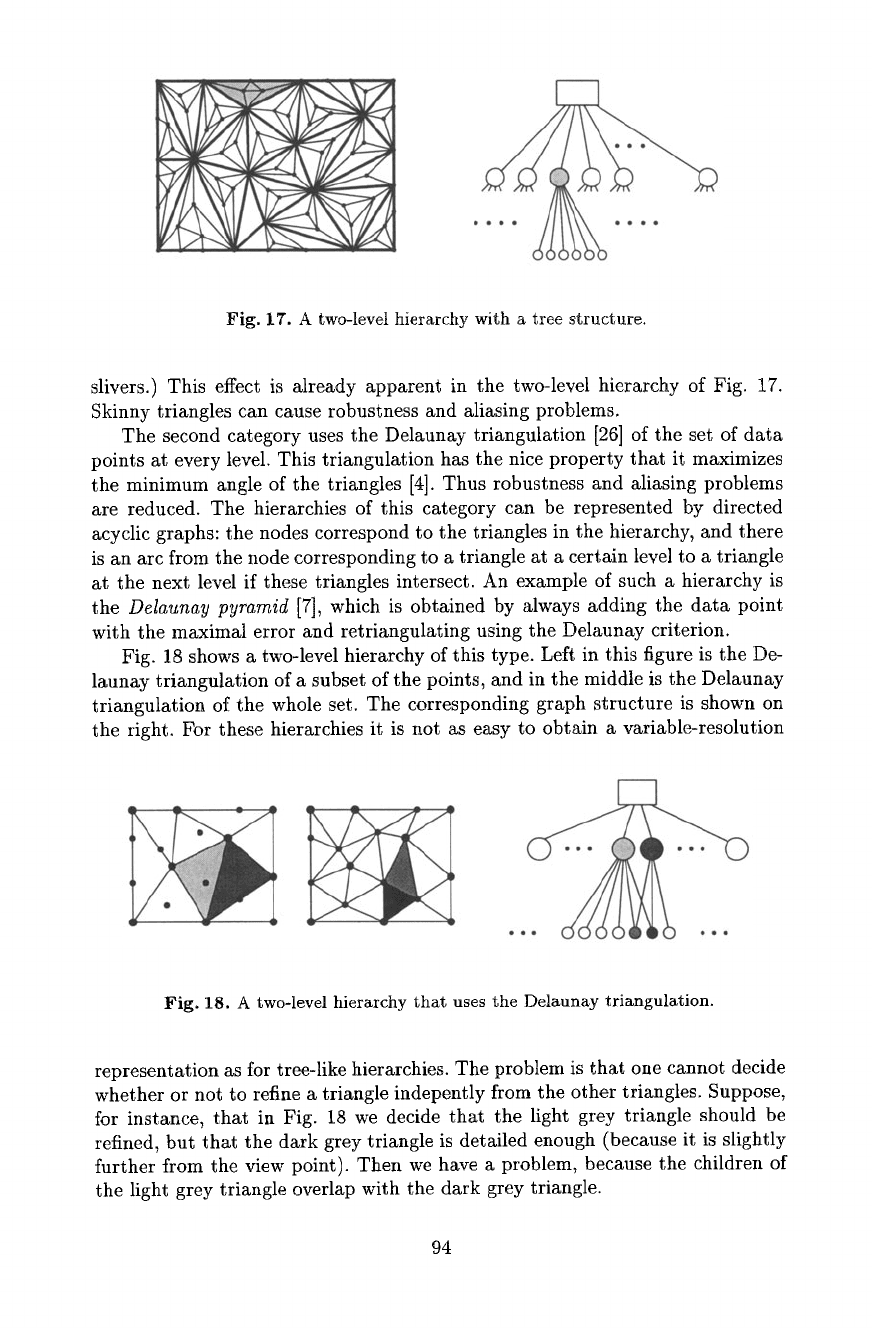
to all triangles of the first level. Fig. 17 shows an example of a hierarchy and
the corresponding tree. Note the similarity of this model with the quad tree: in
both cases an 'elementary shape' at a given level (a triangle or, for quadtrees, a
square) is replaced by a number of smaller elementary shapes at the next level.
For tree-like hierarchies it is easy to combine different levels into one repre-
sentation: one can use the same approach as for quadtrees, that is, perform a
top-down traversat of the tree accepting the triangle of a node when it is detailed
enough and visiting the children of the node otherwise.
Unfortunately, tree-like hierarchies have a serious drawback: the triangles at
higher detail levels are very skinny, because the edges of the initial triangulation
remain present at more detailed levels. (There are methods that try to avoid this
by adding extra points on the edges of the triangles [30, 11]. The problem with
this approach is that the introduction of extra vertices on the edges may cause
93
@
Fig. 17". A two-level hierarchy with a tree structure.
slivers.) This effect is Mready apparent in the two-level hierarchy of Fig. 17.
Skinny triangles can cause robustness and aliasing problems.
The second category uses the Delaunay triangulation [26] of the set of data
points at every level. This triangulation has the nice property that it maximizes
the minimum angle of the triangles [4]. Thus robustness and aliasing problems
are reduced. The hierarchies of this category can be represented by directed
acyclic graphs: the nodes correspond to the triangles in the hierarchy, and there
is an arc from the node corresponding to a triangle at a certain level to a triangle
at the next level if these triangles intersect. An example of such a hierarchy is
the
Delaunay pyramid
[7], which is obtained by always adding the data point
with the maximal error and retriangutating using the Delaunay criterion.
Fig. 18 shows a two-level hierarchy of this type. Left in this figure is the De-
launay triangulation of a subset of the points, and in the middle is the Delaunay
triangulation of the whole set. The corresponding graph structure is shown on
the right. For these hierarchies it is not as easy to obtain a variable-resolution
O6~
Fig. 18. A two-level hierarchy that uses the Delaunay triangulation.
representation as for tree-like hierarchies. The problem is that one cannot decide
whether or not to refine a triangle indepently from the other triangles. Suppose,
for instance, that in Fig. 18 we decide that the light grey triangle should be
refined, but that the dark grey triangle is detailed enough (because it is slightly
further from the view point). Then we have a problem, because the children of
the light grey triangle overlap with the dark grey triangle.
94
De Berg and Dobrindt [3] have shown that if the hierarchy is constructed in a
slightly different manner, then it is still possible to extract a variable-resolution
representation. Their idea is to construct the hierarchy as follows. They start
with the most detailed level, remove a subset of the vertices and retriangutate.
The Delaunay triangulation thus obtained is the one-but-finest level of detail in
the hierarchy. To obtain the next level, another subset of vertices is removed, and
a triangulation of the remaining vertices is computed, and so on. The vertices to
be removed in a single stage must satisfy the following property: no two should
be adjacent. This means that the triangulation at a given level is obtained by
replacing several groups of triangles at the previous level with groups of fewer
triangles covering the same area--similar to tree-like hierarchies, where a single
triangle is replaced by a group of triangles covering the same area. De Berg
and Dobrindt show how to extract a variable-resolution representation, based
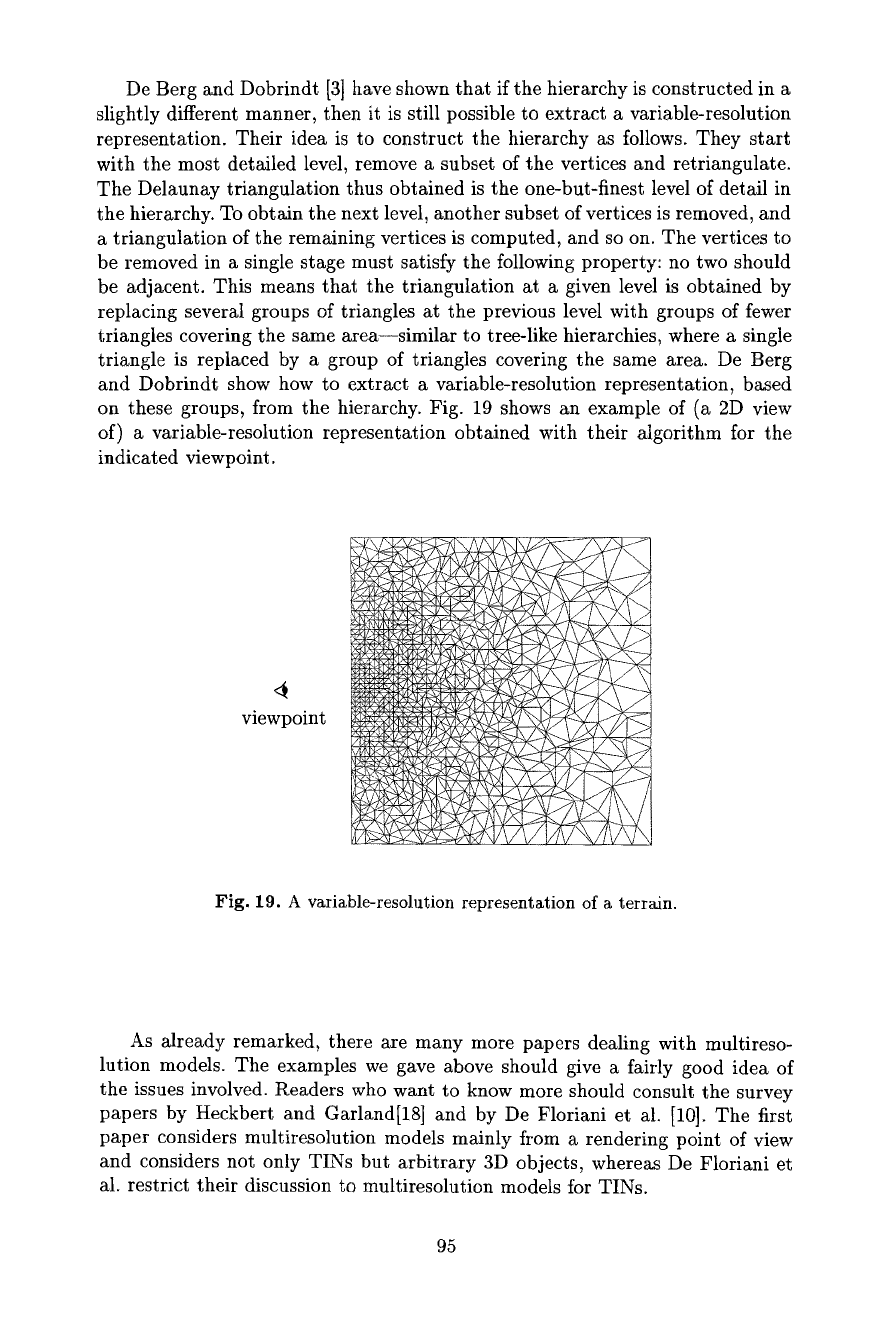
on these groups, from the hierarchy. Fig. 19 shows an example of (a 2D view
of) a variable-resolution representation obtained with their algorithm for the
indicated viewpoint.
viewpoint
Fig. 19. A variable-resolution representation of a terrain.
As already remarked, there are many more papers dealing with muttireso-
lution models. The examples we gave above should give a fairly good idea of
the issues involved. Readers who want to know more should consult the survey
papers by Heckbert and Garland[18] and by De Floriani et ai. [10]. The first
paper considers multiresolution models mainly from a rendering point of view
and considers not only TINs but arbitrary 3D objects, whereas De Floriani et
al. restrict their discussion to multiresolution models for TINs.
95
5 Other Issues
We have discussed two problems arising when one wants to visualize a TIN:
hidden-surface removal and multiresolution models. There are many more issues
that play a role, especially when one is interested in generating reMistic im-
ages of a natural terrain. In that case one needs to take lighting considerations
into account--which means, among other things, that one needs to compute
shadows--, one needs to use so-called texture mapping, or other techniques,
to make the terrain look more natural, and so on. Readers interested in these
more advanced topics should consult the general graphics literature dealing with
realistic rendering--Chapters 14-16 of
Computer Graphics: Principles and Prac-
tice
[15] are a good starting point.
Acknowledgements
Work of the author is supported by the ESPRIT IV LTR Project No. 21957
(CGAL).
References
1. P. K. Agarwal and M. Sharir.
Davenport-Schinzel Sequences and Their Geometric
Applications.
Cambridge University Press, Cambridge, UK, 1995.
2. M. de Berg.
Ray Shooting, Depth Orders and Hidden Surface Removal.
Lecture
Notes in Computer Science 703, Berlin, 1993.
3. M. de Berg and K.T. Dobrindt. On levels of detail in terrains. In
Proe. 11th Annu.
ACM Sympos. Comput. Geom.,
pages C26-C27, 1995.
4. M. de Berg, M, van Kreveld, M. Overmars,
and 0.
Schwarzkopf.
Computational
Geometry: Algorithms and Applications.
Springer-Verlag, Heidelberg, 1997.
5. Z. Chen and J. A. Guevara. System selection of very important points (VtP) from
digital terrain model for constructing triangular irregular networks. In
Proc. 8th
Internat. Sympos. Comput.-Assist. Cartog. (Auto-Carto),
pages 50-56, 1988.
6. T. H. Cormen, C. E. Leiserson, and R. L. Rivest.
Introduction to Algorithms.
The
MIT Press, Cambridge, Mass., 1990.
7. L. De Floriani. A pyramidal data structure for triangle-based surface representa-
tion.
IEEE Comput. Graph. Appt.,
9:67-78, March 1989.
8. L. De Floria~i, B. Falcidieno, G. Nagy, and Co Pienovi. On sorting triangles in a
Delaunay tessellation.
Atgorithmica,
6:522-532, 1991.
9. L. De Floriani, B. Falcidieno, G. Nagy, and C. Pienovi. Hierarchical structure for
surface approximation.
Comput. Graph. (UK),
8(2):183-193, 1984.
10. L. De Floriani, P. Marzano, and E. Puppo. Hierarchical terrain models: Survey
and formalization. In
Proe. ACM Sympos. Applied Comput.,
1994.
11. L. De Floriani and E. Puppo. A hierarchical triangle-based model for terrain
description. In
Proc. Internat. Conf. GtS: Theory and Methods of Spatio-temporal
Reasoning in Geographic Space~
Lecture Notes in Computer Science, pages 236-
251. Springer-Verlag, 1992.
12. F. D~vai. Quadratic bounds for hidden line elimination. In
Proc. 2nd Annu. ACM
Sympos. Comput. Geom.,
pages 269-275, 1986.
96
13. S. E. Dorward. A survey of object-space hidden surface removal. Internat. J.
Comput. Geom. Appt., 4:325-362, 1994.
14. Nira Dyn, David Levin, and Samuel Rippa. Data dependent triangulations for
piecewise linear interpolation, tMA Journal of Numerical Analysis, 10:137-154,
1990.
15. J. D. Foley, A. van Dam, S. K. Feiner, and J. F. Hughes. Computer Graphics:
Principles and Practice. Addison-Wesley, Reading, MA, 1990.
16. R. :l. Fowler and J. J. Little. Automatic extraction of irregular network digital
terrain models. Comput. Graph., 13(2):199-207, August 1979.
17. H. Fuchs, Z. M. Kedem, and B. Naylor. On visible surface generation by a priori
tree structures. Comput. Graph., 14(3):t24-133, 1980. Proc. SIGGRAPH '80.
18. P. S. Heckbert and M. Garland. Multiresolution modeling for fast rendering. In
Proe. Graphics Interface '94, pages 43-50. Canadian Inf. Proc. Soc., 1994.
19. H. Hoppe, T. DeRose, T. Duchamp, J. McDonald, and W. Stuetzle. Mesh opti-
mization. In Proe. SIGGRAPH '93, pages 19-26, 1993.
20. M. J. Katz, M. H. Overmars, and M. Sharir. Efficient hidden surface removal for
objects with small union size. Comput. Geom. Theory Appl., 2:223-234, 1992.
21. J. Lee. A drop heuristic conversion method for extracting irregular networks for
digital elevation models. In Proe. of GIS/LIS '89, pages 30-39, 1989.
22. M. McKenna. Worst-case optimM hidden-surface removal. ACM Trans. Graph.,
6:19-28, 1987.
23. M.E. Newell, R.G. Newell, and T.L. Sancha. A solution to the hidden surface
problem. In Proe. ACM Natl. Conf., pages 443-450, 1972.
24. Michael F. Polls and David M. McKeown, Jr. Issues in iterative TIN generation to
support large scMe simulations. Proe. of 11th Intl. Syrup. on Computer Assisted
Cartography, 1993.
25. J. Ponce and O. Faugeras. An object centered hierarchical representation for 3d
objects: the prism tree. Comput. Graphics and Image Proc., 38(1):1-28, 1987.
26. F. P. Prepaxata and M. L Shamos. Computational Geometry: An Introduction.
Springer-Verlag, New York, NY, 1985.
27. J. H. Reif and S. Sen. An efficient output-sensitive hidden-surface removal algo-
rithms and its parallelization, tn Proc. 4th Annu. ACM Sympos. Comput. Geom.,
pages 193-200, 1988.
28. H. Samet. Applications of Spatial Data Structures: Computer Graphics, Image
Processing, and GIS. Addison-\¥esley, 1990.
29. H. Samet. The Design and Analysis of Spatial Data Structures. Addison-Wesley,
Reading, MA, 1990.
30. L. Scarlatos and T. Pavlidis. Adaptive hierarchical triangulation. In Proc. lOth
Internat. Sympos. Comput.-Assist. Cartog. (Auto-Carto), pages 234-246, 1990.
31. I. E. Sutherland, R. F. Sproull, and R. A. Schumacker. A characterization of ten
hidden-surface algorithms. ACM Comput. Surv., 6(1):1-55, March 1974.
97
Chapter 5.
Principles
Generalization of Spatial Data:
and Selected Algorithms
Robert Weibel
Dept. of Geography
University of Ziirich
Switzerland
weibelOgeo, unizh, ch
1 Introduction
In recent years, applications of geographic information systems (GIS) have ma-
tured, and spatial databases of considerable size have been built, and are being
built and maintained continuously. Large amounts of money and time are in-
vested into ambitious projects to build so-called spatial data infrastructures at
the national level (e.g., MSC 1993, Clinton 1994, Griinreich 1992) and at the in-
ternational level (e.g., EUROGI 1996). To enable the creation, maintenance, and
use of such vast repositories of spatial information, a variety of methodological
issues must be addressed. Besides methods for data modeling, data management
and retrieval, as well as data distribution - including, for instance, standards for
data documentation and exchange - techniques for automated generalization of
spatial data (short: generalization) are of premier importance in this context. In
GIS, generalization functions are needed for a variety of purposes, including the
creation and maintenance of spatial databases at multiple scales, cartographic
visualization at variable scales, and data reduction, to name just a few.
It is generally acknowledged that generalization is a complex process with
ill-defined objectives, involving a good deal of subjective decisions. In order
to solve the problem comprehensively, a variety of techniques including non-
algorithmic solutions such knowledge-based methods and decision support sys-
tems approaches are needed. Clearly, however, data structures and algorithms
form an indispensable foundation on which other approaches can build.
This survey presents an overview of principles, algorithms, and data struc-
tures for the generalization of spatial data. Sections 2 to 9 describe basic tech-
niques, including an introduction to the principles and concepts underlying gen-
eralization, for those who are less familiar with the topic. Sections 10 , then,
99
attempts to analyze what is wrong with basic generalization methods, and sec-
tions 11 to 13 discuss methods that extend the basic algorithms described in the
first part and overcome some of their functional weaknesses. Other compilations
of recent research in generalization can be found in Buttenfield and McMaster
(1991), M/iller et al. (1995a) and Weibel (1995a), and Molenaar (1996a).
2 What is Generalization and V~Thy Does It Matter?
2.1 The Issue of Scale Change
Map generalization is a key element of cartography. Traditionally, spatial phe-
nomena are cartographically portrayed on maps at different scales and for dif-
ferent purposes (e.g., topographic maps, geological maps, hiking maps, road
maps). National topographic maps, for instance, are commonly produced at a
series of scales 1, such as 1:25,000, 1:50,000, 1:100,000, 1:250,000, 1:500,000, and
1:1,000,000. The map scale is typically halved at each step in such a series (e.g.,
from 1:25,000 to 1:50,000). At the same time, the space available for drawing on
the target map is divided by four, meaning that there is only a quarter of the
space left to present the same amount of information as on the source map.
At the same time, as the
map scale
is reduced, small map objects may ap-
proach the limits of visual perceptibility. These perceptibility limits are termed
minimum dimensions
in cartography and are said to be, for instance, 0.35 mm
for the length of sides of a black square (e.g., used to symbolize a building), or
0.25 mm for the distance between double lines which are often used to symbolize
roads (SSC t977). So, any map objects that would fall below these thresholds,
but which the cartographer would still like to display on a map, would need
to be enlarged accordingly in order to be clearly visible and discernible on the
resulting map image. For example, on a map of 1:100,000, all buildings which
have sidelengths smaller than 35 m - the vast majority of single family homes -
would need to be enlarged to that minimum size. The same problem occurs with
road objects; most roads are narrower than 25 m on the ground. So, to summa-
rize, when reducing the scale of a map we are facing two problems which have
a cumulative effect: available physical space on the map is reduced, and many
objects may need to be enlarged in order to still remain visible. Both problems
lead to a competition for available space among map objects. This situation is
illustrated in Figure 1, which also depicts the necessary consequences. Only a
subset of the original objects of the source map can be displayed on the target
map and some objects may need to be displaced in order to avoid overlaps. This
illustration, although schematic, also clearly show's why a mere photographic
reduction would got be sufficient.
1 Map
scale
is defined as the size ratio between an object (feature) in reality and its
graphical representation on the map. Map scales with larger scale denominators (e.g.,
1:500~000) are cMled 'small scMes' in cartography, because they map everything to a
small display area. Conversely, scales with smaller denominators (e.g., 1:10,000) are
termed 'large scales'.
t00
