Stewart J. Calculus
Подождите немного. Документ загружается.

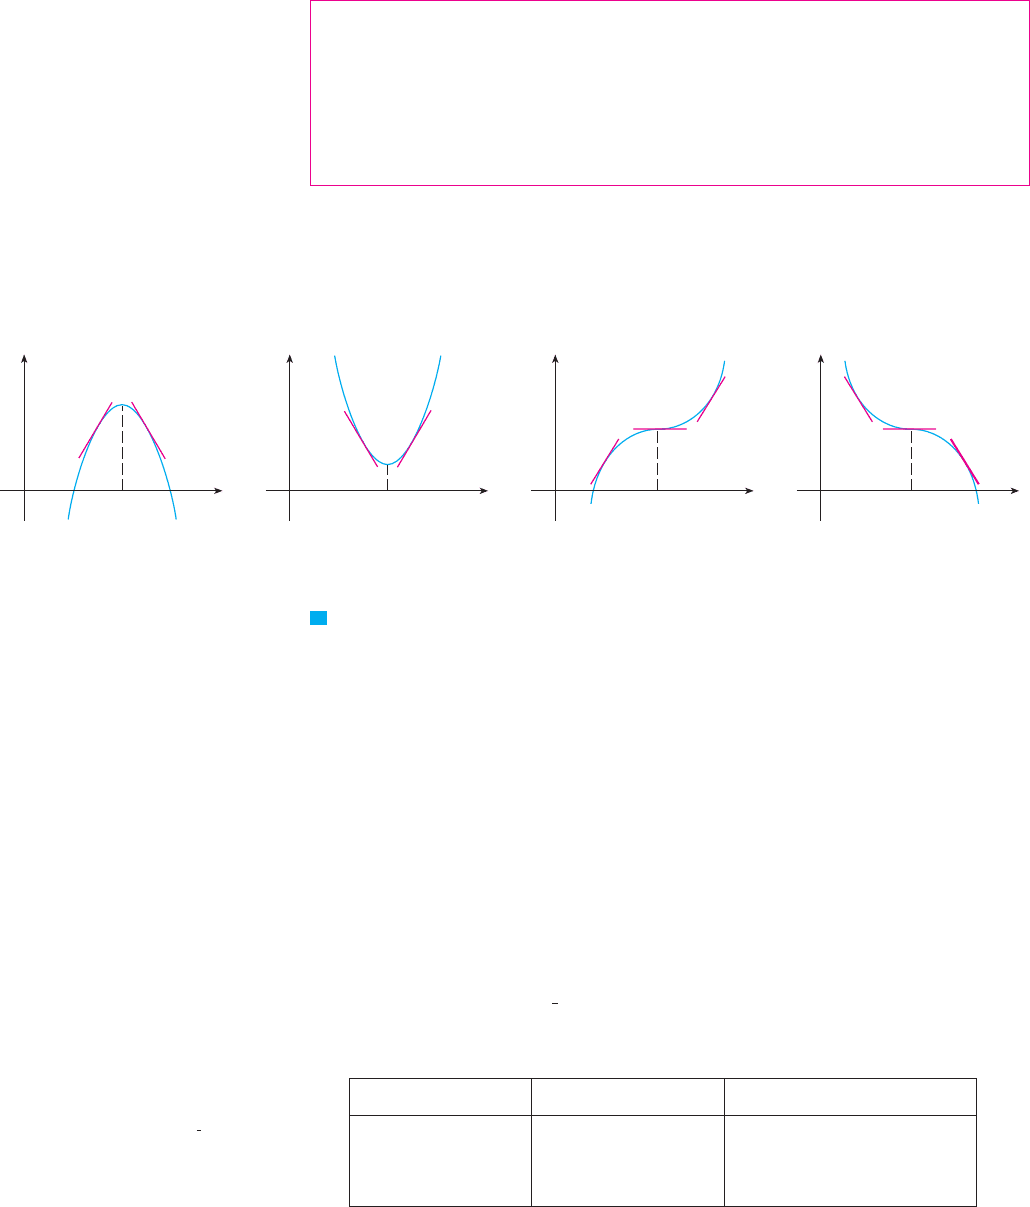
THE FIRST DERIVATIVE TEST Suppose that is a critical number of a continuous
function .
(a) If changes from positive to negative at , then has a local maximum at .
(b) If changes from negative to positive at , then has a local minimum at .
(c) If does not change sign at (for example, if is positive on both sides of c
or negative on both sides), then has no local maximum or minimum at .
The First Derivative Test is a consequence of the I'D Test. In part (a), for instance, since
the sign of changes from positive to negative at c, is increasing to the left of c and
decreasing to the right of c. It follows that has a local maximum at c.
It is easy to remember the First Derivative Test by visualizing diagrams such as those
in Figure 3.
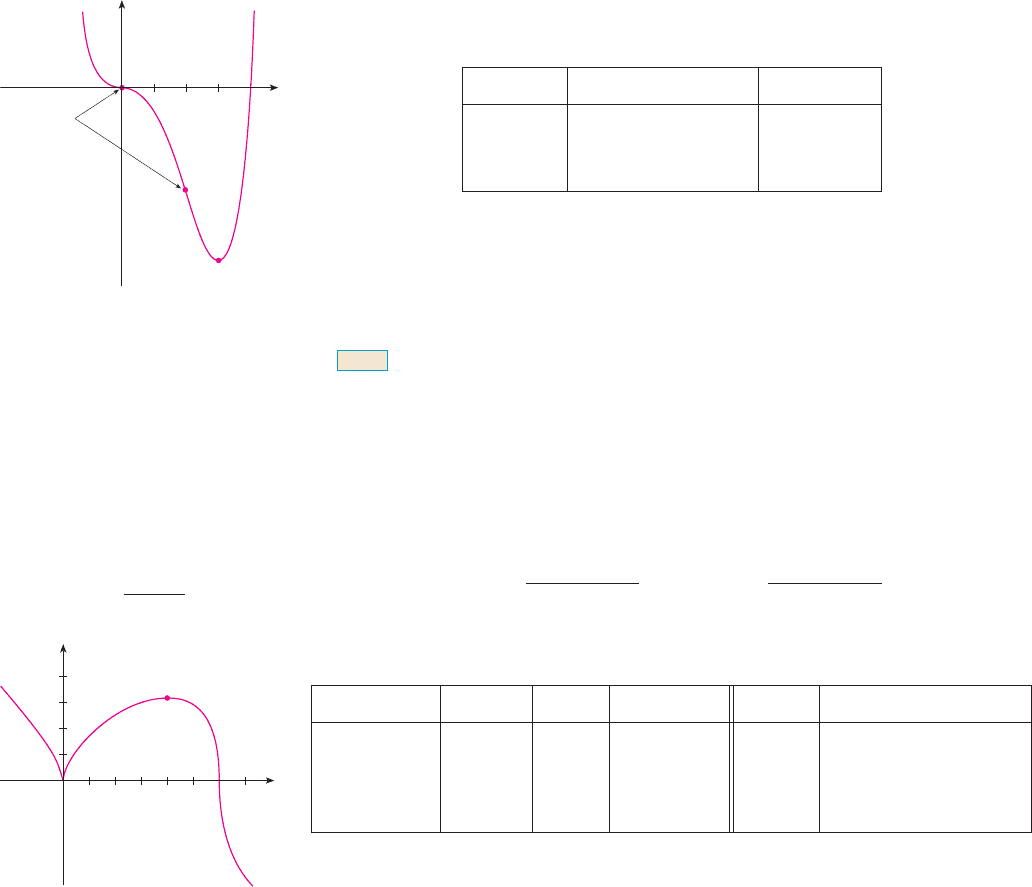
EXAMPLE 2 Find the local minimum and maximum values of the function f in
Example 1.
SOLUTION From the chart in the solution to Example 1 we see that changes from neg-
ative to positive at #1, so is a local minimum value by the First Derivative
Test. Similarly, changes from negative to positive at 2, so is also a local
minimum value. As previously noted, is a local maximum value because
changes from positive to negative at 0.
M
EXAMPLE 3 Find the local maximum and minimum values of the function
SOLUTION To find the critical numbers of , we differentiate:
So when . The solutions of this equation are and .
Because is differentiable everywhere, the only critical numbers are and
and so we analyze in the following table.t
4
&
'32
&
'3t
4
&
'32
&
'3cos x ! #
1
2
t'"x# ! 0
t'"x# ! 1 % 2 cos x
t
0 , x , 2
&
t"x# ! x % 2 sin x
f '"x#f "0# ! 5
f "2# ! #27f '
f "#1# ! 0
f '"x#
V
F I G U R E 3
0
x
y
c
fª(x)>0 fª(x)<0
(a) Local maximum
c
0
x
y
fª(x)<0
fª(x)<0
(d) No maximum or minimum(c) No maximum or minimum
c
0
x
y
fª(x)>0
fª(x)>0
c
0
x
y
fª(x)<0 fª(x)>0
(b) Local minimum
f
ff '"x#
cf
f 'cf '
cfcf '
cfcf '
f
c
222
|| ||
CHAPTER 4 APPLICATIONS OF DIFFERENTIATION
Interval
% increasing on
# decreasing on
% increasing on "4
&
'3, 2
&
# 4
&
'3
*
x
*
2
&
"2
&
'3, 4
&
'3# 2
&
'3
*
x
*
4
&
'3
"0, 2
&
'3# 0
*
x
*
2
&
'3
tt'"x# ! 1 % 2 cos x
N The + signs in the table come from the fact
that when . From the
graph of , this is true in the indicated
intervals.
y ! cos x
cos x ) #
1
2
t'"x# ) 0
Because changes from positive to negative at , the First Derivative Test tells us
that there is a local maximum at and the local maximum value is
Likewise, changes from negative to positive at and so
is a local minimum value. The graph of in Figure 4 supports our conclusion. M
WHAT DOES SAY A B O U T ?
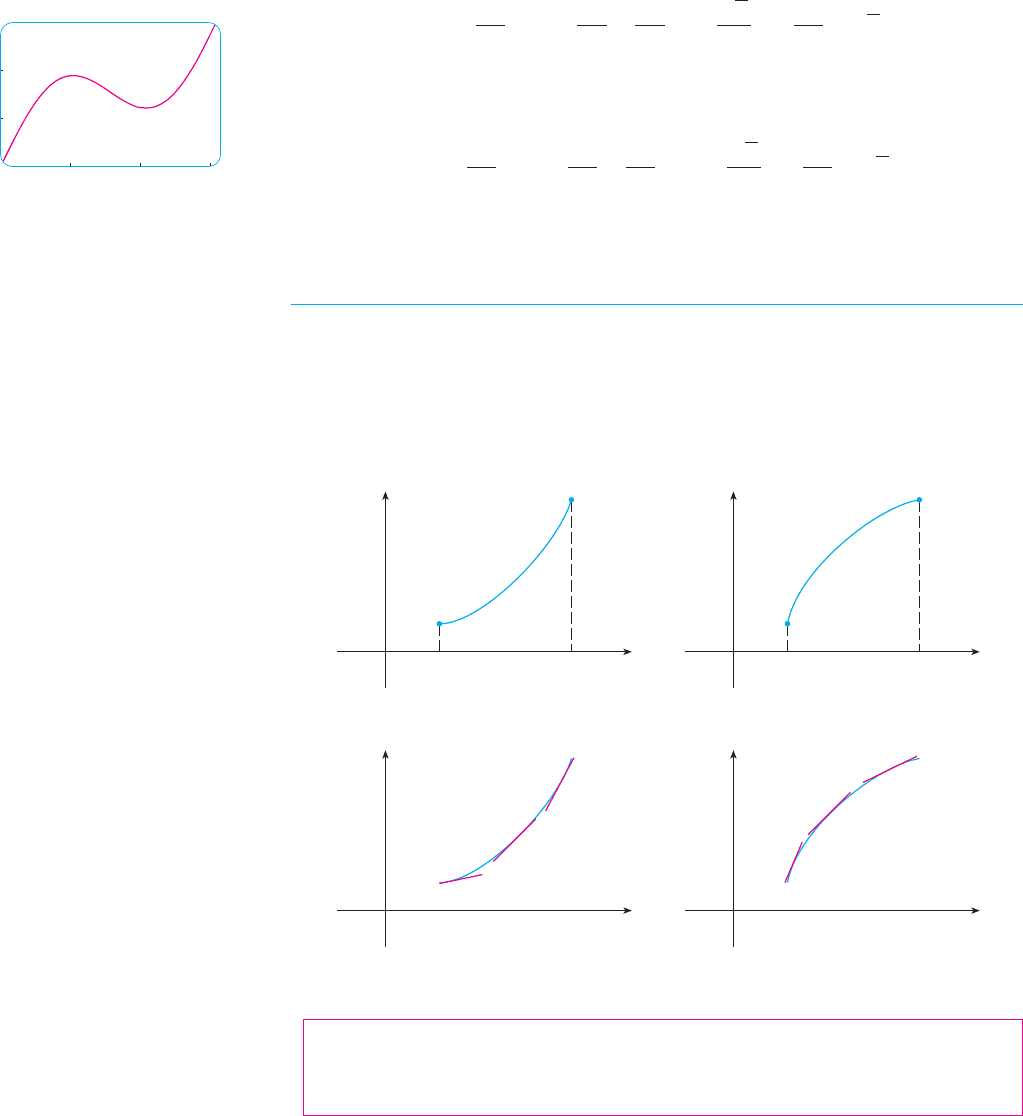
Figure 5 shows the graphs of two increasing functions on . Both graphs join point
to point but they look different because they bend in different directions. How can we
distinguish between these two types of behavior? In Figure 6 tangents to these curves have
been drawn at several points. In (a) the curve lies above the tangents and is called con-
cave upward on . In (b) the curve lies below the tangents and is called concave
downward on .
DEFINITION If the graph of lies above all of its tangents on an interval , then it
is called concave upward on . If the graph of lies below all of its tangents on I,
it is called concave downward on .I
fI
If
F I G U R E 5
F I G U R E 6
a b
f
A
B
x
y
0
a b
g
A
B
x
y
0
g
A
B
x
y
0
f
A
B
x
y
0
(a) (b)
(a) Concave upward (b) Concave downward
"a, b#
t"a, b#
f
B
A"a, b#
ff .
t
t"4
&
'3# !
4
&
3
% 2 sin
4
&
3
!
4
&
3
% 2
,
#
s
3
2
-
!
4
&
3
#
s
3
$ 2.46
4
&
'3t'"x#
t"2
&
'3# !
2
&
3
% 2 sin
2
&
3
!
2
&
3
% 2
,
s
3
2
-
!
2
&
3
%
s
3
$ 3.83
2
&
'3
2
&
'3t'"x#
SECTION 4.3 HOW DERIVATIVES AFFECT THE SHAPE OF A GRAPH
|| ||
223
F I G U R E 4
y=x+2sinx
6
0
2π
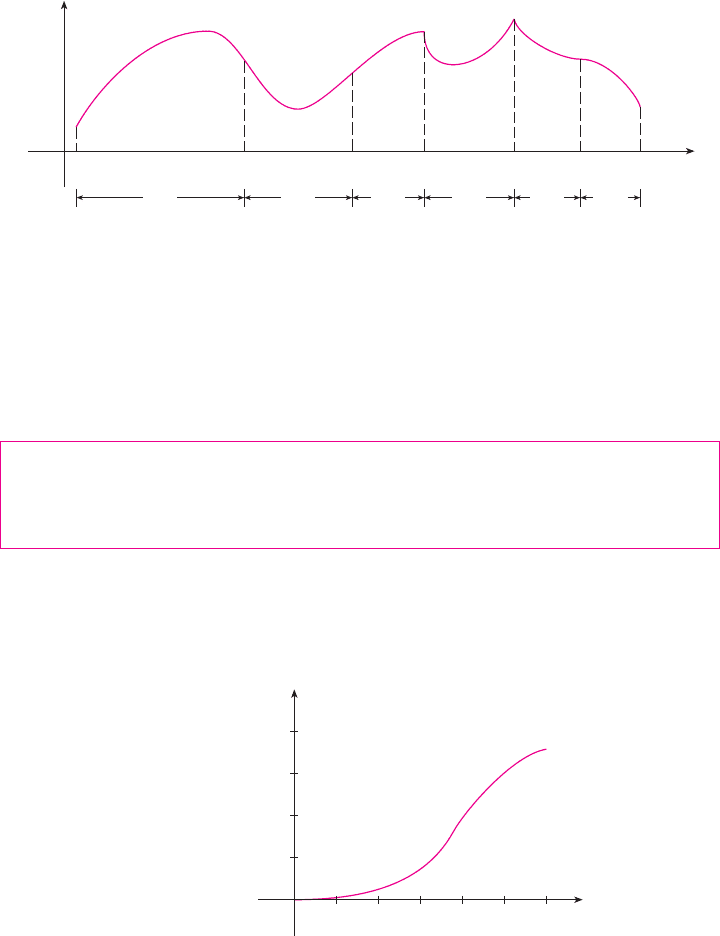
Figure 7 shows the graph of a function that is concave upward (abbreviated CU) on the
intervals , , and and concave downward (CD) on the intervals , ,
and .
Let’s see how the second derivative helps determine the intervals of concavity. Looking
at Figure 6(a), you can see that, going from left to right, the slope of the tangent increases.
This means that the derivative is an increasing function and therefore its derivative
is positive. Likewise, in Figure 6(b) the slope of the tangent decreases from left to right,
so decreases and therefore is negative. This reasoning can be reversed and suggests
that the following theorem is true. A proof is given in Appendix F with the help of the
Mean Value Theorem.
CONCAVITY TEST
(a) If for all in , then the graph of is concave upward on .
(b) If for all in , then the graph of is concave downward on .
EXAMPLE 4 Figure 8 shows a population graph for Cyprian honeybees raised in an
apiary. How does the rate of population increase change over time? When is this rate
highest? Over what intervals is P concave upward or concave downward?
SOLUTION By looking at the slope of the curve as t increases, we see that the rate of
increase of the population is initially very small, then gets larger until it reaches a maxi-
mum at about t ! 12 weeks, and decreases as the population begins to level off. As the
population approaches its maximum value of about 75,000 (called the carrying capac-
ity), the rate of increase, , approaches 0. The curve appears to be concave upward on
(0, 12) and concave downward on (12, 18). M
P!!t"
t
P
3
20
0
Time (in weeks)
6 9 12 15
40
60
80
Number of bees
(in thousands)
18
F I G U R E 8
IfIxf "!x"
#
0
IfIxf "!x" $ 0
f "f !
f "f !
F I G U R E 7
a b c d e p q
B
C
D
P
x
y
0
CD CU CD CU CDCU
!p, q"
!c, d"!a, b"!e, p"!d, e"!b, c"
224
|| ||
CHAPTER 4 APPLICATIONS OF DIFFERENTIATION
In Example 4, the population curve changed from concave upward to concave down-
ward at approximately the point (12, 38,000). This point is called an inflection point of the
curve. The significance of this point is that the rate of population increase has its maximum
value there. In general, an inflection point is a point where a curve changes its direction of
concavity.
DEFINITION A point on a curve is called an inflection point if is
continuous there and the curve changes from concave upward to concave down-
ward or from concave downward to concave upward at .
For instance, in Figure 7, , and are the points of inflection. Notice that if a
curve has a tangent at a point of inflection, then the curve crosses its tangent there.
In view of the Concavity Test, there is a point of inflection at any point where the sec-
ond derivative changes sign.
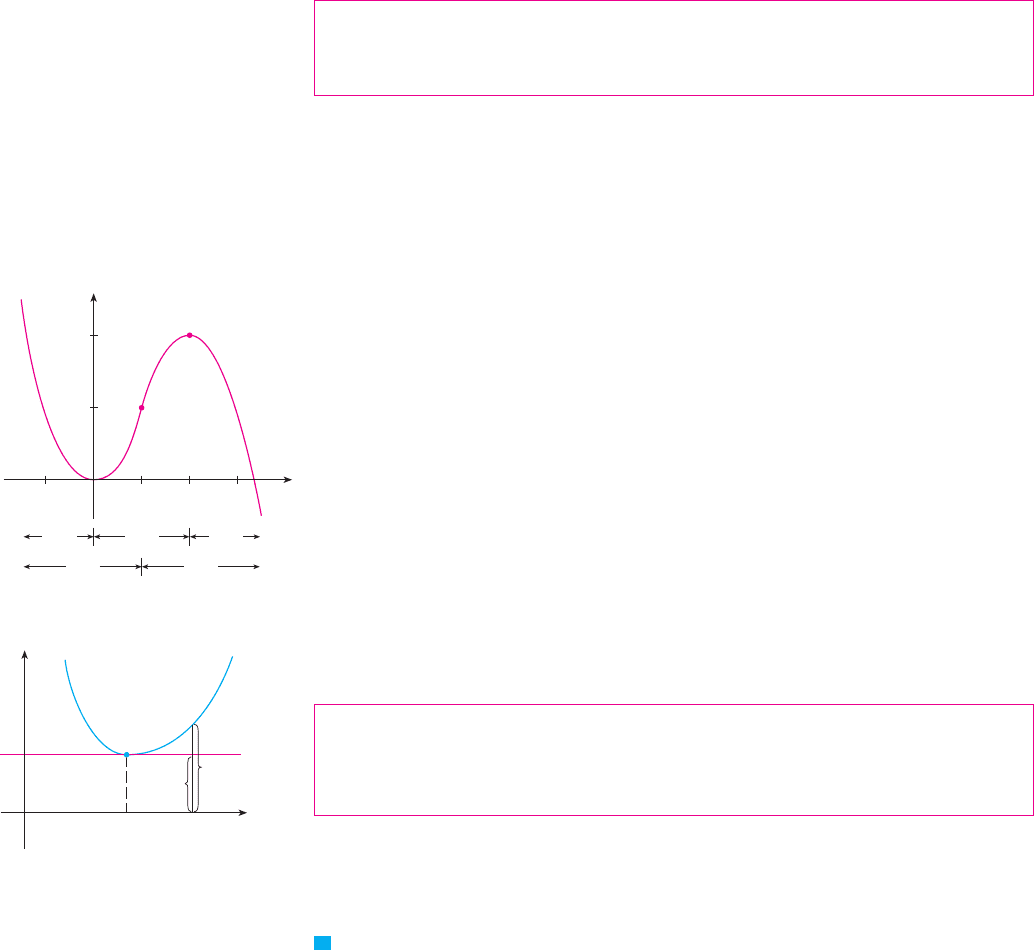
EXAMPLE 5 Sketch a possible graph of a function that satisfies the following
conditions:
SOLUTION Condition (i) tells us that the graph has horizontal tangents at the points
and . Condition (ii) says that f is increasing on the interval and decreasing on
the intervals and . It follows from the I / D Test that is a local
minimum and is a local maximum.
Condition (iii) says that the graph is concave upward on the interval and
concave downward on . Because the curve changes from concave upward to con-
cave downward when , the point is an inflection point.
We use this information to sketch the graph of f in Figure 9. Notice that we made the
curve bend upward when and bend downward when . M
Another application of the second derivative is the following test for maximum and
minimum values. It is a consequence of the Concavity Test.
THE SECOND DERIVATIVE TEST Suppose is continuous near .
(a) If and , then has a local minimum at .
(b) If and , then has a local maximum at .
For instance, part (a) is true because near c and so is concave upward near
c. This means that the graph of lies above its horizontal tangent at c and so has a local
minimum at c. (See Figure 10.)
EXAMPLE 6 Discuss the curve with respect to concavity, points of
inflection, and local maxima and minima. Use this information to sketch the curve.
SOLUTION If , then
f "!x" ! 12x
2
% 24x ! 12x!x % 2"
f !!x" ! 4x
3
% 12x
2
! 4x
2
!x % 3"
f !x" ! x
4
% 4x
3
y ! x
4
% 4x
3
V
ff
ff "!x" $ 0
cff "!c"
#
0f !!c" ! 0
cff "!c" $ 0f !!c" ! 0
cf "
x $ 2x
#
2
!2, 3"x ! 2
!2, &"
!%&, 2"
f !4" ! 6
f !0" ! 0!4, &"!%&, 0"
!0, 4"!4, 6"
!0, 0"
!iii" f "!
x" $ 0 for x
#
2, f "!x"
#
0 for x $ 2
!ii" f !!x" $ 0 for 0
#
x
#
4, f !!x"
#
0 for x
#
0 and for x $ 4
(i" f !0" ! 0, f !2" ! 3, f !4" ! 6, f !!0" ! f !!4" ! 0
f
PB, C, D
P
fy ! f !x"P
SECTION 4.3 HOW DERIVATIVES AFFECT THE SHAPE OF A GRAPH
|| ||
225
y
x
0
3
2 4
(4,6)
6
(2,3)
CU CD
dec inc dec
F I G U R E 9
fª(c)=0
f(c)
ƒ
c
P
x
x
y
0
F I G U R E 1 0
f·(c)>0, f is concave upward
f
To find the critical numbers we set and obtain and . To use the
Second Derivative Test we evaluate at these critical numbers:
Since and , is a local minimum. Since , the
Second Derivative Test gives no information about the critical number 0. But since
for and also for , the First Derivative Test tells us that does
not have a local maximum or minimum at 0. [In fact, the expression for shows that
f decreases to the left of 3 and increases to the right of 3.]
Since when or , we divide the real line into intervals with these
numbers as endpoints and complete the following chart.
The point is an inflection point since the curve changes from concave upward to
concave downward there. Also, is an inflection point since the curve changes
from concave downward to concave upward there.
Using the local minimum, the intervals of concavity, and the inflection points, we
sketch the curve in Figure 11. M
The Second Derivative Test is inconclusive when . In other words, at
such a point there might be a maximum, there might be a minimum, or there might be nei-
ther (as in Example 6). This test also fails when does not exist. In such cases the First
Derivative Test must be used. In fact, even when both tests apply, the First Derivative Test
is often the easier one to use.
EXAMPLE 7 Sketch the graph of the function .
SOLUTION You can use the differentiation rules to check that the first two derivatives are
Since when and does not exist when or , the critical
numbers are , and .
To find the local extreme values we use the First Derivative Test. Since changes
from negative to positive at 0, is a local minimum. Since changes from
positive to negative at 4, is a local maximum. The sign of does not change f !f !4" ! 2
5#3
f !f !0" ! 0
f !
60, 4
x ! 6x ! 0f !!x"x ! 4f !!x" ! 0
f "!x" !
%8
x
4#3
!6 % x"
5#3
f !!x" !
4 % x
x
1#3
!6 % x"
2#3
f !x" ! x
2#3
!6 % x"
1#3
f "!c"
f "!c" ! 0
NOTE
!2, %16"
!0, 0"
2x ! 0f "!x" ! 0
f !!x"
f0
#
x
#
3x
#
0f !!x"
#
0
f "!0" ! 0f !3" ! %27f "!3" $ 0f !!3" ! 0
f "!3" ! 36 $ 0f "!0" ! 0
f "
x ! 3x ! 0f !!x" ! 0
226
|| ||
CHAPTER 4 APPLICATIONS OF DIFFERENTIATION
Interval Concavity
(%&, 0) ' upward
(0, 2) % downward
(2, &) ' upward
f "!x" ! 12x!x % 2"
F I G U R E 1 1
x
y
2 3
(2,_16)
(3,_27)
y=x$-4˛
inflection
points
(0,0)
Interval 4 % x f
' % ' % decreasing on (%&, 0)
' ' ' ' increasing on (0, 4)
% ' ' % decreasing on (4, 6)
% ' ' % decreasing on (6, &) x $ 6
4
#
x
#
6
0
#
x
#
4
x
#
0
f !!x"!6 % x"
2#3
x
1#3
F I G U R E 1 2
y
x
0
2
3
4
1 2 3 4 5 7
(4,2%?#)
y=x@?#(6-x)!?#
N Try reproducing the graph in Figure 12
with a graphing calculator or computer. Some
machines produce the complete graph, some
produce only the portion to the right of the
-axis, and some produce only the portion
between and . For an explanation
and cure, see Example 7 in Section 1.4. An
equivalent expression that gives the correct
graph is
y ! !x
2
"
1#3
!
6 % x
$
6 % x
$
$
6 % x
$
1#3
x ! 6x ! 0
y
at 6, so there is no minimum or maximum there. (The Second Derivative Test could be
used at 4, but not at 0 or 6 since does not exist at either of these numbers.)
Looking at the expression for and noting that for all , we have
for and for and for . So is concave down-
ward on and and concave upward on , and the only inflection point
is . The graph is sketched in Figure 12. Note that the curve has vertical tangents at
and because as and as .
M
x l 6x l 0
$
f !!x"
$
l &!6, 0"!0, 0"
!6, 0"
!6, &"!0, 6"!%&, 0"
fx $ 6f "!x" $ 00
#
x
#
6x
#
0f "!x"
#
0
xx
4#3
( 0f "!x"
f "
SECTION 4.3 HOW DERIVATIVES AFFECT THE SHAPE OF A GRAPH
|| ||
227
In Module 4.3 you can practice using
graphical information about to determine
the shape of the graph of .f
f !
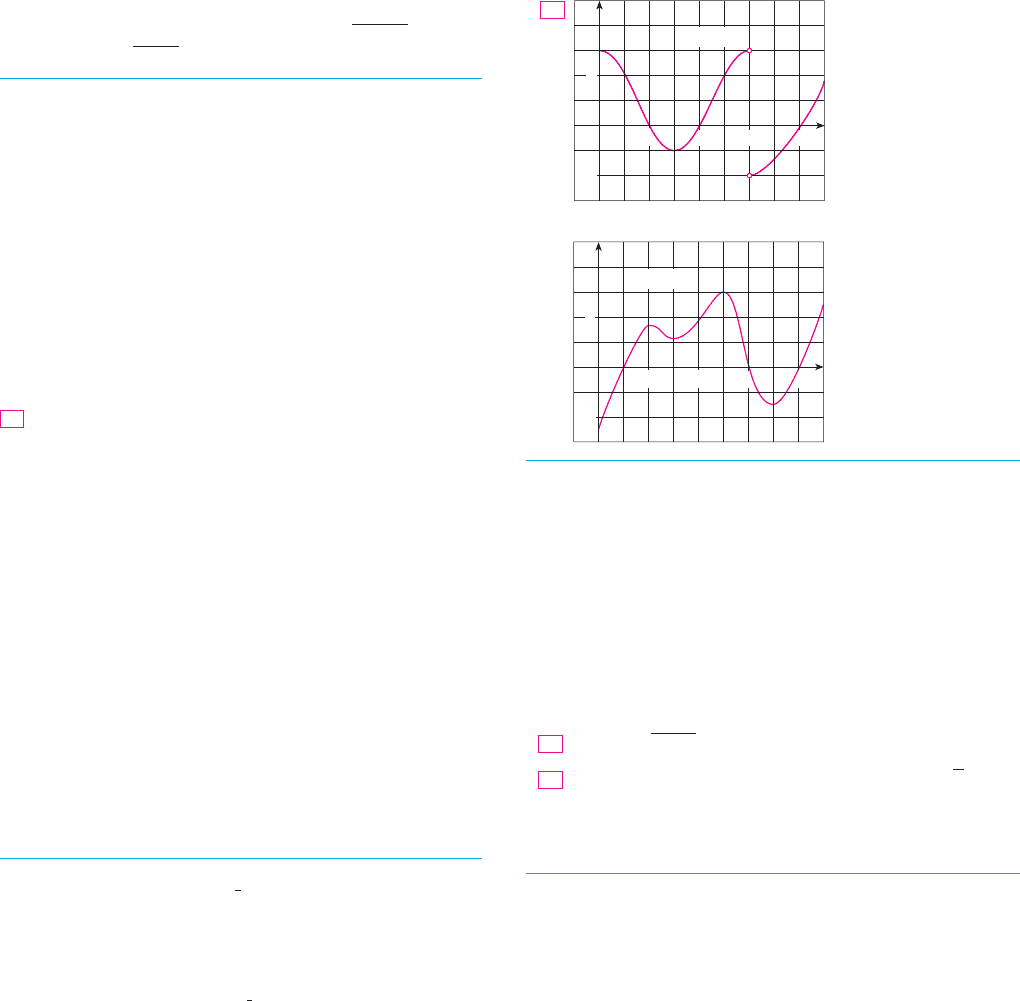
TE C
The graph of the second derivative of a function is
shown. State the -coordinates of the inflection points of .
Give reasons for your answers.
8. The graph of the first derivative of a function is shown.
(a) On what intervals is increasing? Explain.
(b) At what values of does have a local maximum or
minimum? Explain.
(c) On what intervals is concave upward or concave down-
ward? Explain.
(d) What are the -coordinates of the inflection points of ?
Why?
9–14
(a) Find the intervals on which is increasing or decreasing.
(b) Find the local maximum and minimum values of .
(c) Find the intervals of concavity and the inflection points.
9.
10.
12.
13.
1
4.
,
0 ) x ) 2
*
f !x" ! cos
2
x % 2 sin x
f !x" ! sin x ' cos x, 0 ) x ) 2
*
f !x" !
x
2
x
2
' 3
f !x" ! x
4
% 2x
2
' 3
11.
f !x" ! 4x
3
' 3x
2
% 6x ' 1
f !x" ! 2x
3
' 3x
2
% 36x
f
f
3
y
0
x
5 71 9
y=fª(x)
fx
f
fx
f
ff !
y=f·(x)
2
y
0
x
4 6 8
fx
ff "
7.
1–2 Use the given graph of to find the following.
(a) The open intervals on which is increasing.
(b) The open intervals on which is decreasing.
(c) The open intervals on which is concave upward.
(d) The open intervals on which is concave downward.
(e) The coordinates of the points of inflection.
1. 2.
3. Suppose you are given a formula for a function .
(a) How do you determine where is increasing or
decreasing?
(b) How do you determine where the graph of is concave
upward or concave downward?
(c) How do you locate inflection points?
4. (a) State the First Derivative Test.
(b) State the Second Derivative Test. Under what circum-
stances is it inconclusive? What do you do if it fails?
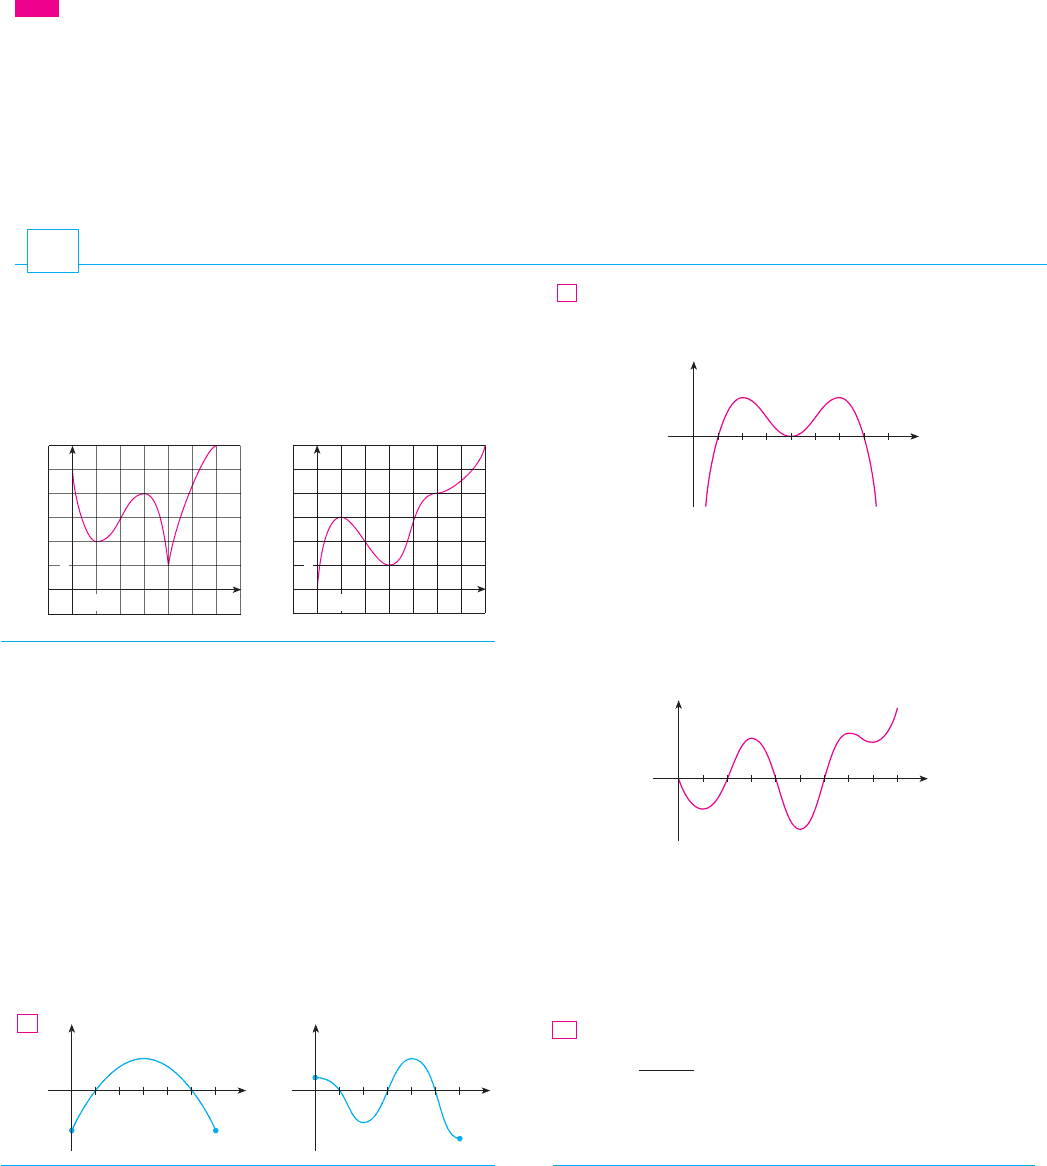
5–6 The graph of the derivative of a function is shown.
(a) On what intervals is increasing or decreasing?
(b) At what values of x does have a local maximum or
minimum?
6.
2 4 6
x
y
0
y=fª(x)
2 4 6
x
y
0
y=fª(x)
5.
f
f
ff !
f
f
f
y
0 x
1
1
y
0 x
1
1
f
f
f
f
f
E X E R C I S E S
4.3
228
|| ||
CHAPTER 4 APPLICATIONS OF DIFFERENTIATION
(d) State the x-coordinate(s) of the point(s) of inflection.
(e) Assuming that , sketch a graph of f.
28.
29– 40
(a) Find the intervals of increase or decrease.
(b) Find the local maximum and minimum values.
(c) Find the intervals of concavity and the inflection points.
(d) Use the information from parts (a)–(c) to sketch the graph.
Check your work with a graphing device if you have one.
29. 30.
31. 32.
33. 34.
36.
38.
39.
,
40. ,
41. Suppose the derivative of a function is
. On what interval is
increasing?
42. Use the methods of this section to sketch the curve
, where is a positive constant. What
do the members of this family of curves have in common?
How do they differ from each other?
;
43– 44
(a) Use a graph of to estimate the maximum and minimum
values. Then find the exact values.
f
ay ! x
3
% 3a
2
x ' 2a
3
ff !!x" ! !x ' 1"
2
!x % 3"
5
!x % 6"
4
f
%2
*
) t ) 2
*
f!t" ! t ' cos t
0 )
+
) 2
*
f !
+
" ! 2 cos
+
' cos
2
+
G!x" ! x % 4
s
x
C!x" ! x
1#3
!x ' 4"
37.
B!x" ! 3x
2#3
% xA!x" ! x
s
x ' 3
35.
h!x" ! x
5
% 2 x
3
' xh!x" ! !x ' 1"
5
% 5x % 2
t!x" ! 200 ' 8x
3
' x
4
f !x" ! 2 ' 2x
2
% x
4
f !x" ! 2 ' 3x % x
3
f !x" ! 2x
3
% 3x
2
% 12x
y
0
x
2 4 6 8
_2
y=fª(x)
2
2 4 6 8
y
0
x
_2
y=fª(x)
2
27.
f !0" ! 0
15–17 Find the local maximum and minimum values of using
both the First and Second Derivative Tests. Which method do you
prefer?
15. 16.
17.
18. (a) Find the critical numbers of .
(b) What does the Second Derivative Test tell you about the
behavior of at these critical numbers?
(c) What does the First Derivative Test tell you?
19. Suppose is continuous on .
(a) If and , what can you say about ?
(b) If and , what can you say about ?
20 – 25 Sketch the graph of a function that satisfies all of the
given conditions.
20. for all , vertical asymptote ,
if or , if
,
if or ,
if or ,
if , if or
22. , if ,
if , if ,
if , inflection point
23. if , if ,
, , if
24. ,
if or ,
if or ,
if
or
,
if
or
,
25. and for all
26. Suppose , and and
for all .
(a) Sketch a possible graph for .
(b) How many solutions does the equation have?
Why?
(c) Is it possible that ? Why?
27–28 The graph of the derivative of a continuous function
is shown.
(a) On what intervals is increasing or decreasing?
(b) At what values of x does have a local maximum or
minimum?
(c) On what intervals is concave upward or downward?f
f
f
ff !
f !!2" !
1
3
f !x" ! 0
f
x
f "!x"
#
0f !!x" $ 0f !3" ! 2, f !!3" !
1
2
xf "!x"
#
0f !!x"
#
0
f !%x" ! f !x"x $ 51
#
x
#
3f "!x"
#
0
3
#
x
#
50
#
x
#
1f "!x" $ 0
x $ 62
#
x
#
4f !!x"
#
0
4
#
x
#
60
#
x
#
2f !!x" $ 0
f !0" ! f !!0" ! f
!!2" ! f !!4" ! f !!6" ! 0
x " 2f "!x" $ 0lim
x
l
2
$
f !!x"
$
! &f !!%2" ! 0
$
x
$
$ 2f !!x"
#
0
$
x
$
#
2f !!x" $ 0
!0, 1"%2
#
x
#
0f "!x"
#
0
$
x
$
$ 2f !!x" ! %11
#
$
x
$
#
2f !!x" $ 0
$
x
$
#
1f !!x"
#
0f !!1" ! f !!%1" ! 0
x $ 3x
#
1f "!x"
#
01
#
x
#
3f "!x" $ 0
x $ 40
#
x
#
2f !!x"
#
0
2
#
x
#
4x
#
0f !!x" $ 0
f !!0" ! f !!2" ! f !!4" ! 0
21.
1
#
x
#
3f "!x"
#
0x $ 3x
#
1f "!x" $ 0
x ! 1x " 1f !!x" $ 0
ff "!6" ! 0f !!6" ! 0
ff "!2" ! %5f !!2" ! 0
!%&, &"f "
f
f !x" ! x
4
!x % 1"
3
f !x" ! x '
s
1 % x
f !x" !
x
x
2
' 4
f !x" ! x
5
% 5x ' 3
f
SECTION 4.3 HOW DERIVATIVES AFFECT THE SHAPE OF A GRAPH
|| ||
229
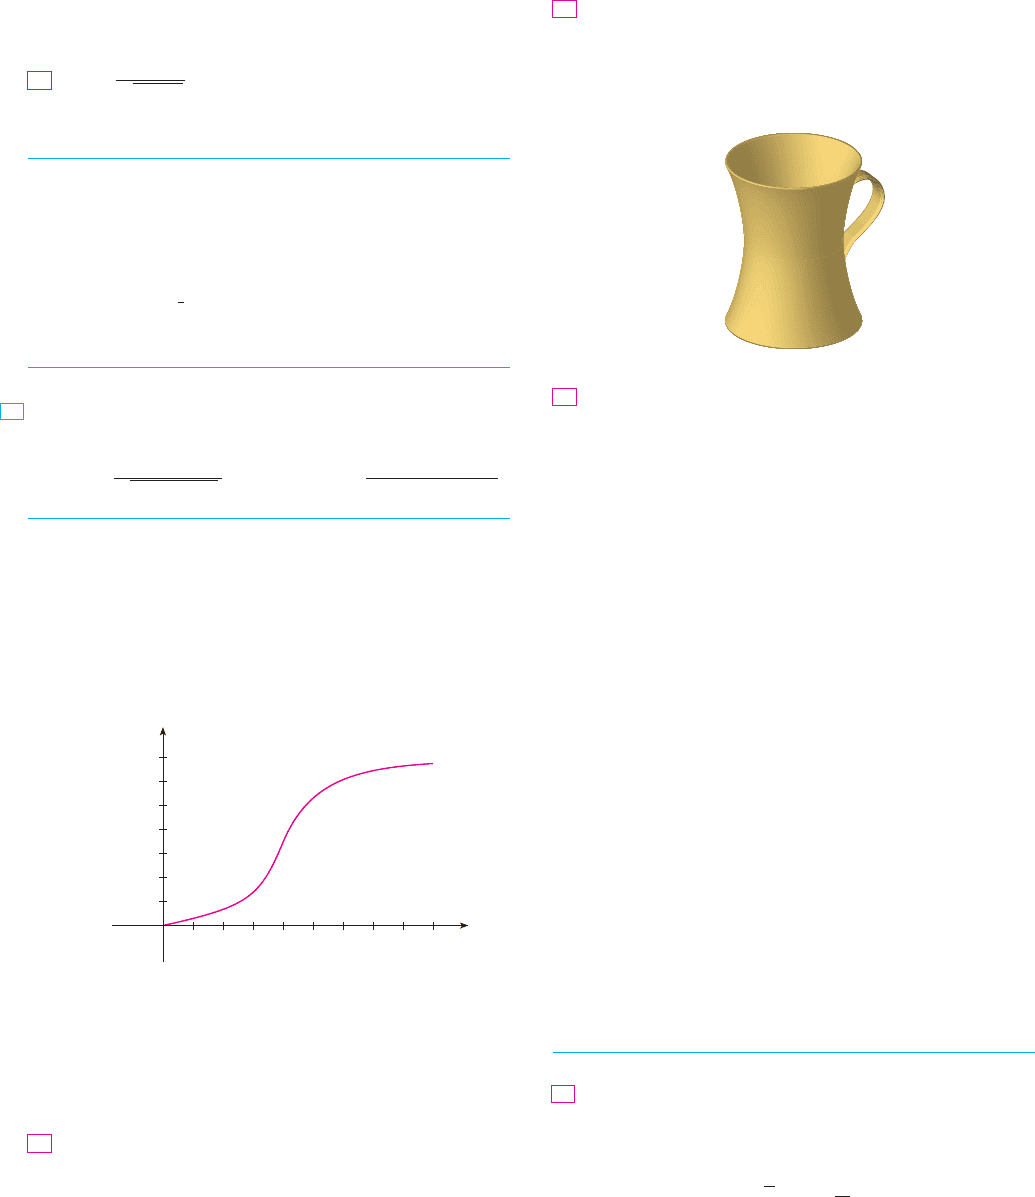
Coffee is being poured into the mug shown in the figure at a
constant rate (measured in volume per unit time). Sketch a
rough graph of the depth of the coffee in the mug as a func-
tion of time. Account for the shape of the graph in terms of
concavity. What is the significance of the inflection point?
Find a cubic function that has a
local maximum value of at and a local minimum value
of 0 at 1.
54. Show that the curve has three points
of inflection and they all lie on one straight line.
55. Suppose is differentiable on an interval and for
all numbers in except for a single number . Prove that
is increasing on the entire interval .
56 – 58 Assume that all of the functions are twice differentiable
and the second derivatives are never 0.
56. (a) If and are concave upward on , show that is
concave upward on .
(b) If is positive and concave upward on , show that the
function is concave upward on .
57. (a) If and are positive, increasing, concave upward func-
tions on , show that the product function is concave
upward on .
(b) Show that part (a) remains true if and are both
decreasing.
(c) Suppose is increasing and is decreasing. Show, by
giving three examples, that may be concave upward,
concave downward, or linear. Why doesn’t the argument
in parts (a) and (b) work in this case?
58. Suppose and are both concave upward on .
Under what condition on will the composite function
be concave upward?
Show that for . [Hint: Show that
is increasing on .]
60. Prove that, for all ,
2
s
x
$ 3 %
1
x
x $ 1
!0,
*
#2"f !x" ! tan x % x
0
#
x
#
*
#2tan x $ x
59.
h!x" ! f ! t!x""
f
!%&, &"tf
ft
tf
tf
I
ftI
tf
It!x" ! % f !x"&
2
If
I
f ' tItf
I
fcIx
f !!x" $ 0If
y ! !1 ' x"#!1 ' x
2
"
%23
f !x" ! ax
3
' bx
2
' cx ' d
53.
52.
(b) Estimate the value of at which increases most rapidly.
Then find the exact value.
44. ,
;
45– 46
(a) Use a graph of to give a rough estimate of the intervals of
concavity and the coordinates of the points of inflection.
(b) Use a graph of to give better estimates.
45. ,
46.
47– 48 Estimate the intervals of concavity to one decimal place
by using a computer algebra system to compute and graph .
47. 48.
49. A graph of a population of yeast cells in a new laboratory
culture as a function of time is shown.
(a) Describe how the rate of population increase varies.
(b) When is this rate highest?
(c) On what intervals is the population function concave
upward or downward?
(d) Estimate the coordinates of the inflection point.
50. Let be the temperature at time where you live and sup-
pose that at time you feel uncomfortably hot. How do
you feel about the given data in each case?
(a) (b)
(c) (d)
Let be a measure of the knowledge you gain by studying
for a test for t hours. Which do you think is larger,
or ? Is the graph of K concave
upward or concave downward? Why?
K!3" % K!2"K!8" % K!7"
K!t"
51.
f !!3" ! %2, f "!3" ! %4f !!3" ! %2, f "!3" ! 4
f !!3" ! 2, f "!3" ! %4f !!3" ! 2, f "!3" ! 4
t ! 3
tf !t"
2 6 10 14 184 8 12 16
0
Time (in hours)
Number
of
yeast cells
100
200
300
400
500
600
700
f !x" !
!x ' 1"
3
!x
2
' 5"
!x
3
' 1"!x
2
' 4"
f !x" !
x
4
' x
3
' 1
s
x
2
' x ' 1
f "
CAS
f !x" ! x
3
!x % 2"
4
0 ) x ) 2
*
f !x" ! cos x '
1
2
cos 2x
f "
f
0 ) x ) 2
*
f !x" ! x ' 2 cos x
f !x" !
x ' 1
s
x
2
' 1
43.
fx
66. Suppose that is continuous and , but
. Does have a local maximum or minimum at ?
Does have a point of inflection at ?
67. The three cases in the First Derivative Test cover the
situations one commonly encounters but do not exhaust all
possibilities. Consider the functions whose values
at 0 are all 0 and, for
(a) Show that 0 is a critical number of all three functions but
their derivatives change sign infinitely often on both sides
of 0.
(b) Show that has neither a local maximum nor a local mini-
mum at 0, has a local minimum, and has a local
maximum.
ht
f
h!x" ! x
4
'
%2 ' sin
1
x
(
t!x" ! x
4
'
2 ' sin
1
x
(
f!x" ! x
4
sin
1
x
x " 0,
f, t, and h
cf
cff ,!c" $ 0
f !!c" ! f "!c" ! 0f ,
61. Show that a cubic function (a third-degree polynomial)
always has exactly one point of inflection. If its graph has
three -intercepts , and , show that the -coordinate of
the inflection point is .
;
62. For what values of does the polynomial
have two inflection points? One inflec-
tion point? None? Illustrate by graphing for several values
of . How does the graph change as decreases?
63. Prove that if is a point of inflection of the graph
of and exists in an open interval that contains , then
. [Hint: Apply the First Derivative Test and
Fermat’s Theorem to the function .]
64. Show that if , then , but is not an
inflection point of the graph of .
65. Show that the function has an inflection point at
but does not exist.t"!0"!0, 0"
t!x" ! x
$
x
$
f
!0, 0"f "!0" ! 0f !x" ! x
4
t ! f !
f "!c" ! 0
cf "f
!c, f !c""
cc
P
P!x" ! x
4
' cx
3
' x
2
c
!x
1
' x
2
' x
3
"#3
xx
3
x
1
, x
2
x
230
|| ||
CHAPTER 4 APPLICATIONS OF DIFFERENTIATION
LIMITS AT INFINITY; HORIZONTAL ASYMPTOTES
In Sections 2.2 and 2.4 we investigated infinite limits and vertical asymptotes. There we
let approach a number and the result was that the values of became arbitrarily large
(positive or negative). In this section we let become arbitrarily large (positive or nega-
tive) and see what happens to . We will find it very useful to consider this so-called end
behavior when sketching graphs.
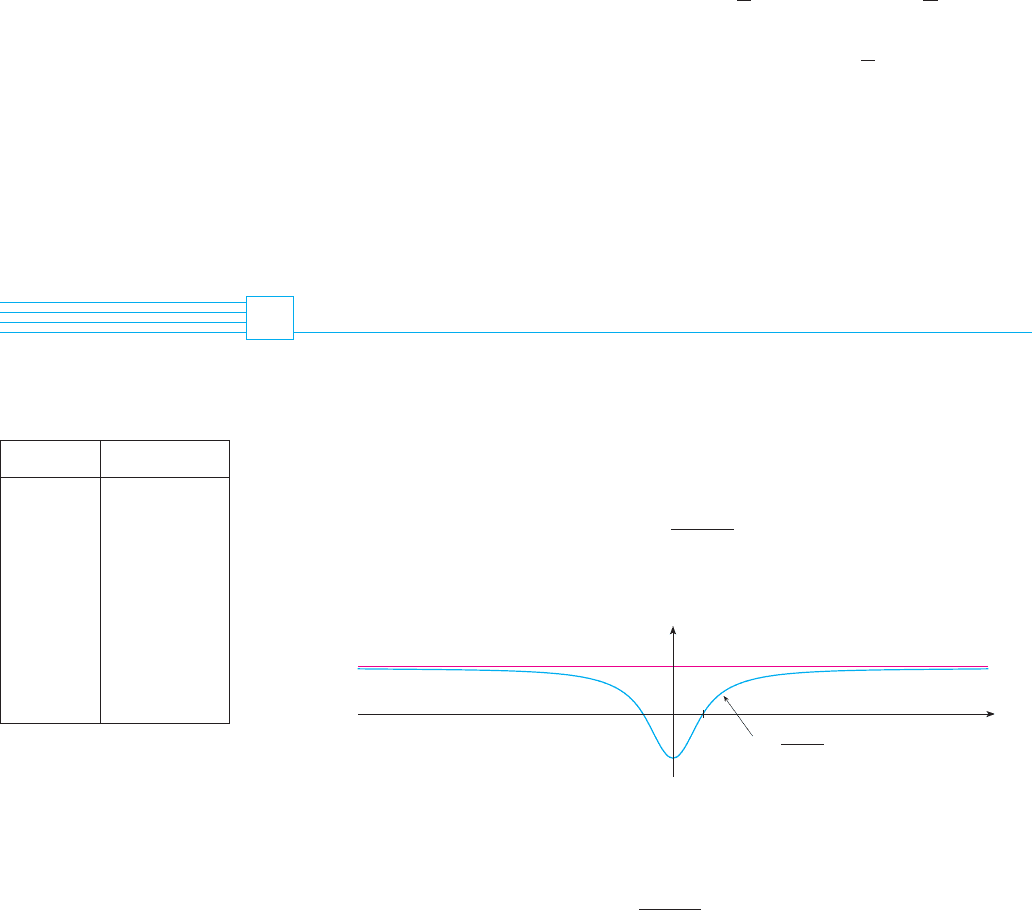
Let’s begin by investigating the behavior of the function defined by
as becomes large. The table at the left gives values of this function correct to six decimal
places, and the graph of has been drawn by a computer in Figure 1.
As grows larger and larger you can see that the values of get closer and closer
to 1. In fact, it seems that we can make the values of as close as we like to 1 by taking
sufficiently large. This situation is expressed symbolically by writing
In general, we use the notation
to indicate that the values of become closer and closer to as becomes larger and
larger.
xLf !x"
lim
x l &
f !x" ! L
lim
x l &
x
2
% 1
x
2
' 1
! 1
x
f !x"
f !x"x
x
1
0
y
y=1
y=
≈-1
≈+1
F I G U R E 1
f
x
f !x" !
x
2
% 1
x
2
' 1
f
y
x
yx
4.4
x
0 %1
0
0.600000
0.800000
0.882353
0.923077
0.980198
0.999200
0.999800
0.999998-1000
-100
-50
-10
-5
-4
-3
-2
-1
f !x"
SECTION 4.4 LIMITS AT INFINITY; HORIZONTAL ASYMPTOTES
|| ||
231
DEFINITION Let be a function defined on some interval . Then
means that the values of can be made arbitrarily close to by taking suf-
ficiently large.
Another notation for is
as
The symbol does not represent a number. Nonetheless, the expression is
often read as
“the limit of , as approaches infinity, is ”
or “the limit of , as becomes infinite, is ”
or “the limit of , as increases without bound, is ”
The meaning of such phrases is given by Definition 1. A more precise definition, similar
to the definition of Section 2.4, is given at the end of this section.
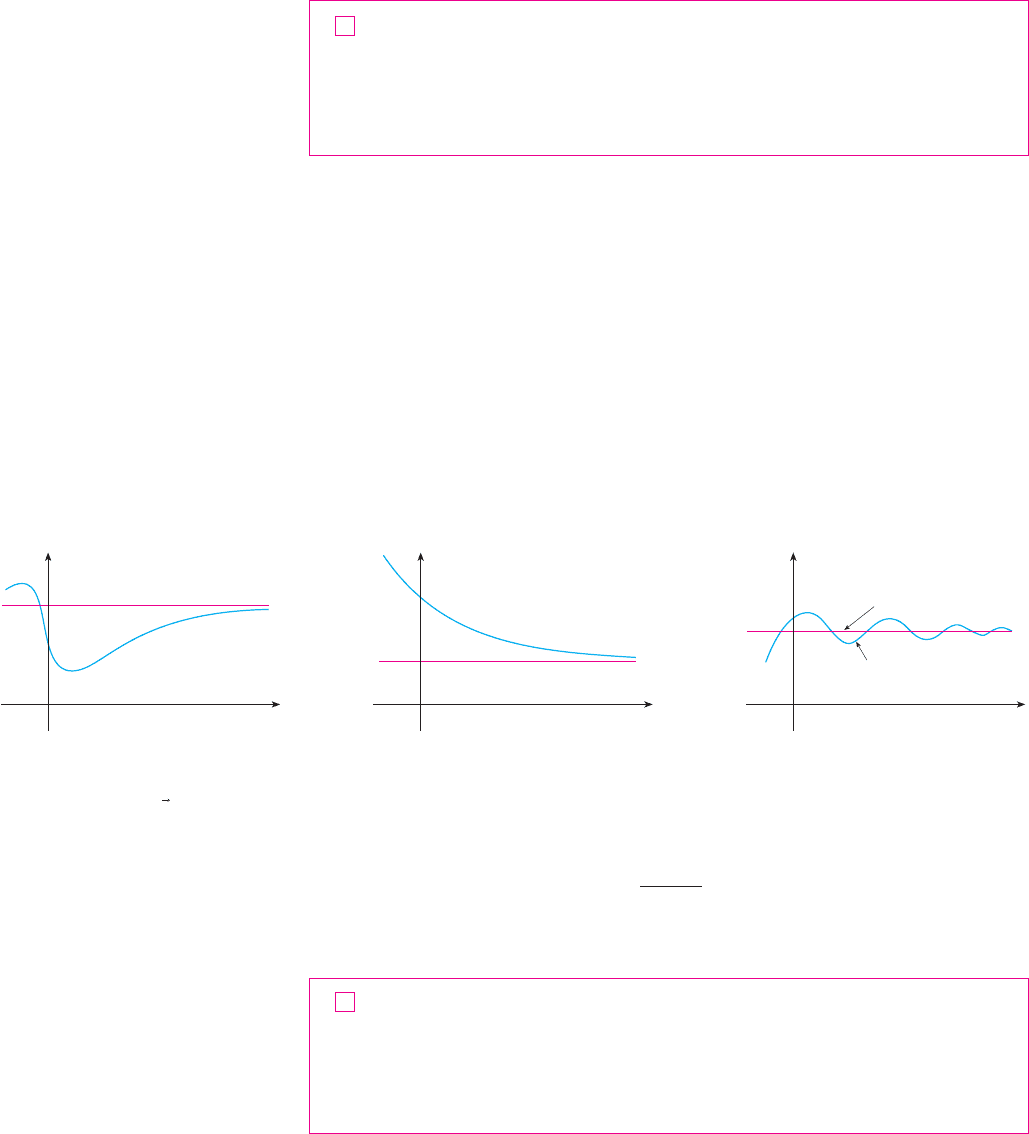
Geometric illustrations of Definition 1 are shown in Figure 2. Notice that there are
many ways for the graph of to approach the line (which is called a horizontal
asymptote) as we look to the far right of each graph.
Referring back to Figure 1, we see that for numerically large negative values of , the
values of are close to 1. By letting decrease through negative values without bound,
we can make as close as we like to 1. This is expressed by writing
The general definition is as follows.
DEFINITION Let be a function defined on some interval . Then
means that the values of can be made arbitrarily close to by taking suf-
ficiently large negative.
Again, the symbol does not represent a number, but the expression
is often read as
“the limit of , as x approaches negative infinity, is L”f !x"
lim
x
l
%&
f !x" ! L%&
xLf !x"
lim
x l %&
f !x" ! L
!%&, a"f
2
lim
x l %&
x
2
% 1
x
2
' 1
! 1
f !x"
xf !x"
x
x
y
0
y=ƒ
y=L
0
x
y
y=ƒ
y=L
x
y
0
y=ƒ
y=L
y ! Lf
.,
/
Lxf !x"
Lxf !x"
Lxf !x"
lim
x l &
f !x" ! L&
x l &f !x" l L
lim
x l &
f !x" ! L
xLf !x"
lim
x l &
f !x" ! L
!a, &"f
1
x `
F I G U R E 2
Examples illustrating lim
ƒ=L