Salcido A. (ed.) Cellular Automata - Simplicity Behind Complexity
Подождите немного. Документ загружается.

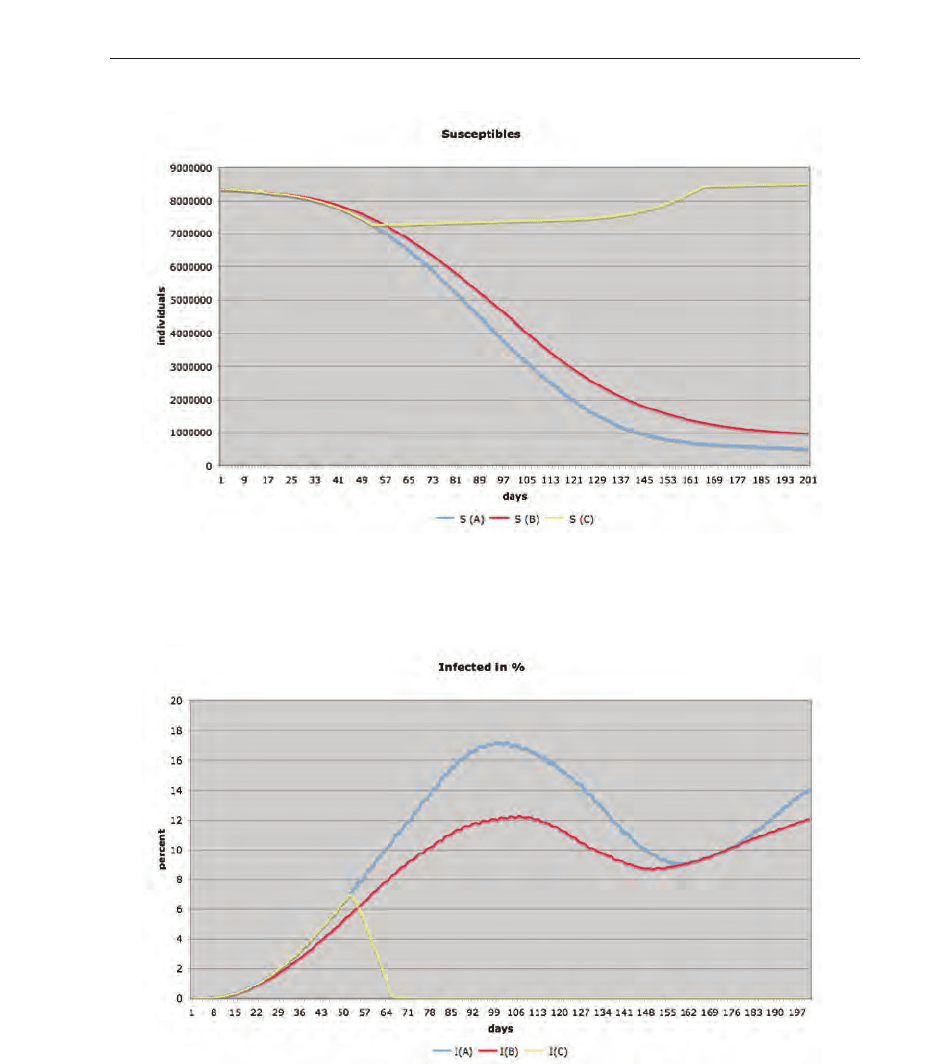
Fig. 3. Susceptible individuals over the simulated period.
Fig. 4. Development of the infection over the simulated period.
507
Biophysical Modeling using Cellular Automata
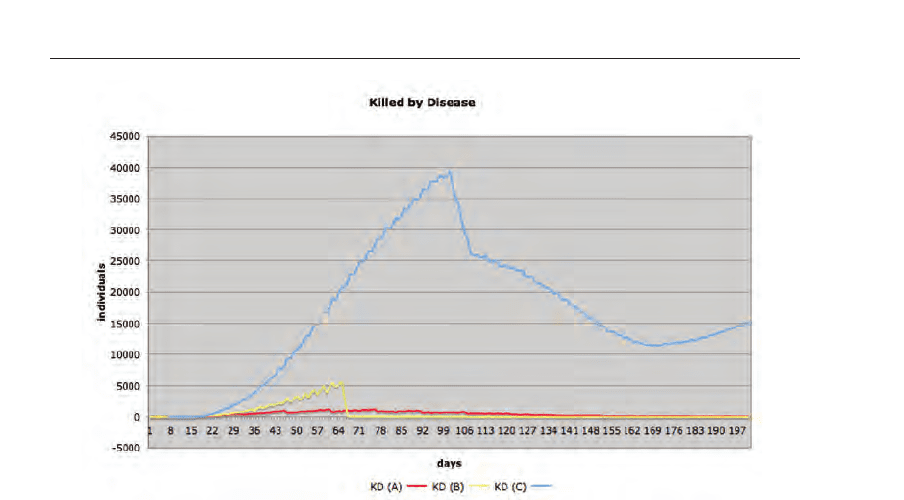
Fig. 5. Fatal cases of the three simulated scenarios.
Figure 6 depicts the parameters individuals, susceptible, infected and removed. As presented
in figure 4b, the medi-cation slows down the spreading and reduces the fatal cases
dramatically. When quarantine is consistently applied, the spread is controlled after a few
days.
Figure 7 depicts the spatial results of the scenarios A, B, C at time point 50 days after
outbreak. The dots and grey surfaces depict the areas where infected individuals are located.
At time point 65 days after outbreak (figure 8) the difference between the three simulated
scenarios can be seen clearly. When no treatment and no quarantine are applied, the infection
spreads the most. The enacted quarantine (C) was able to stop the disease from further
spreading few days, the fatal cases were also reduced in scenario B but the disease was still
spreading.
3.5.3.2 Tyrol
Eight different scenarios were simulated 4. The seed point of the infection was set to the capital
Innsbruck. In the first scenario (scenario A), the disease spread in the state Tyrol where medical
treatment was performed. Two different drugs are available for infected individuals. Drug one
reduces the death rate by 55 percent, whereas drug two reduces the death rate by 45 percent.
The social behavior of the individuals changes during the simulation time, which would also
occur in a real situation. When a fatal disease is circulating, individuals are very cautious
contacting others to minimize their infection risk. The second scenario (scenario B) is similar
to scenario A with the difference that no medical treatment is performed. Scenario C and
D is equal to A and B with the difference that there is no adaptation of the social behavior.
Scenario E and F is equal to scenario A and B with the difference that after 50 time steps
a strictly controlled quarantine is introduced. In the last two scenarios (An, Bn), the same
simulation parameters were applied as in A and B with the difference that no geographical and
population density was used. Therefore, each cell covers the mean number of individuals from
508
Cellular Automata - Simplicity Behind Complexity
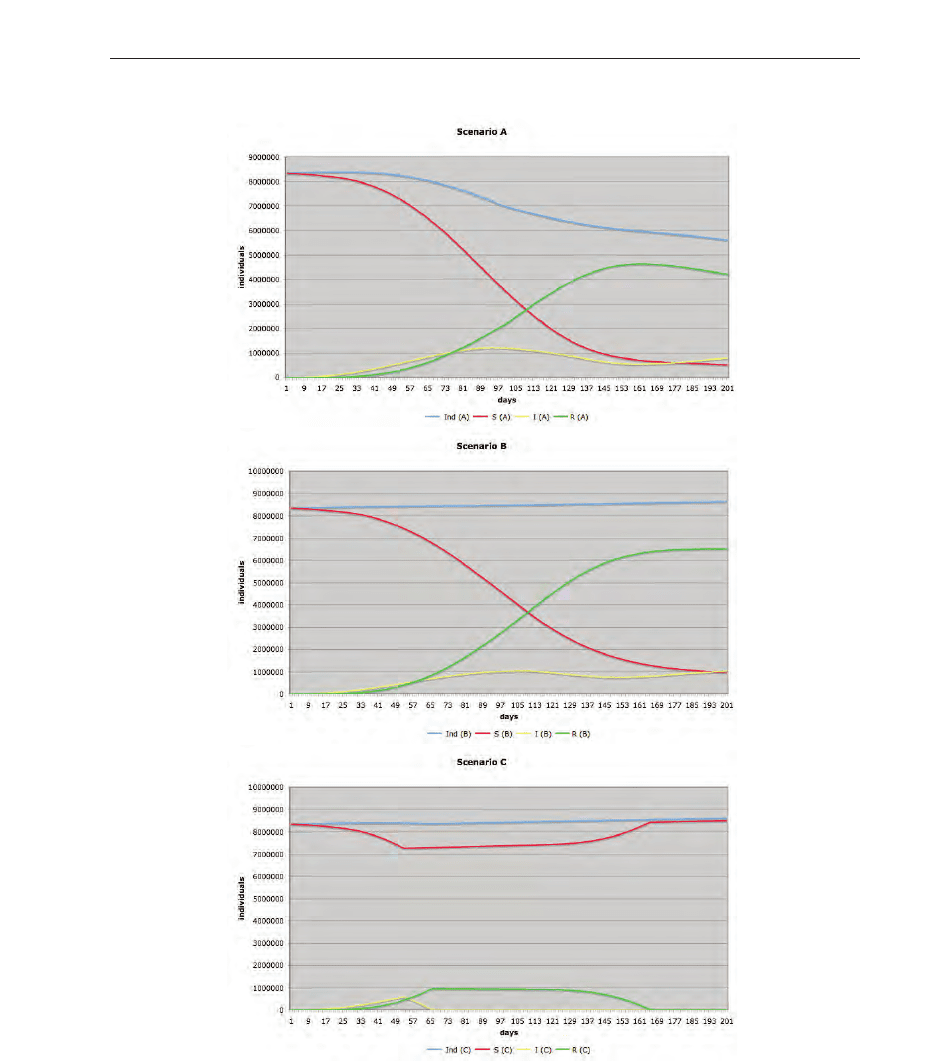
Fig. 6. Population, susceptibles, infected and removed individuals over the simulated period.
509
Biophysical Modeling using Cellular Automata
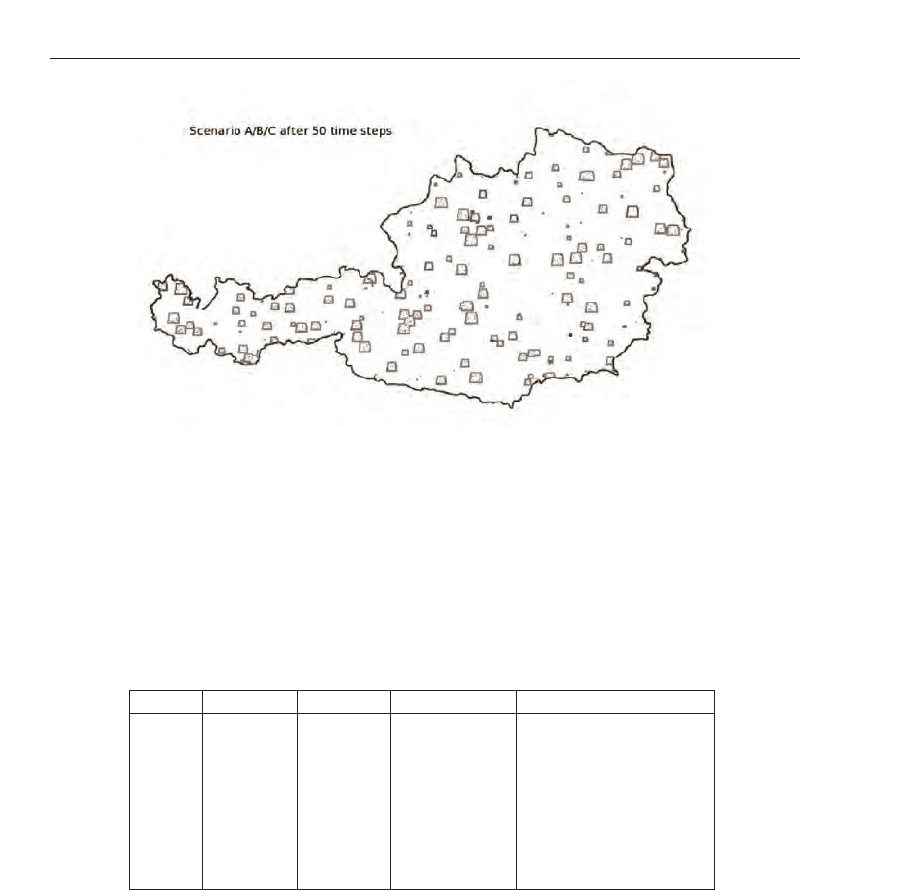
Fig. 7. Screenshot of the spatial result for scenarios A, B, C 50 days after outbreak.
the state Tyrol model. By comparing these scenarios with A and B, it is possible to find out
the relevance of geographical (natural barriers) and population density information. The blue
color (Ind) is used for the population, red color (S) depicts the susceptible individuals, yellow
(I) is used to visualize the infected individuals and the green color (R) was taken to depict the
removed or temporarily immune individuals. The virus’s transmissibility (R
0
value) is such
that each infectious case gives rise to 3.4 secondary infectious cases. The following figures
(from figure 9 to figure 16) depict the classes susceptible (S), infected (I), and removed (R).
Table 3. default
scenario medication quarantine social behavior geographical conditions
A x x x
B x x
C x x
D x
E x x x x
F x x x
An x x
Bn x
Table 4. Overview of the different simulation scenarios in tabular view (x stands for true, no
character for false). For more information see text.
In figure 17, the changes in population over the time are depicted. Figure 18 shows the fatal
cases caused by the disease aggregated per month.
In the simulation, the value for the natural birth rate was 0.002 and the natural death rate 0.001.
An infected individual can be removed during the simulation for three different reasons. The
first way is that the individual is removed because of natural death, and then the individual
can be removed because the disease ended fatal and the third way to be removed to another
class is that the individual got healthy again. Figure 19 shows the percentage between natural
510
Cellular Automata - Simplicity Behind Complexity
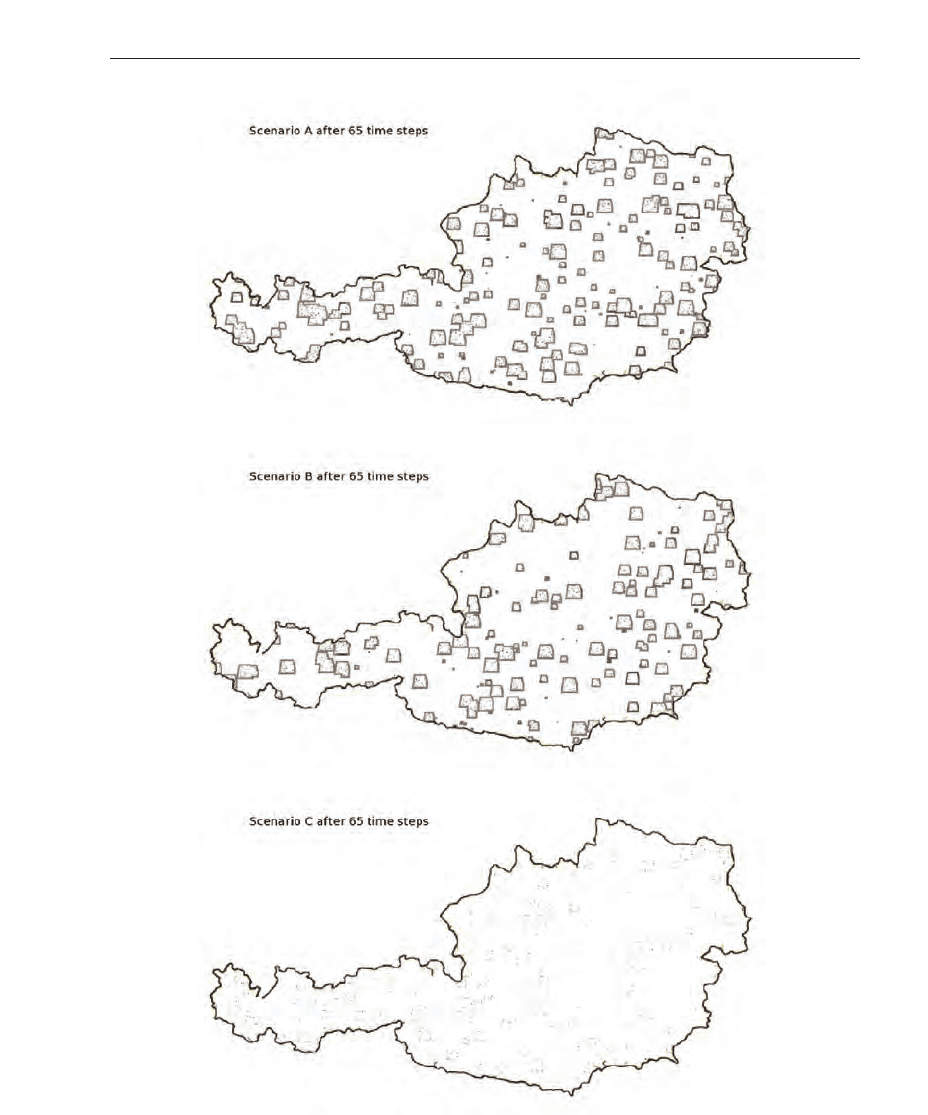
Fig. 8. Screenshot of the spatial result for scenarios A, B, C 65 days after outbreak.
511
Biophysical Modeling using Cellular Automata
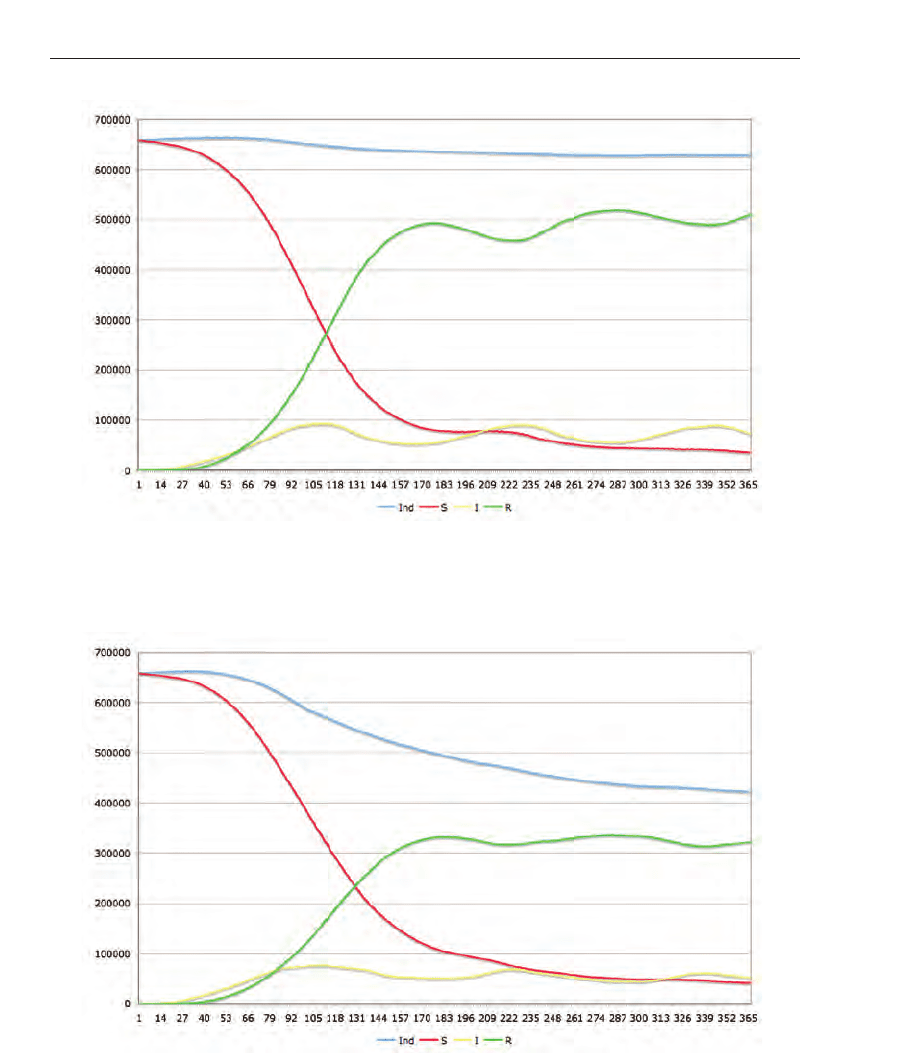
Fig. 9. Scenario A. Medical treatment is performed, and social behavior changes during the
arising situation.
Fig. 10. Scenario B. No medical treatment is performed. Only the social behavior changes
during the simulation run.
512
Cellular Automata - Simplicity Behind Complexity
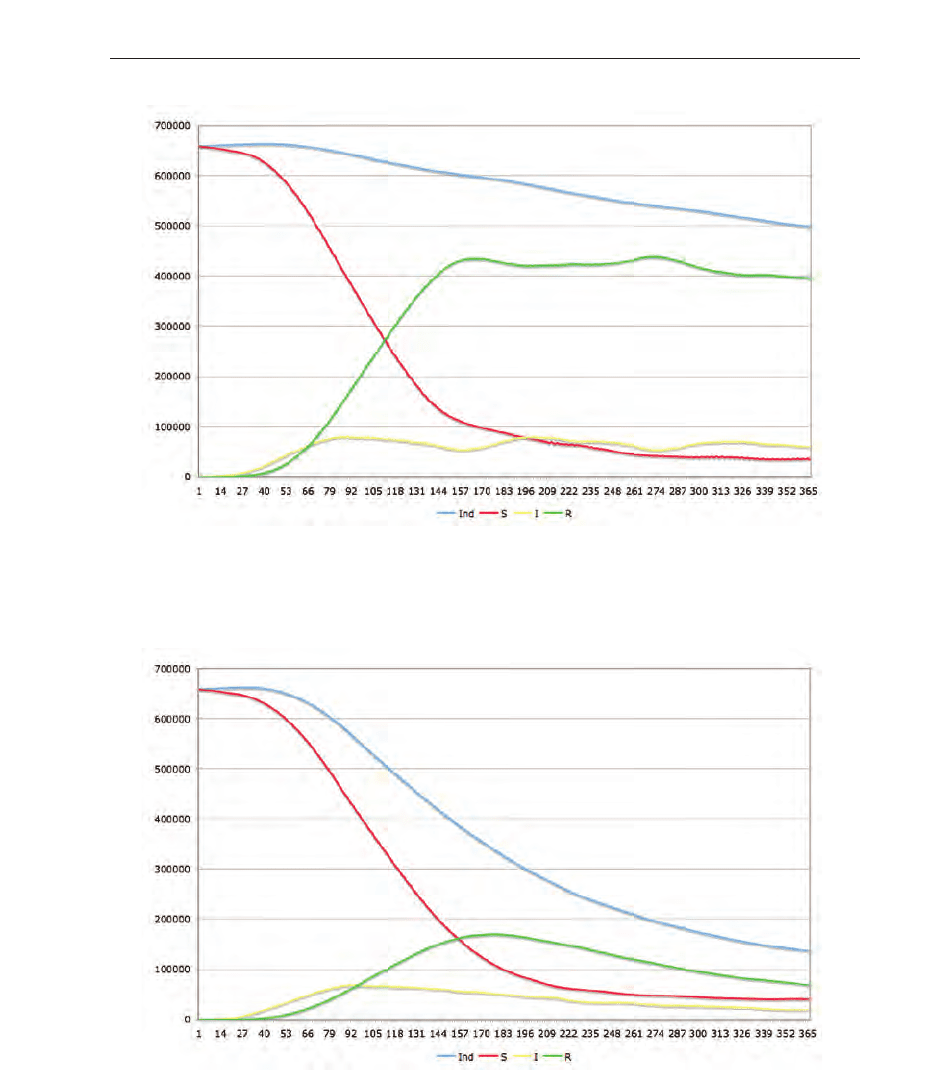
Fig. 11. Scenario C. Medical treatment is performed, but no changes in the individuals’
behavior is simulated.
Fig. 12. Scenario D. No medical treatment and no change in the behavior is applied.
513
Biophysical Modeling using Cellular Automata
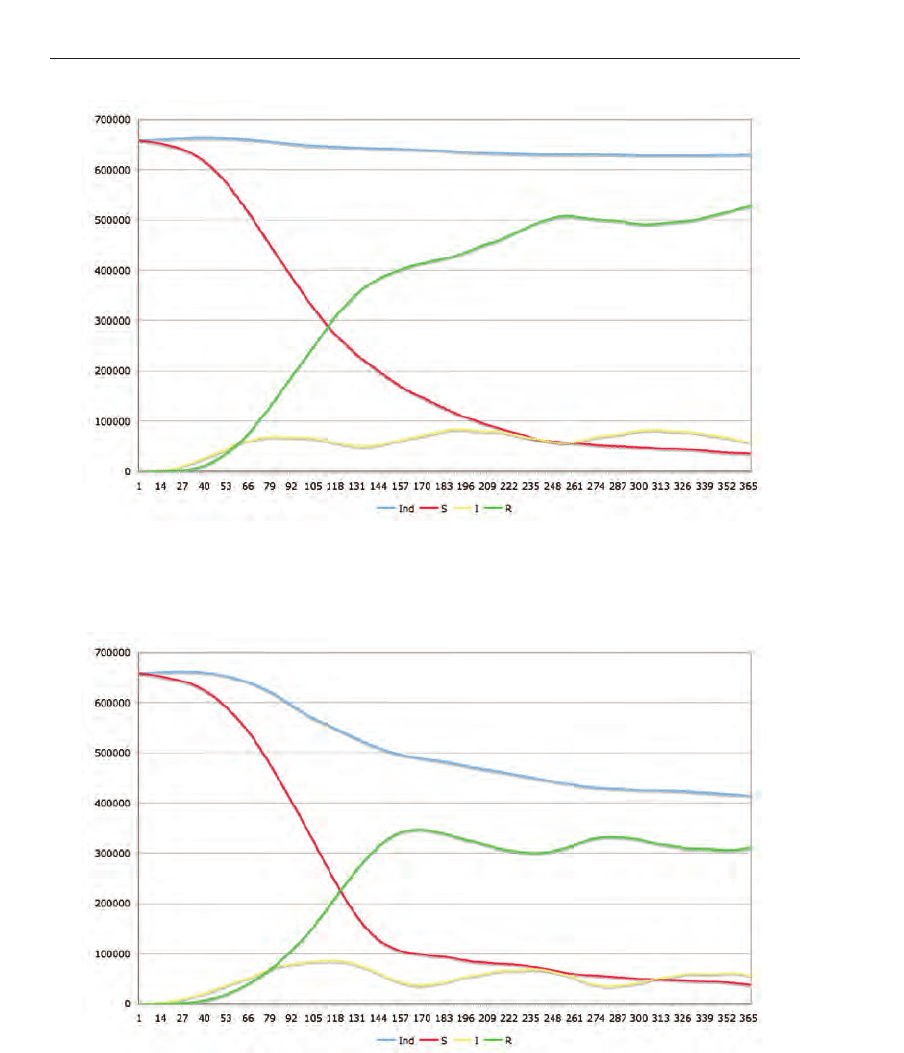
Fig. 13. Scenario E. Equal to scenario A with the difference, that after 50 days a controlled
quarantine is applied.
Fig. 14. Scenario F. Equal to scenario B with the difference, that after 50 days a controlled
quarantine is applied.
514
Cellular Automata - Simplicity Behind Complexity
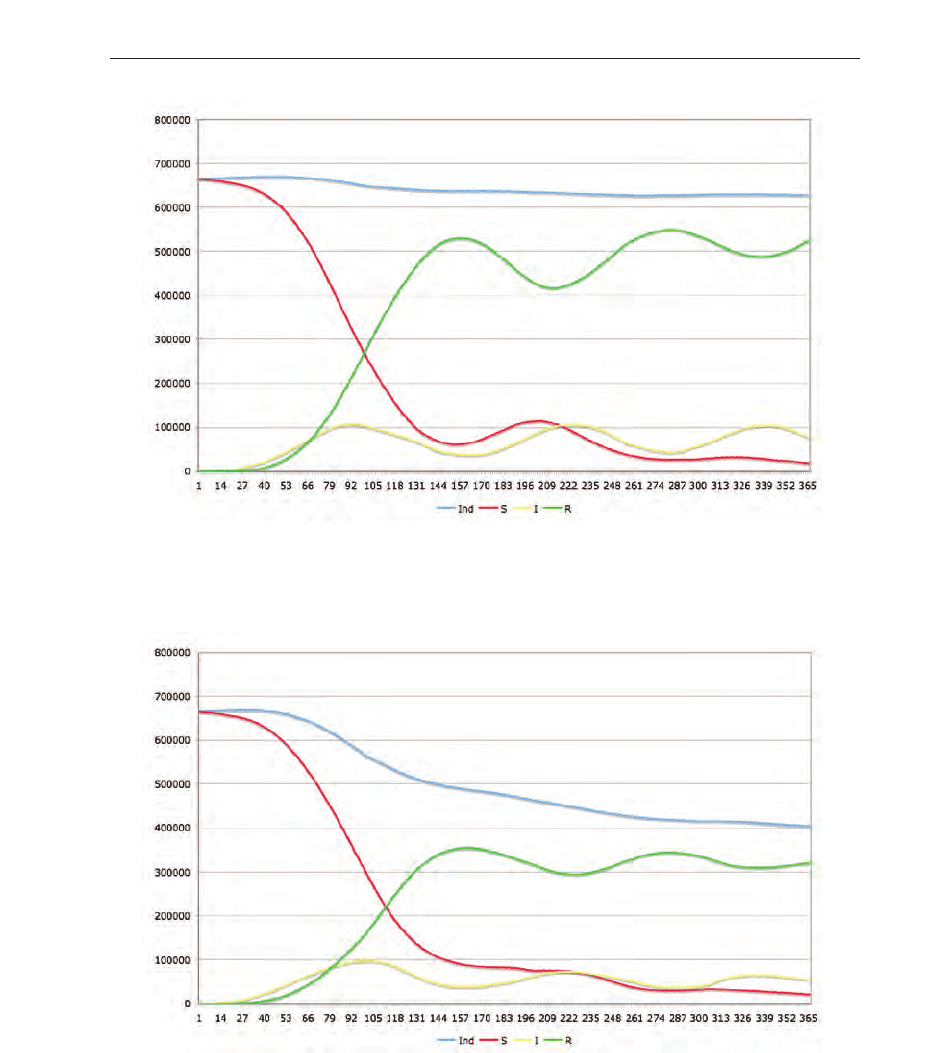
Fig. 15. Scenario An. Equal to scenario A with the difference that no geographical
information was used. The population was therefore homogenous.
Fig. 16. Scenario Bn. Equal to scenario B with the difference that no geographical information
was used. The population was therefore homogenous.
515
Biophysical Modeling using Cellular Automata
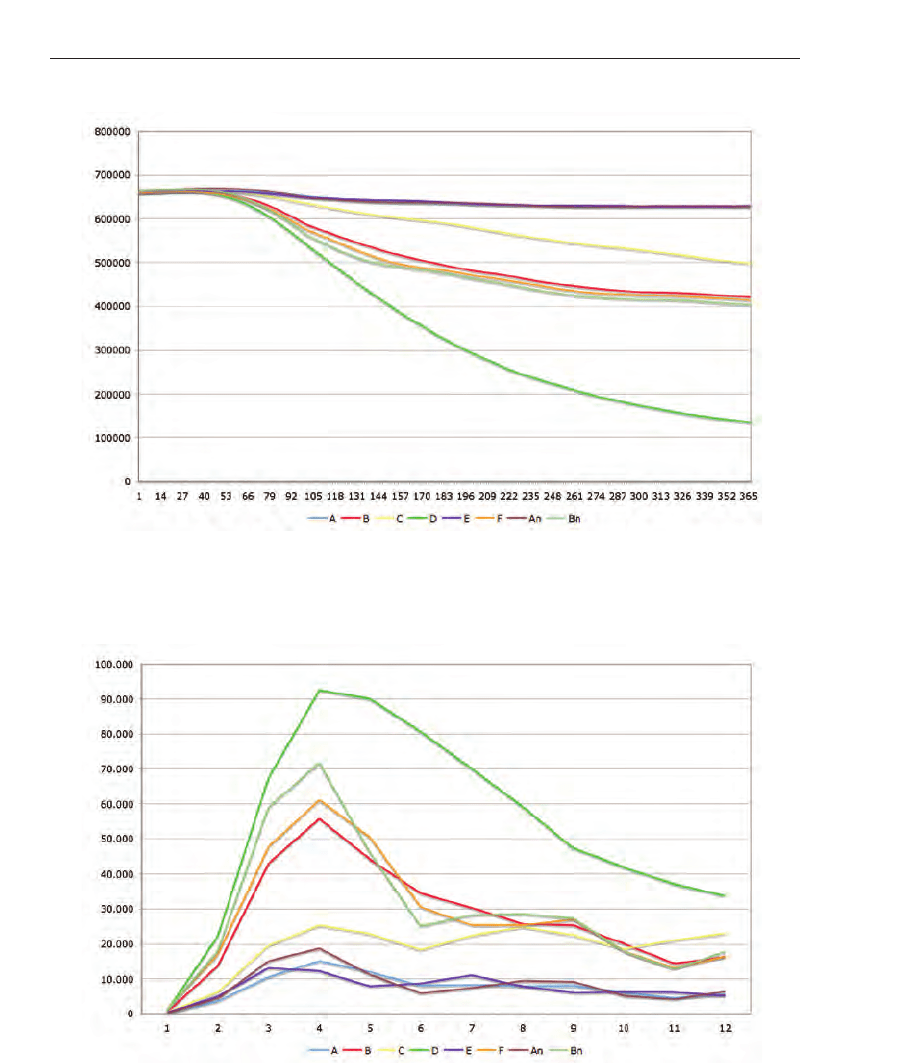
Fig. 17. Population change over the time.
Fig. 18. Fatal cases aggregated per month.
516
Cellular Automata - Simplicity Behind Complexity