Salcido A. (ed.) Cellular Automata - Simplicity Behind Complexity
Подождите немного. Документ загружается.


Cellular Automata for Traffic Modelling and Simulations
in a Situation of Evacuation from Disaster Areas
197
The OVM takes the optimal velocity function
(
)
n
VxΔ
as,
(
)
(
)
tanh
nn
Vx xΔ= Δ
(4a)
(
)
(
)
tanh 2 tanh 2
nn
Vx xΔ= Δ−+ (4b)
where Equation (4a) is called as the simple model and also Equation (4b) is called as the
realistic model.
3.1.2 Generalized Force Model (GFM)
The driver behaviour is mainly given by the motivation to reach a certain desired velocity v
n
(which will be reflected by an acceleration force), and by the motivation to keep a safe
distance from other car (n-1) (which will be described by repulsive interaction forces). The
GFM is created to improve the OVM which has the problems of too high acceleration and
unrealistic deceleration (Helbing, D. & Tilch, B., 1998).
In the GFM, one term is added to the right-hand side of Equation (2). Thus the formula of
the GFM is written by the following equation,
()
2
2
() ()
() ( )( )
nn
n
dx t dx t
aV x t v v
dt dt
λ
⎡⎤
=
Δ− +Θ−ΔΔ
⎢⎥
⎣⎦
(5)
where Θ denotes the Heaviside function,
λ
is a sensitivity coefficient different from a. Note
that in the GFM, Equation (5) can be rewritten as follows,
()
2
2
()
() () ( )( )
n
mn n m
dx t
av v t aV x t v v v
dt
λ
⎡⎤
=
−+Δ−+Θ−ΔΔ
⎡⎤
⎣⎦
⎣⎦
(6)
where v
m
is the maximum speed. The first term on the right-hand side is the acceleration
force, and the last two terms represent the interaction forces.
3.1.3 Full Velocity Difference Model (FVDM)
A full velocity difference mode (FVDM) (Jiang, R., et al., 2001) for a car-following theory is
based on the previous models. The FVDM model includes car-following parameter to the
previously proposed models. Through numerical simulation, property of the model is
investigated using both analytic and numerical methods. It was found that the FVDM model
can represent the phase transition of traffic flow and also estimate the evolution of traffic
congestion.
On the basis of the GFM formula, taking the positive Δv factor into account, the FVDM is
described as the following dynamics equation,
()
2
2
() ()
()
nn
n
dx t dx t
aV x t v
dt dt
λ
⎡⎤
=
Δ− +Δ
⎢⎥
⎣⎦
(7)
The FVDM takes both positive and negative velocity differences into account. The model
equation of the FVDM (7) may be reformulated into the similar form in the Equation (8).

Cellular Automata - Simplicity Behind Complexity
198
The GFM assumes that the positive Δv does not contribute to the vehicle interaction, while
the FVDM suggests that it contributes to vehicle interaction by reducing interaction force
because
(
)
()
nm
aV x t v
⎡⎤
Δ−
⎣⎦
is always negative and ()vv
λ
Θ
ΔΔ is always positive.
()
2
2
()
() ()
() ()
n
mn n m
dx t
av v t aV x t v
dt
vv vv
λλ
⎡
⎤
=− +Δ−
⎡⎤
⎣⎦
⎣
⎦
+Θ−Δ Δ+ΘΔ Δ
(8)
One of the examples of the application of the FVDM on car motion simulation with traffic
signal shows that it can describe the traffic dynamics most exactly so that the FVDM is
verified as a reasonable and realistic model. On the other hand real situation exist in
between the FVDM and the GFM. In the FVDM, car accelerates more quickly than the car in
the GFM. Therefore, the delay time δt in FVDM is smaller than that in GFM as is shown in
Table 1. Since the empirical deceleration and acceleration are restricted in between the range
from −3 m/s
2
to 4 m/s
2
] (Helbing, D. & Tilch, B., 1998), the FVDM has too high deceleration.
Model Delay time δt (s)
OVM (a = 0.85 s
-1
) 1.6
GFM (a = 0.41 s
-1
) 2.2
FVDM (a = 0.41 s
-1
)1.4
Table 1. Delay times of car motions from a traffic signal and disturbance propagation speed
at jam density in different models (source: [16])
3.1.4 Two Velocity Difference Model (TVDM)
Two velocity different models (TVDM) for a car following theory are then proposed taking
navigation in modern traffic into account. The property of the model is investigated using
linear and nonlinear analysis (Ge, X.H., et al., 2008).
Intelligent Transportation System (ITS) plays an important role in the rapid development of
modern traffic. By using such navigation system, drivers can obtain the information that
they need. In accordance with the above concept, on the basis of the OVM, taking both Δv
n
and Δv
n+1
into account, (Ge, X.H., et al., 2008) obtain a more useful model called the two
velocity difference model (TVDM), the following dynamics equation is expressed,
()
2
1
2
() ()
() ( , )
nn
nnn
dx t dx t
aV x t G v v
dt dt
λ
+
⎡⎤
=Δ− +ΔΔ
⎢⎥
⎣⎦
(9)
where G(.) is a generic, monotonically increasing function, and is assumed to be a linear
form as,
(
)
11
,(1)
nn n n
Gv v pv pv
+
+
ΔΔ =Δ+−Δ
(10)
where p is weighting value. The proper value of p could be lead to desirable results.
3.2 Discrete model: cellular automata model
Cellular Automata (CA) is a model that is discrete in space, time and state variables. The
latter property distinguishes CA e.g. from discretised differential equations. Due to the

Cellular Automata for Traffic Modelling and Simulations
in a Situation of Evacuation from Disaster Areas
199
discreteness, CA is extremely efficient in implementations on a computer. CA for traffic has
been called by traffic cellular automata (TCA). Some of the TCA models, i.e. (1)
Deterministic model: Wolfram’s rule 184 (CA-184); (2) Stochastic model: Nagel–
Schreckenberg TCA (STCA)
In 1992, Nagel and Schreckenberg proposed a TCA model that was able to reproduce
several characteristics of real-life traffic flows, e.g., the spontaneous emergence of traffic
jams (Nagel, K. & Schreckenberg, M., 1992). Their model is called the NaSch TCA, but is
more commonly known as the stochastic traffic cellular automaton (STCA). It explicitly
includes a stochastic noise term in one of its rules.
The computational model in the STCA is defined on a one-dimensional array of L sites and
with open or periodic boundary conditions. Each site may either be occupied by one vehicle
or it may be empty. Each vehicle has an integer velocity with values between zero to v
max
.
For an arbitrary configuration, one update of the system consists of the following four
consecutive steps, which are performed in parallel for all vehicles,
1.
Acceleration
(,) max (,)
(,) (,)
(1) (,)(1) (1)1
() ( 1) 1
ij ij
ij ij
vt v gsijt vt
vt vt
−
<∧ −> −+
←−+
(11)
(gs
(i,j)
(t) space gap at each time step t or the distance to the next vehicle ahead ).
2.
Braking
(,) (,) (,) (,)
(1) () () (1)1
ij ij ij ij
gs t v t v t gs t
−
≤⇒←−−
(12)
3.
Randomization
(,) (,)
() () max[0, () 1]
ij ij
tpvt vt
ξ
<
⇒← −
(13)
(ξ(t) is random number, p is stochastic noise parameter or slowdown probability).
4.
Vehicle movement
(,) (,) (,)
() ( 1) ()
ij ij ij
xt xt vt
←
−+
(14)
Through the step one to four very general properties of single lane traffic are modelled on
the basis of integer valued probabilistic cellular automaton rules. Already this simple model
shows nontrivial and realistic behaviour. Step 3 is essential in simulating realistic traffic
flow otherwise the dynamics is completely deterministic. It takes into account natural
velocity fluctuations due to human behaviour or due to varying external conditions.
Without this randomness, every initial configuration of vehicles and corresponding
velocities reaches very quickly at a stationary pattern which is shifted backwards (i.e.
opposite the vehicle motion) in one site per time step.
4. Case study on evacuation from disaster occurred area based on agent-
based approach
4.1 Situation
There are some of subsystems in the proposed micro traffic agent-based modelling and
simulation. First is determining of the shape of road structure. It is conducted for the realistic
Cellular Automata - Simplicity Behind Complexity
200
situation in Sidoarjo hot mudflow disaster that the road structure is straight road, one-way
direction, and has some of traffic lanes, as well as there is no traffic light over there. With
regard to the unpredictable disturbance properties, it has constant speed and same direction
with vehicle on unidirectional road. Besides that the disaster comes from the one of the ends of
the road. These conditions are appropriated with the real condition of Sidoarjo hot mudflow.
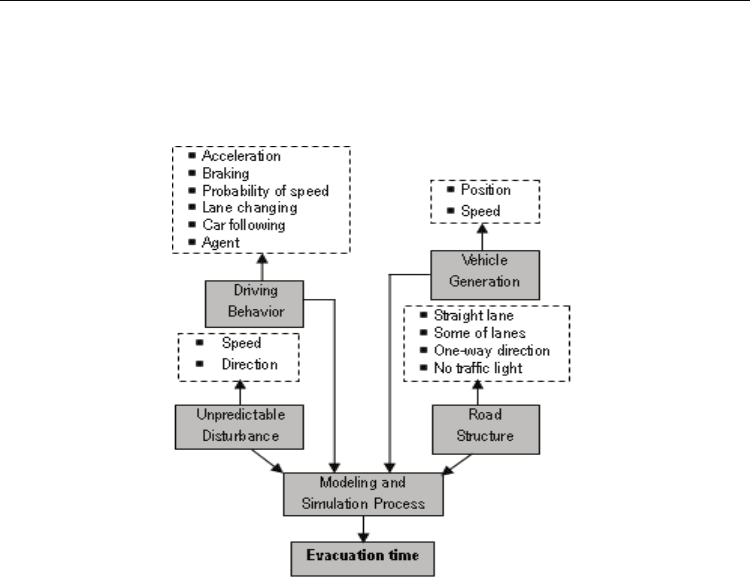
Fig. 1. Diagram block of evacuation simulation in the micro traffic
The other subsystem: vehicle generation, it is determined by a random number generation.
It provides positions and speeds of all vehicles. Furthermore, we determine the driving
behaviour. This study uses modified driving behaviour of Nagel-Schreckenberg proposed
by using traffic Cellular Automata (Nagel, K. & Schreckenberg, M., 1992). We add two
parameters in their model those are lane-changing and car-following. All the parameters of
driving behaviour used in the proposed simulation are acceleration, braking, probability of
speed, lane-changing, car-following, and agent. The overall simulation flow with the
parameters used is shown in Fig. 1.
As the simulation results, we evaluated performance of the proposed driving behaviour
(driving behaviour with agent) by compare it to the driving behaviour based on Nagel-
Schreckenberg (without agent) for vehicle evacuation simulation from the affected disaster
area of Sidoarjo. Thus, the simulation with and without agent cars is shown in this section.
4.2 Simulation procedure
The steps of proposed simulation model are preparation of road structure, vehicle
generation, interpretation of unpredictable disturbance, and driving behaviour.
4.2.1 Preparation of road structure
The assumed road structure is shown in Fig.2. The realistic situation of main road structure
is very close to mud containment walls (dikes) and the road shape is straight line. High
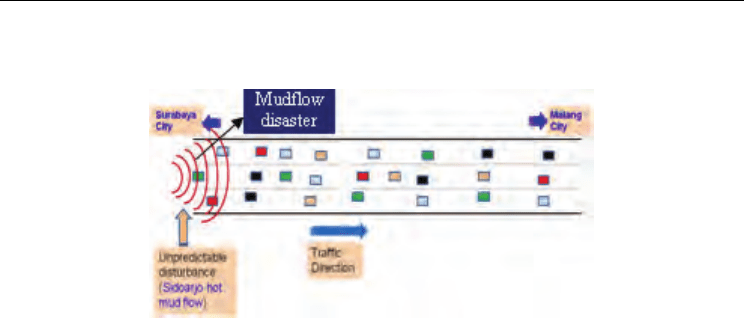
Cellular Automata for Traffic Modelling and Simulations
in a Situation of Evacuation from Disaster Areas
201
hazard will be occurred when the dike of hot mudflow is broken and the mud is spill over
from the broken dike to the nearby roads spontaneously.
Fig. 2. Map of the roadway (Sidoarjo Porong roadway)
The hot mud will flow from behind of vehicles. It implies that the mudflow comes from the
one of the ends of the road in the figure. Vehicles and hot mudflow have same direction (in
Fig. 2, it is from left to right). Although the road is very close to the high dike of the hot
mudflow, the transportation density on the road is also very high. This is the real situation
that is main artery of traffic. The road has two lanes in one-way direction. The other actual
condition on the road is that there is no traffic light at all.
In the proposed simulation, two lanes of traffic are assumed by condition above. Although
the density is very high, drivers have a chance to change the lane.
4.2.2 Vehicle generation
The vehicle generation uses random number generator of Merssene Twister. Position and
speed of vehicle depend on the probability of vehicle density.
Procedure for the determining of vehicle generation is as follows:
(1) Define number of lane (i = 1…k); (2) Define number of road length (j = 1… n); (3)
Determine probability of vehicle density P
d
; (4) Generate vehicles position x(i, j) and their
speed v
s
randomly toward P
d
(,) max
() [1: ]
ij
xt v
=
(15)
with probability P
d
.
4.2.3 Unpredictable disturbance
The proposed unpredictable disturbance is in the case of Sidoarjo hot mudflow disaster. It
has two parameters, speed and direction. We assumed that speed of hot mudflow is to be
constant. It is set as smaller than maximum speed of vehicle. Next the second parameter,
direction of hot mudflow is the same as the vehicle’s direction in the one-way street road.
4.2.4 Driving behavior
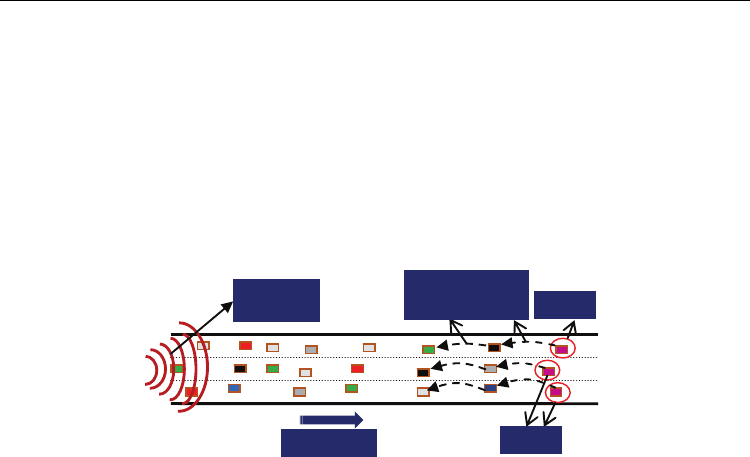
According to the agent, there are two driving behaviours, with and without agent cars. If an
agent car exists, then the following cars recognize speed changes of the agent car so that
traffic might be possible to control by the agent car as is shown in Fig.3. And if the agent car
knows the best way to minimize the evacuation time (such information can be derived from
Cellular Automata - Simplicity Behind Complexity
202
the evacuation control centre and transferred to the agent cars through wireless network
connection), they could lead the following cars to the safe areas in a fastest way.
4.2.4.1 Modified Driving Behaviour of Nagel-Schreckenberg
Regarding to the Equation (11) to Equation (14), STCA have four steps of driving behaviour
rule: acceleration, braking, randomization (slowdown probability), and vehicle movement,
our study modifies it by adding two parameters about lane changing and car following. It is
based on (Maerivoet, S. & De Moor, B., 2005 B) that stated the basic implementation of a
lane-changing model in traffic cellular automata setting leads to two sub steps that are
consecutively executed at each time step of the cellular automata. We called this
modification is modified driving behaviour of Nagel-Schreckenberg.
traffic
information of
speed changes
a
g
ent
a
g
ent
Mudflow
disaster
Fig. 3. Driving behaviour with agent
The overall rule of the modified driving behaviour of Nagel-Schreckenberg is as follows:
1.
Acceleration
(,) max (,)
(,) (,)
(1) (,)(1) (1)1
() ( 1) 1
ij ij
ij ij
vt v gsijt vt
vt vt
−
<∧ −> −+
←−+
(16)
2.
Braking
(,) (,) (,) (,)
(1) () () (1)1
ij ij ij ij
gs t v t v t gs t
−
≤⇒←−−
(17)
3.
Randomization
(,) (,)
() () max 0, () 1
ij ij
tpvt vt
ξ
⎡
⎤
<
⇒← −
⎣
⎦
(18)
4.
Vehicle movement
(,) (,) (,)
() ( 1) ()
ij ij ij
xt xt vt
←
−+ (19)
5.
Lane changing
Determine probability of lane changing P
lc
and a = [0 : v] for:
( 1,) ( 2,, )
(2, ) (1,)
(1) (1)0
() ( 1)
ij ijjv
ija ij
g
st vx t
xtxt
==+
=+ =
−
<∧ − =
⇒←−
(20)
or
( 2,) ( 1,, )
(1, ) (2,)
(1) (1)0
() ( 1)
ij ijjv
ija ij
g
st vx t
xtxt
==+
=+ =
−
<∧ − =
⇒←−
(21)
6.
Car following/vehicle movement: Back to step 4).

Cellular Automata for Traffic Modelling and Simulations
in a Situation of Evacuation from Disaster Areas
203
4.2.4.2 Proposed Driving Behaviour
There is the related work on the essence of the phenomenological research (Kretz, T., 2007).
It stated that, (1) Concerning irrational behaviour: “After five decades studying scores of
disasters such as floods, earthquakes and tornadoes, one of the strongest findings is that
people rarely lose control.”; (2) Concerning cooperation and altruism: “When danger arises,
the rule as in normal situations is for people to help those next to them before they help
themselves.”; (3) Concerning panic: “Most survivors who were asked about panic said there
was none.”; and (4) Instead there were stories of people helping their spouses, flight
attendants helping passengers, and strangers saving each other’s lives.
Our proposed assumption for building up the agent rule in driving behaviour based on the
statements above. When disaster occurs, every vehicle on affected road area has to have a
good knowledge of driving behaviour. One of the important things in this situation is that
all vehicles have a good capability of speed control followed by helping each other without
any panic. The proposed assumption has the sense of a necessity for mimicking the basic
features of real-life traffic flows in affected road area.
According to the ant behaviour (Retired Robots, In: http://www.ai.mit.edu/projects/ants/
social-behavior), we make a technically driving behaviour. Agent behaviour can be built in
some of vehicles. Each agent has appropriate information of speed control and is situated in
each. Agent leads other vehicles so that traffic speed can be controlled by the agents. In this
situation, the following car-following parameter is getting more important. If the following
car does not follow the leading agent car, the traffic condition is worthless. This condition is
consecutively performed to all vehicles in one lane and parallel to the entire lane.
We put the agent behaviour in the car-following parameter of driving behaviour. The rule of
agent is,
(, ) (,) max
(,) (,) (,)
(1)0 ()
() ( 1) ()
ij v c ij
ij ij ij
xt vtcv
xt xt vtc
++
−
=∧ +≤
⇒←−++
(22)
where c is positive integer.
Furthermore, the rule of proposed driving behaviour as follows:
1.
Acceleration
(,) max (,)
(,) (,)
(1) (,)(1) (1)1
() ( 1) 1
ij ij
ij ij
vt v gsijt vt
vt vt
−
<∧ −> −+
←−+
(23)
2.
Braking
(,) (,) (,) (,)
(1) () () (1)1
ij ij ij ij
gs t v t v t gs t
−
≤⇒←−−
(24)
3.
Randomization
(,) (,)
() () max[0, () 1]
ij ij
tpvt vt
ξ
<
⇒← −
(25)
4.
vehicle movement
(,) (,) (,)
() ( 1) ()
ij ij ij
xt xt vtc
←
−+ +
(26)
5.
Lane changing
Determine probability of lane changing P
lc
and a = [0 : v] for:

Cellular Automata - Simplicity Behind Complexity
204
( 1,) ( 2,, )
(2, ) (1,)
(1) (1)0
() ( 1)
ij ijjv
ija ij
gs t v x t
xtxt
==+
=+ =
−
<∧ − =
⇒←−
(27)
Or
( 2,) ( 1,, )
(1, ) (2,)
(1) (1)0
() ( 1)
ij ijjv
ija ij
gs t v x t
xtxt
==+
=+ =
−
<∧ − =
⇒←−
(28)
6.
Car following/vehicle movement: Back to step 4).
4.3 Evaluation of the proposed parameter in the driving behaviour
Road traffic is always in a specific state that is characterized by three macroscopic variables:
the flow rate q (cars per time step), the density k (cars per site), and the mean speed v (site
per time step). Combination of all the possible homogeneous and stationary traffic states in
an equilibrium function can be described graphically by three diagrams. The equilibrium
relations presented in this way are known under the name of fundamental diagrams. The
fundamental relation is,
qkv
=
(29)
There are only two independent variables density k and mean speed v.
Related to the fundamental relation of three macroscopic variables, we have conducted the
relationship between the parameters proposed in the car-following of driving behaviour and
the evacuation time T. These proposed parameters are the mean speed v and the density
function c, which c is defined by 1/k, completely c = Q(1/k), Q is a function. So there are two
relationships: mean speed v versus evacuation time T (v-T diagram) and function of density
c versus evacuation time T (c-T diagram).
Function of density c is equivalent to the parameter c in Equation (22), while mean speed v is
v
(i,j)
(t). Thus, parameter c in Equation (22) is better known under the name of function of
density (= Q(1/k)). So that Equation (22) can be rewritten as,
(
)
(, (1/ )) (,) max
(,) (,) (,)
(1)0 () (1/)
() ( 1) () (1/ )
ij v Q k ij
ij ij ij
xtvtQkv
xt xt vtQ k
++
−=∧ + ≤
⇒←−++
(30)
where c = Q(1/k).
The previous work (Immers, L.H. & Logghe, S., 2002); (Maerivoet, S. & De Moor, B., 2005 A);
(Maerivoet, S. & De Moor, B., 2005 B) and (Tampère, C.M.J., 2004) observed the relation
between density k and mean speed v in the fundamental diagram (k-v diagram). There are
also some special state points that require extra attention. One of them is about saturated
traffic. On saturated roads, flow rate q and speed v are down to zero. The vehicles are
queuing and there is a maximum density k
max
(jam density). We can say on the other hand
about the aforementioned special state point generally that by the density k increase (pass
through the jam density), then the speed v will be decrease (down to zero). This condition is
consistent with the characteristic of k-v diagram.
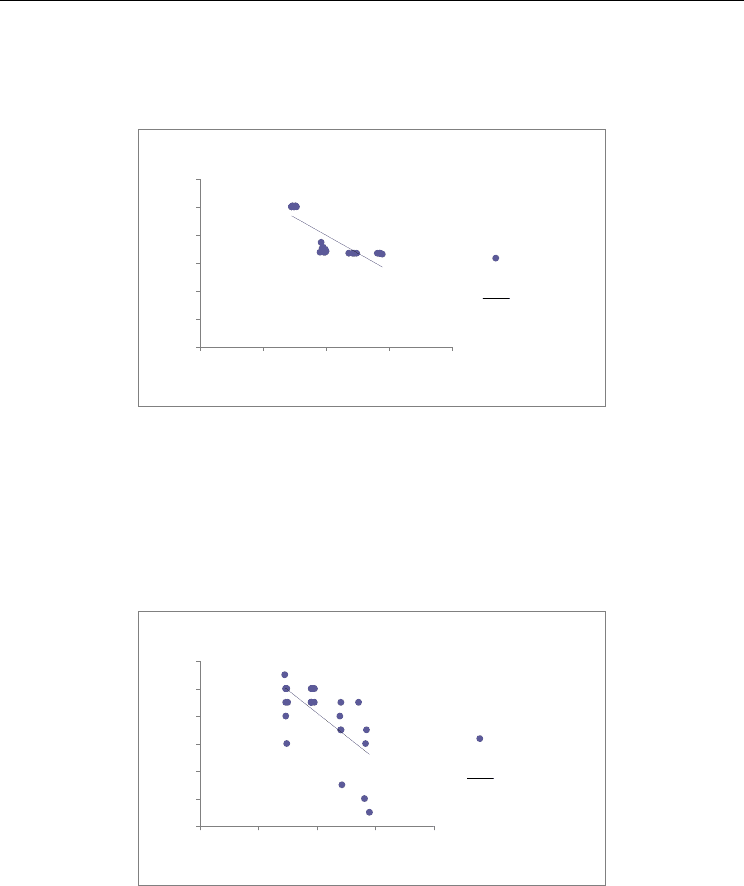
Based on k-v diagram, we can say in accordance with relation between mean speed v and
evacuation time T (v-T diagram) that when the mean speed v down to zero (in the time the
Cellular Automata for Traffic Modelling and Simulations
in a Situation of Evacuation from Disaster Areas
205
density k has increased/pass the jam density), we found the evacuation time T by the great
value. Besides, we also observe that by the increase of the mean speed v, we find the
evacuation time T decreases. It occurs either with or without agent in the evacuation
simulation (see Fig.4 and Fig.5 with/without agent respectively).
Relation among mean speed v and evacuation time T
0
50
100
150
200
250
300
01234
mean speed v
evacuation time T
(v ,T ) w ith
agent
L in e a r ((v ,T )
with agent)
Fig. 4. Relationship between mean speed and evacuation time (with agent)
According to k-v diagram and relation between mean speed v versus evacuation time T (v-T
diagram), we saw sequentially that by the increase of density k, mean speed v will decreases.
And then, we also found that the movement of the mean speed v down to smaller value has
impact the evacuation time T is going up. On the other hand, we have the sense of relation
between the density k and the evacuation time T. Both k and T have linear correlation. When
the density k goes up, the evacuation time is also going up.
Relation among mean speed v and evacuation time T
490
492
494
496
498
500
502
01234
mean speed v
evacuation time T
(v ,T ) w ith o u t
agen t
Linear ((v,T)
without agent)
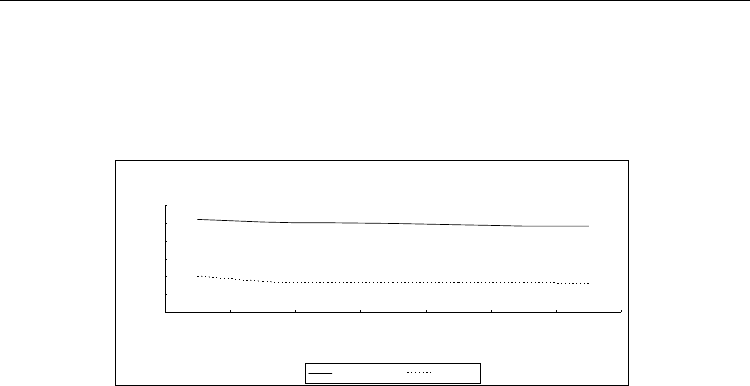
Fig. 5. Relationship between mean speed and evacuation time (without agent)
We knew that function of density c (= Q(1/k)) is in inverse ratio by k. It has the meaning that
by using the density k larger, the function of density c has small value. While the density k
and the evacuation time T have linear correlation then we say that in the time c has the small
value, the value of the evacuation time T is large. The other hand, when the value of c is
going up the evacuation time T will down to the smaller value. Our experiment results
about value of c and T found relationship between both of them. Based on linear correlation
Cellular Automata - Simplicity Behind Complexity
206
between the evacuation time T and the density k, we looked for function of density c (=
Q(1/k)). From this correlation we obtained the value of c = Q(1/k) = (12/10)(1/k). By using
this value of c, we have the experiment results, relation between function of density c and
evacuation time T (see Fig. 6). The pattern of their relationship in accordance with the
description above. We showed it with/without agent.
Relationship between function of density c and evacuation time T
0
100
200
300
400
500
600
1234567
function of density c = Q (1/k )
evacuation time T
without agent with agent
Fig. 6. Relationship between function of density c and evacuation time (with/without agent)
5. Survey results of traffic on the Sudioarjo Porong roadway
5.1 Specification of survey
Roadway: Sidoarjo Porong roadway, East Java, Indonesia (Fig.7); direction of traffic:
Sidoarjo/Surabaya to Malang/Banyuwangi (unidirectional); parameter was observed in the
survey: speed of vehicle; data measurement: speed of vehicles every 15 minutes, during 24
hours, along eight days consecutively. All vehicles passing through the Sidoarjo Porong
roadway is classified into four types: bus, truck/trailer, public transport, and private car.
5.2 The influence of cars speed with respect to the driving behavior
During survey the traffic data, we have totally 190 data of speed for each kind of cars (bus,
truck/trailer, public transport, and private car). Analysis data is done to get any information
related with the driving behavior.
Based on statistical hypothesis testing (t-student distribution), we find the hypothesis results
for bus, public transport, and private car are accepted, whereas truck/trailer is rejected. It
means that truck/trailer has different speed behaviour if it is compared by the other cars
(bus, public transport, and private car). Speed of the truck/trailer is lower than that of the
others. Comparison of speed between truck/trailer and all kind of the cars (mean speed of
all vehicles) is conducted. Many trucks/trailers have the speed is less than or equal to 40
kilometre per hour (km/hr) when we compare it with all kind of the cars per speed interval,
while all kind of the cars have the speed more than 41 km/hr is larger than that of the
truck/trailer (see in Table 2 and Fig.8).
We also find distribution of speed for the bus, public transport, and private car. Comparison
of their speeds related to the speed of all kind of the cars is conducted. Bus and public
transport have the most frequency in the range of speed 36 – 40 km/hr, while for the private
cars in the range 41 – 45 km/hr. We also found that all kind of the cars have the most
frequency in the range of speed 41 – 45 km/hr (see in Table 3 and Fig.9).