Rusko A., Thompson M. Power Quality in Electrical Systems
Подождите немного. Документ загружается.

Harmonics and Interharmonics 45
Harmonic amplitude
123456
Harmonic number
789
4
/
π
4
/
3π
4
/
5π
4
/
7π
4
/
9π
(b)
Figure 4.1 (Continued)
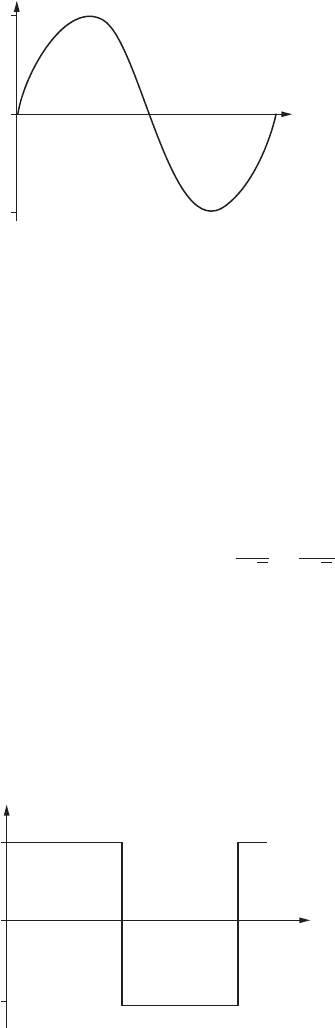
1
T
t
−1
v(t)
(a)
T
/
2
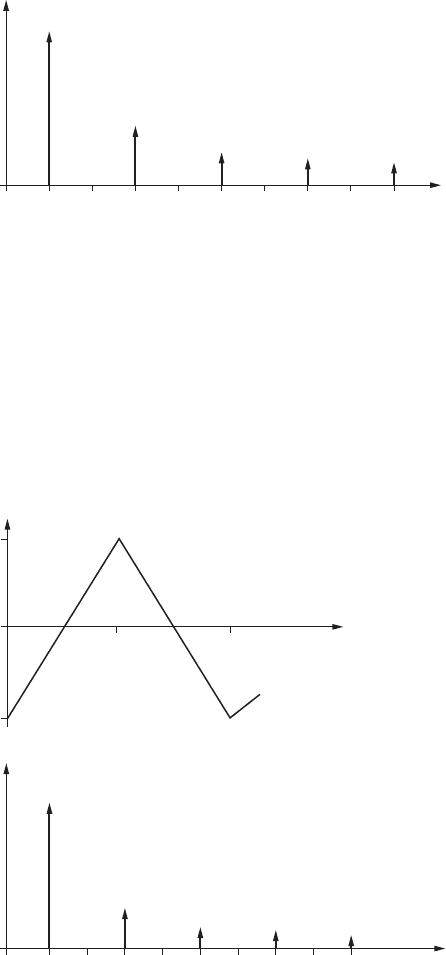
Harmonic amplitude
123456
Harmonic number
789
8
/
π
2
8
/
9π
2
8
/
25π
2
(b)
Figure 4.2 Periodic waveforms. (a) A triangle wave. (b) The spec-
trum of a triangle wave.
We see that the harmonics of the triangle wave (Figure 4.2b) fall off
at a faster rate than those of a square wave. This makes sense since the
triangle wave more closely resembles a pure sine wave than a square
wave, and therefore has fewer harmonics than the square wave.
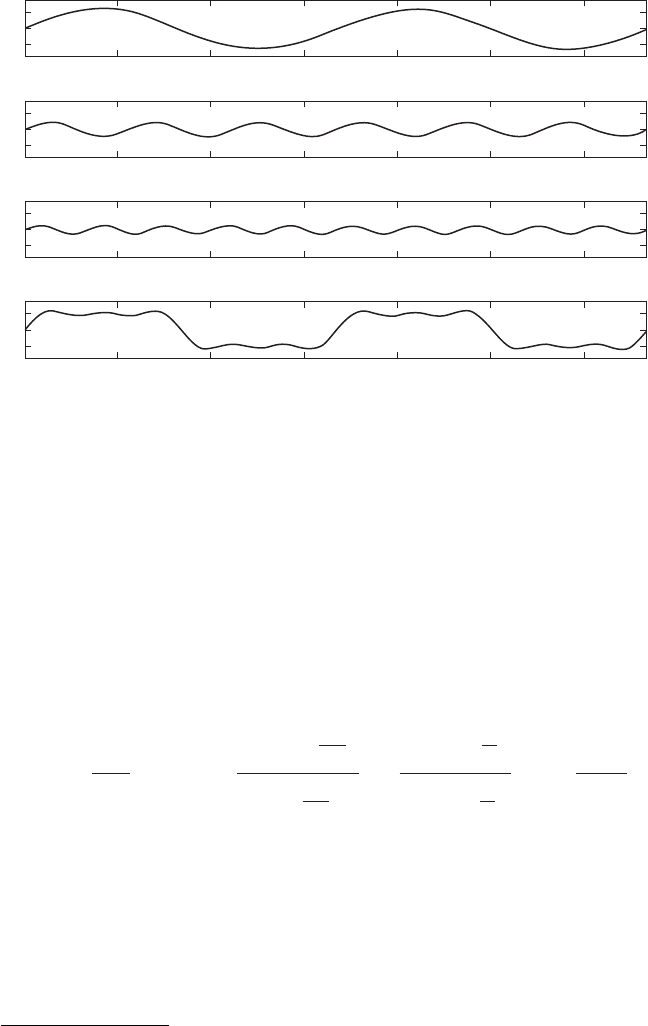
Next, we’ll build up a square wave from its constitutive harmonics.
Shown in Figure 4.3 are the first three harmonics of a square wave (top
three traces) and the resultant wave when the three harmonics are
added (bottom trace).
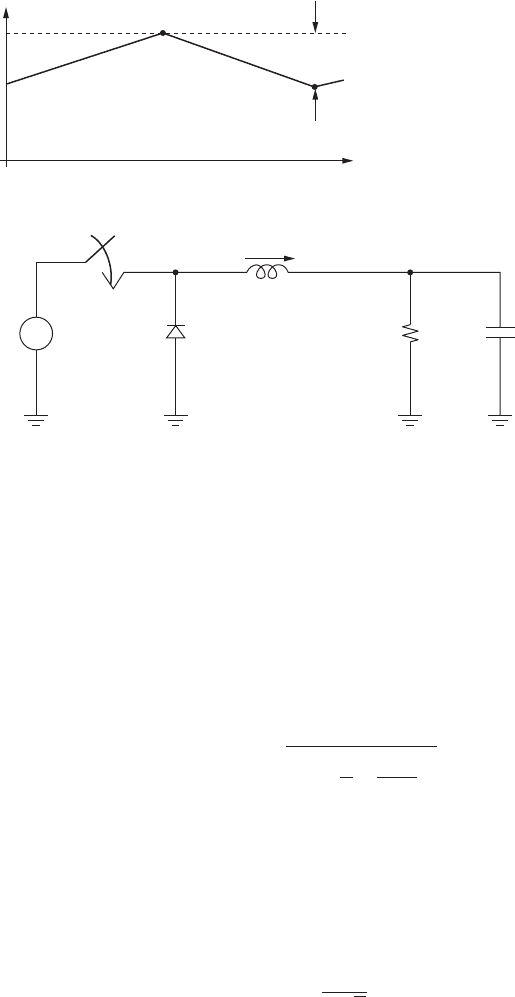
Another waveform often encountered in power systems is the trape-
zoidal waveform (Figure 4.4). This waveform models a switching wave-
form with a finite risetime and falltime. The Fourier series for this
waveform is given by [4.3]:
1
The spectrum for this switching waveform (Figure 4.4) has frequency
components at multiples of the switching frequency f
o
, where f
o
is the
inverse of the switching period, or f
o
1/T. The amplitude of the har-
monics falls off at a rate of –20 dB/decade in the frequency range
between f
1
and f
2
, while above f
2
the harmonic amplitudes fall off at a
i
D
std 5 a
2T
D
T
b
`
N51,2,3c
±
sin pN a
T
D
T
b
pN a
T
D
T
b
≤±
sin pN a
t
r
T
b
pNpN a
t
r
T
b
≤cos a
2pNt
T
b
46 Chapter Four
−1
0
0 0.005 0.01 0.015 0.02 0.025 0.03
1
−1
0
0 0.005 0.01 0.015 0.02 0.025 0.03
1
−1
0
0 0.005 0.01 0.015 0.02 0.025 0.03
1
0
−1
0
0 0.005 0.01 0.015 0.02 0.025 0.03
1
Figure 4.3 The first three harmonics that make up a square wave. Shown are the first har-
monic at 60 Hz (top trace), third and fifth harmonics, and the total waveform (bottom trace)
that is the sum of the three harmonics.
1
This equation assumes the risetime and falltime of the trapezoid are the same.
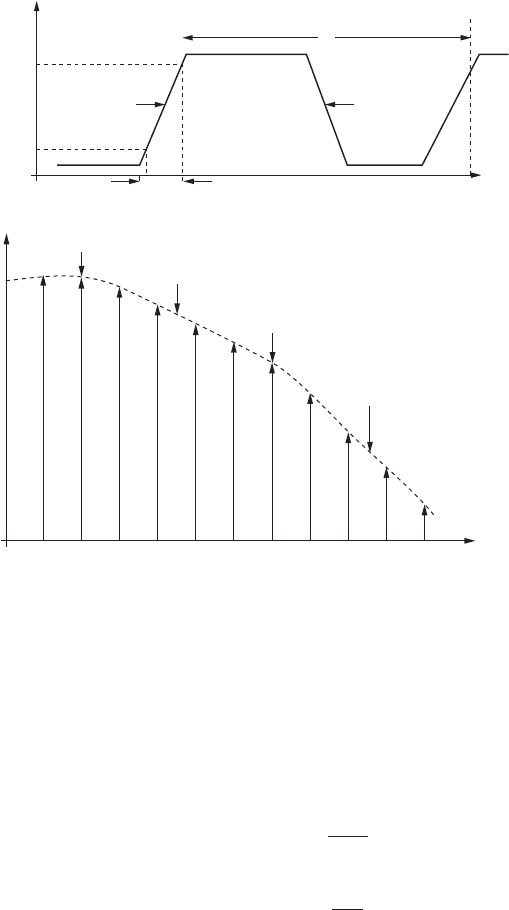
rate of 40 dB/decade. It can be shown that the two corner frequencies f
1
and f
2
are found by [4.4], [4.5]:
Root-mean square
Root-mean square is a measure of the heating value of a periodic waveform
when this periodic waveform drives a resistive load. Mathematically, the
f
2
5
1
pt
r
f
1
5
1
pT
d
Harmonics and Interharmonics 47
T
D
t
r
t
(a)
T
10%
i
D
(t)
90%
f
0
2f
0
3f
0
4f
0
f
1
f
2
−20 dB
/
Decade
5f
0
6f
0
f
(b)
7f
0
8f
0
9f
0
10f
0
11f
0
−40 dB
/
Decade
Figure 4.4 Trapezoidal waveform. (a) Current waveform that may
be produced by a DC/DC converter or other electronic system.
(b) Spectrum.
root-mean square or rms of a periodic voltage waveform is expressed as:
where we see inside the radical that we first square the waveform, and
then take the mean value (or average) of the waveform over one period.
For a sine wave of peak value V
pk
, the rms value is
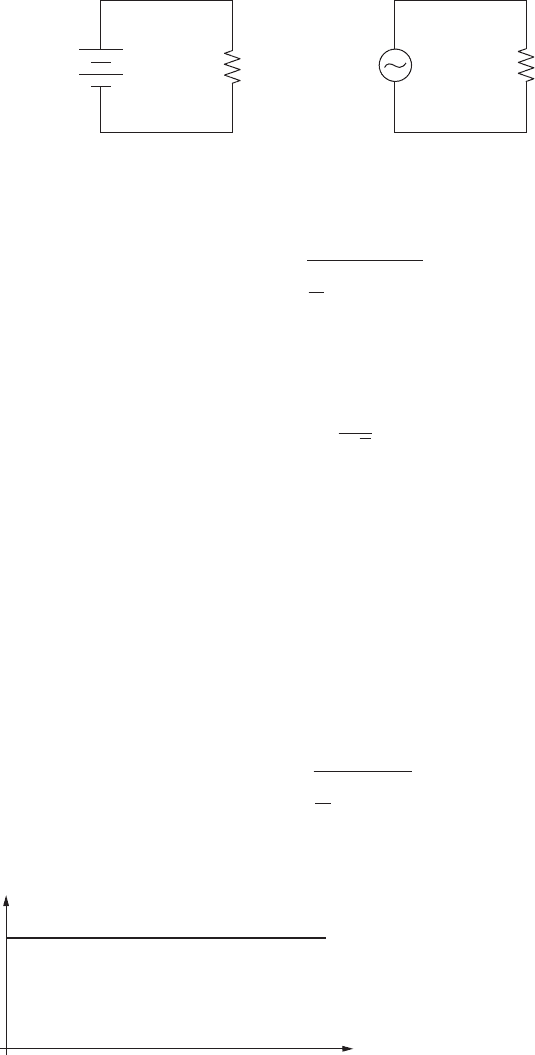
For a square wave (with no DC value) as shown in Figure 4.1a, the
rms value is the peak value of the square wave. The rms value of a
waveform can be interpreted by considering power dissipation. Looking
at Figure 4.5, we see a 120-V DC battery driving a 10- load, and a
120-V AC source (with rms value 120 V) driving a 10- load. The
power dissipation in both loads is the same at 1440 W.
In the following, we’ll discuss a few commonly encountered wave-
forms in power systems and power electronics, and their corresponding
rms (root-mean square) values [4.6]. Remember that the rms value of a
periodic waveform is the square root of the average value of the square
of the waveform over a period. For a periodic current i(t), the corre-
sponding rms value is
I
rms
5
Å
1
T
3
T
0
i
2
stddt
V
rms
5
V
pk
!2
V
rms
5
Å
1
T
3
T
0
[vstd]
2
dt
48 Chapter Four
120 V DC
P = 1440 W P = 1440 W
120 V AC
+
−
10 Ω 10 Ω
Figure 4.5 Illustration of the meaning of rms. The power dissipation in both
cases is the same.
i(t)
t
I
Figure 4.6 DC current.
DC current
A DC current (Figure 4.6) has an rms value equal to the steady-state
current, or:
Pure sine wave
A pure sine wave (Figure 4.7) has an rms value equal to the peak value
divided by the square root of two. In the case of a sine wave with peaks
at 170 V, the rms value is
Square wave
A 50 percent square wave (Figure 4.8) can be generated by full-bridge
and half-bridge power converters. The rms value of this waveform is
I
rms
5 I
pk
V
rms
5
V
pk
!2
5
170
!2
5 120 V
I
rms
5 I
Harmonics and Interharmonics 49
−170
+170
v(t)
t
Figure 4.7 A pure sine wave.
Figure 4.8 A 50 percent duty-cycle
square wave.
I
pk
−I
pk
i(t)
t
DC waveform ⫹ ripple
A DC waveform with a finite peak-peak ripple (Figure 4.9) is generated
by a variety of switching circuits, including motor drives and DC/DC
converters. This waveform has a DC value I
o
and a peak-peak ripple of
∆i
pp
. The rms value of this waveform is
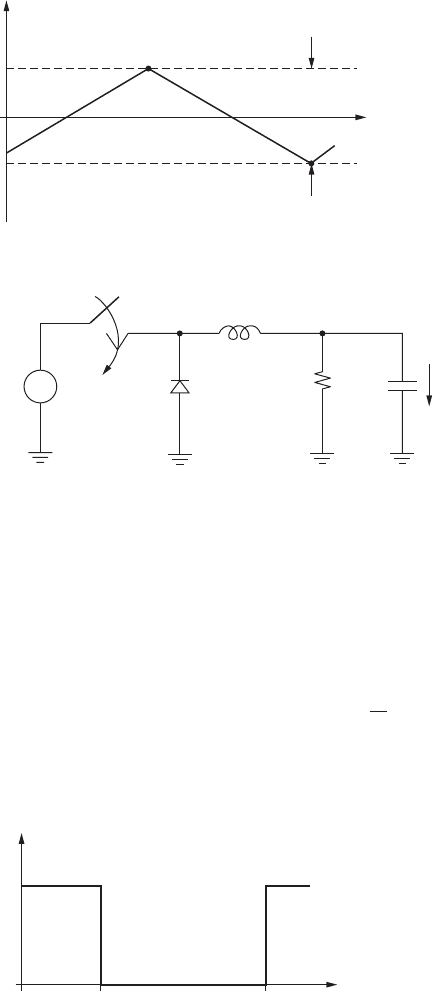
Triangular ripple
A triangular ripple waveform (Figure 4.10) is typical of the capacitor cur-
rent in a variety of switching circuits. In this case, the rms value of the
current is
I
rms
5
i
pp
2!3
I
rms
5 I
o
Å
1 1 a
1
3
ba
i
pp
2I
o
b
2
50 Chapter Four
i(t)
t
(a)
I
0
∆i
PP
(b)
±
D
V
CC
L
R
C
i(t)
Figure 4.9 DC + ripple. (a) Waveform. (b) DC/DC converter circuit that pro-
duces this waveform. In this case, i(t) is the inductor current.
Pulsating waveform
The rms value of a pulsating waveform (Figure 4.11) with duty cycle
D is
I
rms
5 I
pk
2D
Harmonics and Interharmonics 51
i(t)
t
(a)
∆i
PP
±
D
V
cc
L
+
−
R
C
i(t)
(b)
V
o
Figure 4.10 Triangular ripple. (a) A waveform. (b) The DC/DC converter cir-
cuit that produces this waveform. In this case, i(t) is the capacitor current.
i(t)
DT T
t
I
pk
Figure 4.11 Pulsating waveform
with duty cycle D.
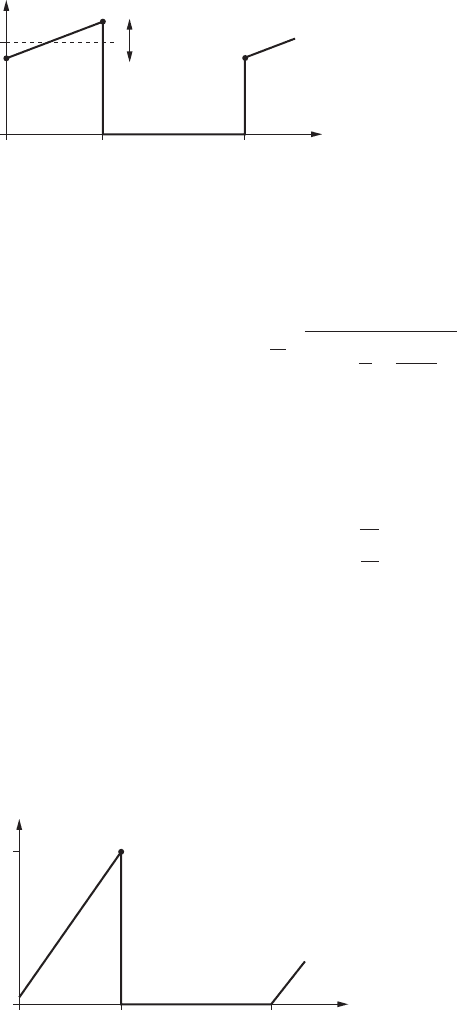
Pulsating waveform with ripple
The rms value of a pulsating waveform (Figure 4.12) with duty cycle D
and peak-peak ripple ∆i
pp
is
Triangular waveform
The rms value of a triangular pulsating waveform (Figure 4-13) with
peak value I
pk
and duty cycle D is
Piecewise Calculation
Let’s assume we have a periodic waveform i(t) that can be broken up
into different frequency components I
1
, I
2
, I
3
, . . . etc. The rms value of
I
1
is I
1
,
RMS.
The rms value of the total waveform made up of the sum of
I
rms
5 I
pk
Å
D
3
I
rms
5 I 2D
Å
1 1 a
1
3
ba
i
pp
2I
b
2
52 Chapter Four
i(t)
DT T
t
I
∆i
PP
Figure 4.12 Pulsating waveform
with duty cycle D and peak-peak
ripple ∆i
pp
.
i(t)
DT T
t
I
pk
Figure 4.13 A triangular waveform.

individual currents is the sum of the squares of the rms values of the
individual components, or:
Total Harmonic Distortion
Total harmonic distortion or THD is a measure of how much harmonic
content there is in a waveform. The total harmonic distortion of a wave-
form is
where V
RMS
is the rms value of the total waveform, and V
1,RMS
is the rms
value of the first harmonic. The THD of a sine wave is 0 percent, and
the THD of a square wave is 48 percent.
Crest Factor
Crest factor is another term sometimes used in power systems analysis,
and represents the ratio of the peak value to the rms value of a waveform.
For a sine wave (Figure 4.14a), the peak value is 1.0 and the rms value is
0.707. Thus, the crest factor is 1.414. For a square wave (Figure 4.14b),
the peak and rms values are both 1.0—hence, the crest factor is 1.0.
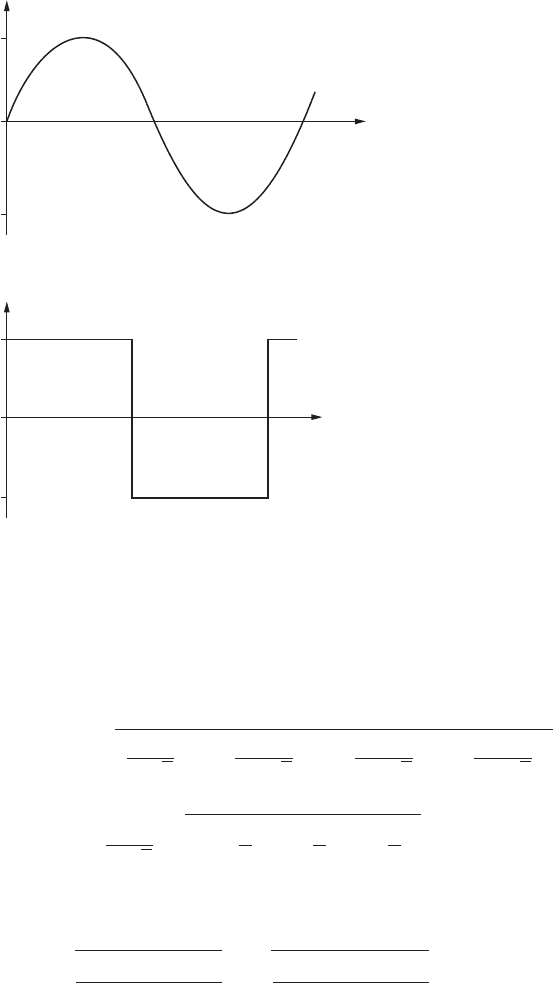
Example 4.1: A truncated square wave. A square wave with peak value +1
has the Fourier series:
A truncated Fourier series approaches the ideal waveform. We’ll next
find the rms value and total harmonic distortion for a square wave
waveform with harmonics present up to the seventh. The total waveform
for this example is
The rms value of the first harmonic is
V
1,rms
5
4
π!2
5 0.9
vstd 5 a
4
p
bsinsvtd 1 a
4
3p
bsins3vtd 1 a
4
5p
bsins5vtd 1 a
4
7p
bsins7vtd
vstd 5
`
n51
a
4
np
bsin s2pntd
THD 5
Å
V
2
rms
2 V
2
1,rms
V
2
1,rms
I
rms
5 2I
2
1,rms
1 I
2
2,rms
1 I
2
3,rms
1 ???
Harmonics and Interharmonics 53
The rms value of this total waveform is
The total harmonic distortion is
This waveform is shown in Figure 4.15.
THD 5
Å
V
2
rms
2 V
2
1,rms
V
2
1,rms
5
Å
s0.974d
2
2 s0.9d
2
s0.9d
2
5 0.414 5 41.4%
5 a
4
p!2
b
Å
1 1 a
1
3
b
2
1 a
1
5
b
2
1 a
1
7
b
2
5 0.974
V
rms
5
É
a
4
p!2
b
2
1 a
4
3p!2
b
2
1 a
4
5p!2
b
2
1 a
4
7p!2
b
2
54 Chapter Four
−1.0
+1.0
t
(a)
−1.0
+1.0
t
(b)
Figure 4.14 Waveforms illustrating the crest factor. (a) A
sine wave with peak value 1.0. (b) A square wave with
peak value 1.0.