Patrick F. Dunn, Measurement, Data Analysis, and Sensor Fundamentals for Engineering and Science, 2nd Edition
Подождите немного. Документ загружается.

446 Measurement and Data Analysis for Engineering and Science
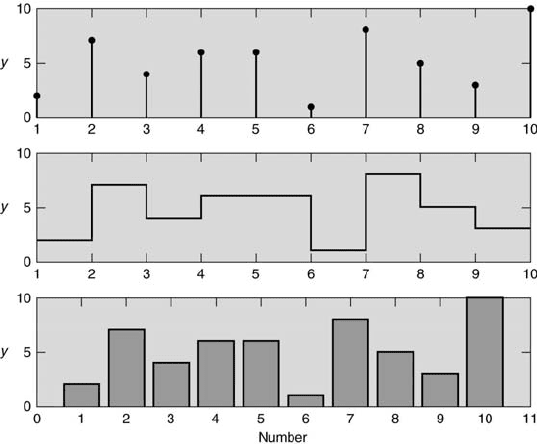
FIGURE 12.3
Ten sequential values plotted using the MATLAB stem (top), stairs (mid-
dle), and bar (bottom) commands.
extends a line from the abscissa up to the ordinate value that is designated
by a marker. A stairs plot connects lines from each ordinate value to the
next, mimicking a stairway. The bar plot gives a rectangular bar of a fixed
width for each ordinate value. The type of presentation determines which
plot is best.
Often when the amounts that contribute to a whole need to be displayed,
the pie chart is used. This graphically is in the shape of a circular pie, as
shown in Figure 12.4, in which each contributing amount is displayed as a
sector of the pie. Each sector’s area is its proportional contribution to the
total area. Usually, each sector has a different color.
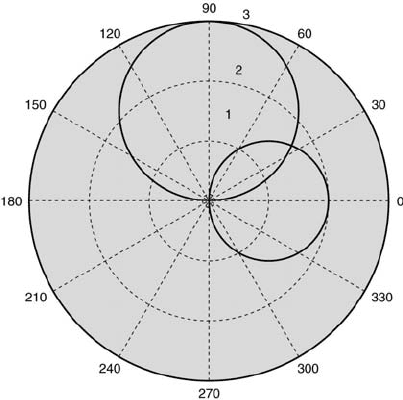
Some data may follow an angular dependence, such as those representing
acoustic radiation or the surface pressure distribution around an object. A
polar plot, such as that shown in Figure 12.5, can be constructed for this
purpose. The magnitude of the variable for a given θ is plotted as a distance
from the origin. Data that represent cyclic processes will pass more than
once through the origin.
The following guidelines should be followed when constructing plots (re-
fer to Figure 12.1 as an example):

*Technical Communication 447
FIGURE 12.4
A standard pie chart (left) and a pie chart with “exploded” areas (right).
• A title or caption must be present.
• Both the abscissa and ordinate must be labeled with the name of the
quantity plotted and its units in brackets or parentheses.
• Tick marks should be used on each side of both axes. Internal tick marks
are preferable.
• All curves must be labeled either on the plot using arrow indicators or
in the plot’s legend when more than one curve is plotted.
• Analytical results must be plotted as a solid curve. Do not use symbols.
• Numerical results must be plotted as a dashed or dotted curve. Do not
use symbols.
• Experimental results must be denoted with symbols and error bars, using
the same symbol for a given data set.
• Any curve representing an estimate must be presented with ± confidence
limit curves evaluated at P percent confidence.
12.3 Technical Memo
The format of a technical memo is similar to that commonly used in industry
and at national laboratories. It is a concise, formal presentation of findings
on a particular technical issue. It is not a comprehensive explanation of the
theoretical or experimental methods used, but rather it is a summary high-
lighting the results obtained. Typically, the body of a technical memo should
448 Measurement and Data Analysis for Engineering and Science
FIGURE 12.5
A polar plot of 3sin(θ) centered along the θ = 90 axis and 2cos(θ) centered
along the θ = 0 axis.
not exceed two to three pages in length, excluding any supporting material
that usually is placed in appendices. The following format is suggested.
Date: 1/18/10
To: Professor P.F. Dunn
From: I.M.A. Student
Subject: Rocket Thrust Measurement
Summary: This should be one paragraph that summarizes the impor-
tant results and states the significant conclusions. When writing this section,
assume that this may be the only part of the technical memo that actually
is read. Thus, it needs to be self-contained and not refer to any other writ-
ten section, graphs, and tables that are contained in the body of the memo.
Key results must be presented. Values of important experimental parameter
ranges must be included. If theory also is presented, a quantitative state-
ment about agreement or disagreement with the experimental results needs
to be made.
Findings: This part covers in more detail what was summarized above.
Enough information must be provided such that an engineer at your level
could critically evaluate the approach and methods and understand how you
arrived at the results and conclusions, without your providing any informa-
tion beyond what is written. Only the most important figures and tables

*Technical Communication 449
need to be included here. Supporting material such as additional plots, pro-
gram listings, or flow charts can be included as attachments (appendices) to
the memo. All figures and tables must be numbered and referenced properly
in the text. Include only the material that you consider necessary to sup-
port the conclusions. Never present results, especially in figures and tables,
that you do not specifically discuss in this section. Do not attach volumes
of computer-generated output without any explanation. The reader is im-
pressed not by the volume of data collected but by the value of it.
References: References must be numbered in consecutive order. Do
not include any references that are not cited in the memo. The following
reference format conforms to that specified by The Chicago Manual of Style
[5]:
Journal article references: 1. Student, N.O.D., and S.A.M. College. 2010.
Measurements through a Hard Semester. J. Heat Mass Transfer 11:548-556.
This includes the last names and first and middle initials of all of the
authors, the year of publication, the title of the article, the abbreviated title
of the journal (italicized), the volume number, and inclusive page numbers
of the article.
Book references: 2. M. A. Saad. 1992. Compressible Fluid Flow. 2nd ed.
New Jersey: Prentice Hall Inc.
The book title is italicized.
Appendices: These addenda contain supplementary material, such as
detailed derivations or calculations. They are not meant to contain a record
of everything that was done on the memo’s subject. Include only what is
needed to support material presented in the body of the memo. Do not place
the results here and then refer to them from the memo.
12.4 Technical Report
This section describes the format that typically is required for laboratory
reports. This format essentially parallels that of many journal publications.
Each of the following sections need to be included in the report. As stated
for the technical memo, write the report as if you were writing to another
engineer at your level. The suggested format is described below.
1. Title Sheet: List the class and its number, report title and number,
your name, all group members’ names, and the date. This is the cover sheet
of the report. It does not have a page number.
450 Measurement and Data Analysis for Engineering and Science
2. Abstract: The primary purpose of the abstract is to provide the
reader with a brief and sufficient summary of the project and its results.
It is to be short (no more than approximately 100 words) and informative.
It must indicate clearly the nature and range of the results contained in
the report. The abstract must stand alone. No citing of numbered refer-
ences, symbols, and so forth, must be made unless they are obvious without
any reference to the report. The easiest procedure is to write the abstract
summarizing the entire body of the report after the report has been written.
3. Table of Contents: Each of the subsequent sections should be listed
with its corresponding first page number in the report.
4. List of Symbols (Nomenclature): English symbols are first listed
in alphabetical order, then Greek symbols in alphabetical order. Be sure
to describe adequately your nomenclature, for example, not just ‘viscosity’
but either ‘absolute (dynamic) viscosity’ or ‘kinematic viscosity’. Also note
that in some cases the mere descriptive name of the symbol is not sufficient.
For example, when listing coordinates be sure to specify the coordinates’ di-
rections with respect to some reference point. Also, when describing nondi-
mensional numbers, specify their definitions in terms of the other symbols
listed. The best procedure in gathering the nomenclature is to construct the
list of symbols after the body of the report has been written.
5. Introduction: This section introduces the reader to the nature of the
problem under investigation. It explains the history and relevance of such an
experiment and its application. Previously published papers relevant to the
experiment should be cited here. The general objectives of the experiment
should be stated. Do not simply summarize the experimental objectives.
Provide a guide for the reader as to what will follow in the report.
6. Approach: This section sometimes is referred to as methods or proce-
dure. It needs to describe briefly the experimental, analytical, and numerical
methods used to arrive at the results. There must be sufficient detail to per-
mit a critical evaluation of the methods used and replication of the results
by another party. It is not necessary, however, to give full descriptions of
all of the methods that are described in detail elsewhere, for example, how
a particular numerical integration scheme works step-by-step. Uncertainty
estimates for all parameters and procedures used to arrive at the results
must be provided. Usually, it is preferable to present these estimates in a
table. A block diagram or flow chart of the steps in the approach can be very
helpful to the reader. Alternatively, a step-by-step approach can be put in
narrative form. A flow chart should be included for each computer program
used. A listing of each program should be presented in an appendix and
documented with sufficient comments such that it can be followed easily by
the reader.
7. Results: The results of your experiment are presented here, usually
facilitated by graphs, figures, and tables. The findings of the experiment

*Technical Communication 451
are presented but neither discussed nor evaluated in this section. Keep in
mind that you want to be concise when presenting the results. Put results
in graphical form whenever possible. Sample calculations can be put in an
appendix. When the results cover several aspects of the project, subdivide
this section such that each part deals with one major aspect. The results of
an uncertainty analysis must be provided. Detailed, supporting calculations
should be presented in an appendix. Mention specifically what is contained
in each figure and table. Do not say, for example, that “the results are shown
in figures 1 through 6,” and then fail to explain what is presented in each
figure.
8. Discussion: This section should include a discussion and evaluation
of the results obtained and their relation to other pertinent studies, if any.
The findings of your experiment are interpreted in this section. Express
your scientifically justified opinion in this section about the facts that were
presented in the previous section. Remember the distinction between fact
and opinion. Point out the limitations of how you approached the experiment
and how you would improve on your approach. Be constructively critical.
Describe what you have learned from the experiment.
9. Conclusions: Briefly conclude the major findings of your experiment.
Do not introduce anything new or continue to discuss the results.
10. References: These follow the same guidelines as for the technical
memo.
11. Appendices: These follow the same guidelines as for the technical
memo.
12.5 Oral Technical Presentation
Many technical societies now have web pages that provide instructions for
speakers [6]. The mode of oral presentation has changed considerably over
the past several years. Most professional presentations now are made using
standard software packages. The resulting, user-designed slides are projected
digitally. Thus, the visual format of the presentation becomes very impor-
tant.
The success of an excellent presentation lies in its organization, prepara-
tion, and delivery. The amount of time spent in preparing an oral presenta-
tion should be equivalent to that spent in writing a technical paper. Some-
times preparing an oral presentation is even more challenging. The listener
is not as attentive as a reader. Presentation time is limited. The presen-
ter must speak with confidence and enthusiasm for the talk to be effective.
Adequate time for preparation and practice must be spent to produce a
452 Measurement and Data Analysis for Engineering and Science
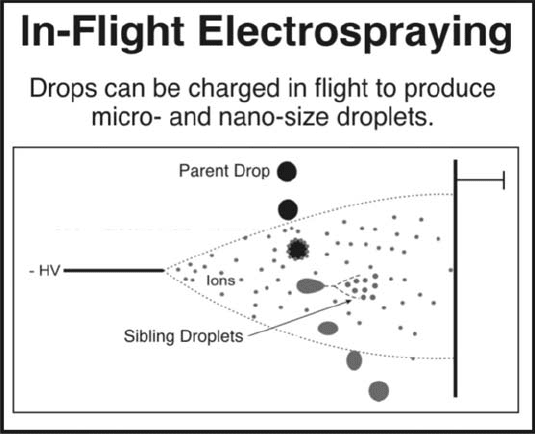
FIGURE 12.6
Example slide with suggested font size.
professional and well-received presentation. Practice also allows timing to
be rehearsed.
Most presentations have two implicit goals: to deliver information and to
have the audience understand it. This requires that information be presented
clearly and concisely such that it is easily understood. The presentation
must be substantive, including a statement of the problem, followed by a
description of its solution, and the results.
Some guidelines for a good oral presentation are as follows:
• Start with a title slide, followed immediately by a slide that outlines the
talk.
• Break the body of the talk into sections, each making a specific point.
• Guide the listeners through the presentation by referring back to the
outline at appropriate times.
• Conclude with a slide that summarizes the main points.
• Minimize the number of words and information presented on a slide.
Keep it simple. Going into unnecessary detail will only lose the audience.
• Use an appropriate font size and type that is supported by a contrasting,
simple, and pleasing background. Place an 8 in. by 10 in. copy of a slide
*Technical Communication 453
on the floor. You should be able to read it clearly while standing directly
over it. Refer to Figure 12.6 as an example.
• Follow the same rules for figures and equations that would be done for
a written document. Label the axes. Provide units. Define all variables.
• Use your notes as a guide. Do not read directly from them.
• Stay focused on the topic. Avoid rambling beyond what was planned.
• Watch the time. Pace yourself. Do not exceed the time allotment.
• Speak enthusiastically. Do not speak in a monotone. Vary the rate and
pitch.
• Try to stand near one place. Avoid walking aimlessly around.
• Avoid unconscious gestures, especially with your hands.
• Use a pointer to focus attention on an area of a slide. Do not uncon-
sciously wave the pointer around, especially a laser pointer, as it is very
distracting.
• Look directly at the audience. Do not look over peoples’ heads or stare
at the floor.
• Avoid using vocal pauses, such as “you know” and “ah”. Have someone
listen to a practice presentation and note the number of vocal pauses
made. You may be surprised at how many times you pause. Learn to
break the habit.
• If you make a mistake, correct it and go on. Avoid joking about it or
making excuses for it. Be confident!
• Finally, relax and enjoy giving the presentation. It represents your hard
work and interest.
454 Measurement and Data Analysis for Engineering and Science
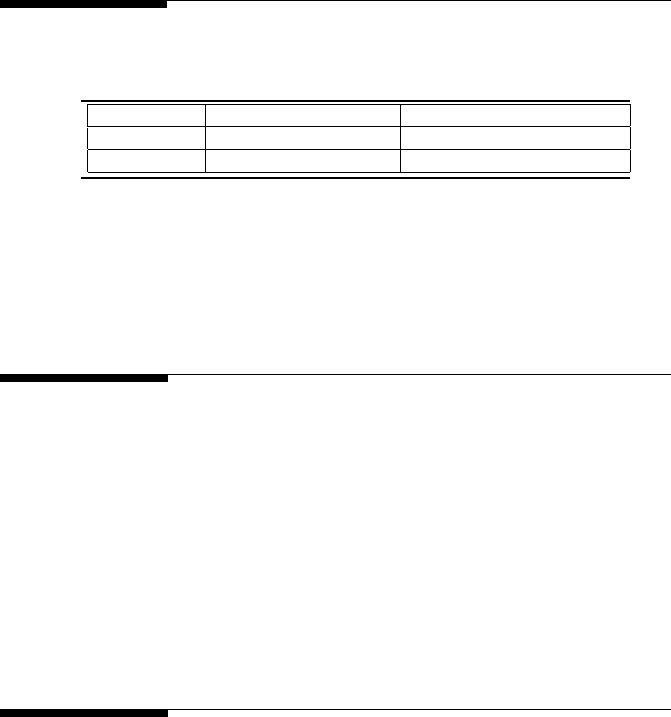
12.6 Problem Topic Summary
Topic
Review Problems
Homework Problems
Writing
1, 2
Formatting
1, 2, 3, 4, 5
TABLE 12.1
Chapter 12 Problem Summary
12.7 Review Problems
1. A technical memo should contain only the following sections: (a) ab-
stract, introduction, results, (b) abstract, results, conclusions, (c) in-
troduction, results, conclusions, (d) summary, list of symbols, results,
references, (e) summary, findings, references.
2. Technical memoranda are presented customarily in what tense? (a) fu-
ture, (b) passive, (c) past, (d) present, (e) subjunctive.
12.8 Homework Problems
1. Correct each of the following if it contains any format errors. (a) 2 − 3
m/s, (b) 35 %, (c) 23 045.62, (d) 1.2E-4 J, (e) 23.4kg.
2. Identify all of the instances of incorrect format in the sentence: A circular
arc’s angle of 47.2
◦
, which is 4.2 in. long, is equivalent to 4 × 10
−3
sr
on a sphere.
3. The text below was taken from an abstract written to describe the results
of an experiment. For each numbered and underlined group, identify, if
any, the improperly formatted terms by providing the corresponding
correctly formatted versions.

*Technical Communication 455
4. An experiment was conducted to determine the heat transfer from a
hot heat exchanger tube to air. The velocity of the air was set as (1)
20 ft./sec (240 in./sec)
. Its flow rate was (2) 525 liters/min
. An optical
pyrometer recorded the surface temperature of the tube, (3) T
, to be
(4) 2,000
◦
F
. The temperature of the air was (5) 65%
less.
5. The text below was taken from an abstract written to describe the results
of an experiment. For each numbered and underlined group, identify, if
any, the improperly formatted terms, and then provide the correspond-
ing correctly formatted versions.
An experiment was conducted to determine the cross-sectional (1)
(x and y)
distribution of the velocity of air at various (2) z
locations
along the length of a wind tunnel having a (3) 1 × 2 m
cross-section.
The velocity measurements made were in the range of (4) 14-30 m/sec
.
The air temperature, (5) T
, was (6) 72
◦
F
and the volumetric flow rate,
(7) Q
, was set at (8) 30 liters/min ±2%
for the entire duration of the
experiment.
6. Correct each of the following if it contains any format errors.
(a) 23 045.62, (b) 1.2E-4J, (c) 23.4kg.