Patrick F. Dunn, Measurement, Data Analysis, and Sensor Fundamentals for Engineering and Science, 2nd Edition
Подождите немного. Документ загружается.

396 Measurement and Data Analysis for Engineering and Science
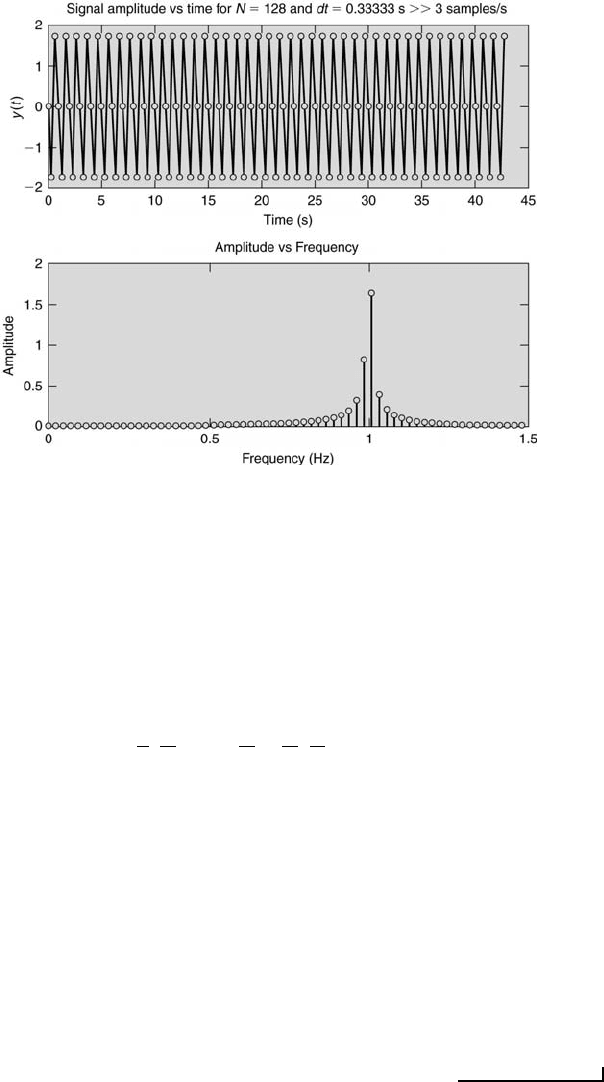
FIGURE 10.14
Signal and frequency spectrum with dt = 1/3 s.
of T
1
and T
2
is sought. Recalling that T = Nδt = N/f
s
, if m/2 = N/f
s
no amplitude
ambiguity will be present. That is, when N = f
s
(m/2) = (5/2)m, with m and N
integers, there will be no amplitude ambiguity. This occurs, for example, when m = 2
(with N = 5) and m = 4 (with N = 10). However, all the frequencies of interest should
be seen in the spectrum. The highest frequency of interest is f
max
= f
N
= f
s
/2.
Because there are N/2 discrete frequencies and assuming that f
min
= 0 needs to be
considered, this yields
f
max
=
1
T
(
N
2
− 1) =
f
s
2
=
f
s
N
(
N
2
− 1) (T = N/f
s
).
Solving for N,
N = 2f
s
/(f
s
− 4).
So, when f
s
= 5, N = 10/(5 −4). Thus, N = 10 is the minimum N needed to see both
components.
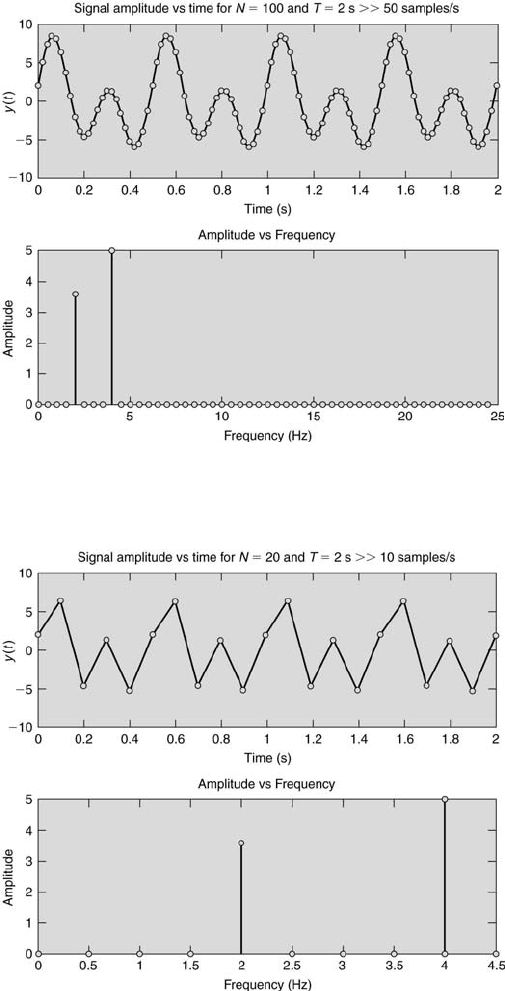
For case (i), the discrete signal and the amplitude-frequency spectrum are correct.
This is shown in Figure 10.15.
For case (ii), the spectrum remains correct and the discrete signal, although still
correct, does not represent the signal well because of the lower sampling rate. This is
illustrated in Figure 10.16.
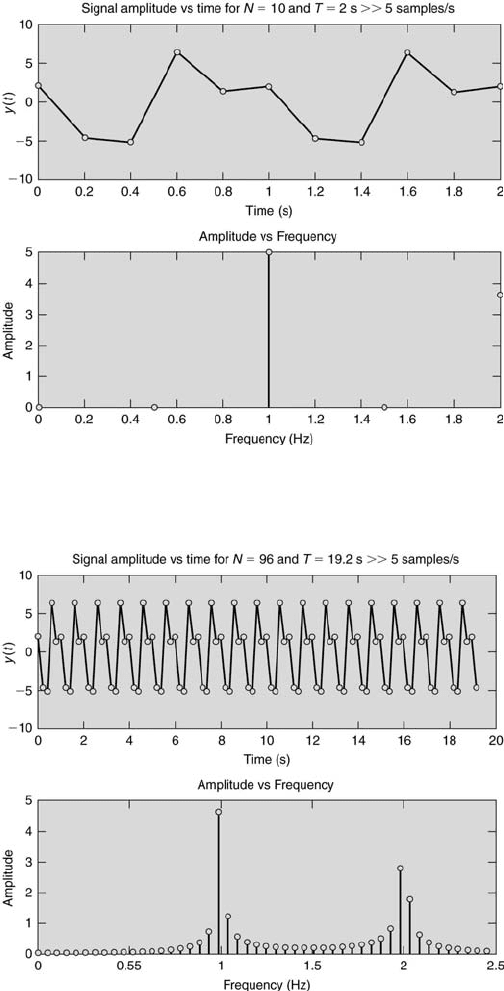
For case (iii), the 4 Hz component is aliased down to 1 Hz and the 2 Hz component
is correct. No amplitude ambiguity has occurred. This is displayed in Figure 10.17.
For case (iv), amplitude ambiguity has occurred for both components and only the
4 Hz component is aliased down to 1 Hz. This is shown in Figure 10.18.
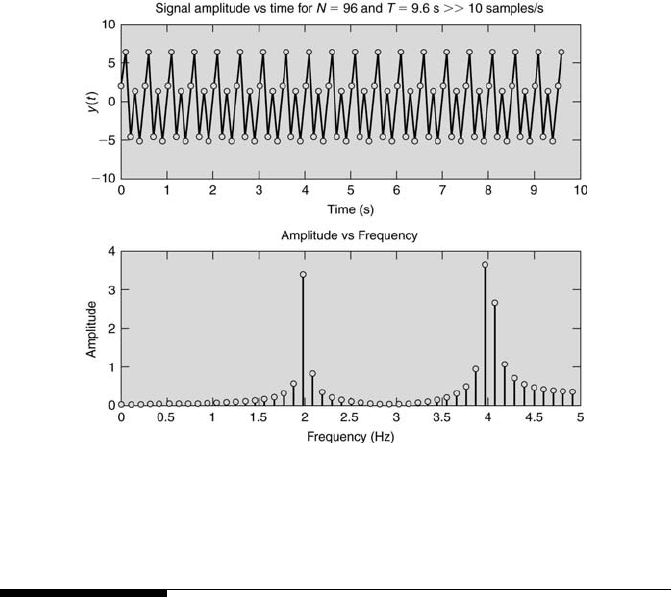
For case (v), amplitude ambiguity has occurred but not aliasing. This is presented
in Figure 10.19.
Signal Analysis 397
FIGURE 10.15
Signal and frequency spectrum with N = 100, f
s
= 50.
FIGURE 10.16
Signal and frequency spectrum with N = 20, f
s
= 10.
398 Measurement and Data Analysis for Engineering and Science
FIGURE 10.17
Signal and frequency spectrum with N = 10, f
s
= 5.
FIGURE 10.18
Signal and frequency spectrum with N = 96, f
s
= 5.
Signal Analysis 399
FIGURE 10.19
Signal and frequency spectrum with N = 96, f
s
= 10.
10.7 *Windowing
Because either an aperiodic or random signal does not have a period, the
Fourier transform applied to such a signal’s finite record length produces
leakage in its spectrum. This effect can be minimized by applying a win-
dowing function. This process effectively attenuates the signal’s ampli-
tude near the discontinuities that were discussed previously in Section 10.6,
thereby leading to less leakage. The windowing function actually is a func-
tion that weights the signal’s amplitude in time. The effect of a windowing
function on the spectrum can be seen by examining the convolution of two
Fourier transforms, one of the signal and the other of the windowing func-
tion. This is considered next.
The discrete Fourier transform of y(t) can be viewed as the Fourier trans-
form of an unlimited time history record v(t) multiplied by a rectangular
time window u(t) where
u(t) =
1 0 ≤ t ≤ T
0 otherwise.
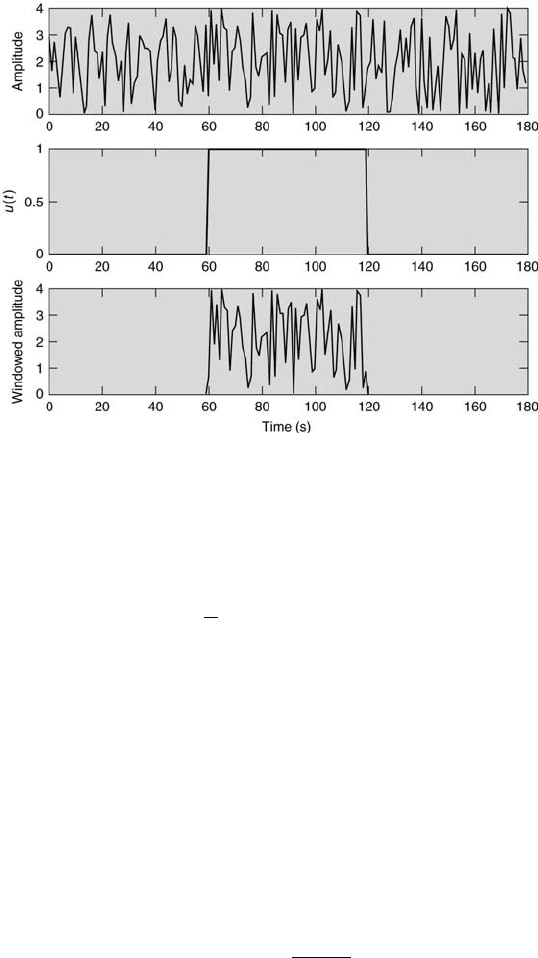
400 Measurement and Data Analysis for Engineering and Science
FIGURE 10.20
Rectangular windowing.
This is illustrated in Figure 10.20. Now,
Y
n
(f, T ) =
1
T
Z
T
0
y
n
(t) exp[−i2πft]dt, (10.17)
which leads to
Y (f) =
Z
∞
−∞
U(α)V (f − α)dα. (10.18)
This is the convolution integral [3]. So, the Fourier transform of y(t), Y (f),
is the convolution of the Fourier transforms of u(t) and v(t), which are
denoted by U(α) and V (f − α), respectively. For the present application,
u(t) represents the windowing function and y(t) is v(t). The record length is
denoted by T . Various windowing functions can be used. They yield different
amounts of leakage suppression.
The rectangular windowing function u
rect
(t) has the Fourier transform
U
rect
(f), given by
U
rect
(f) = T
sin πft
πft
. (10.19)
The relatively large side lobes of |U (f)/U (0)| produce a leakage at frequen-
cies separated from the main lobe. This produces a distortion throughout the
spectra, especially when the signal consists of a narrow band of frequencies.
This is illustrated in Figure 10.21.
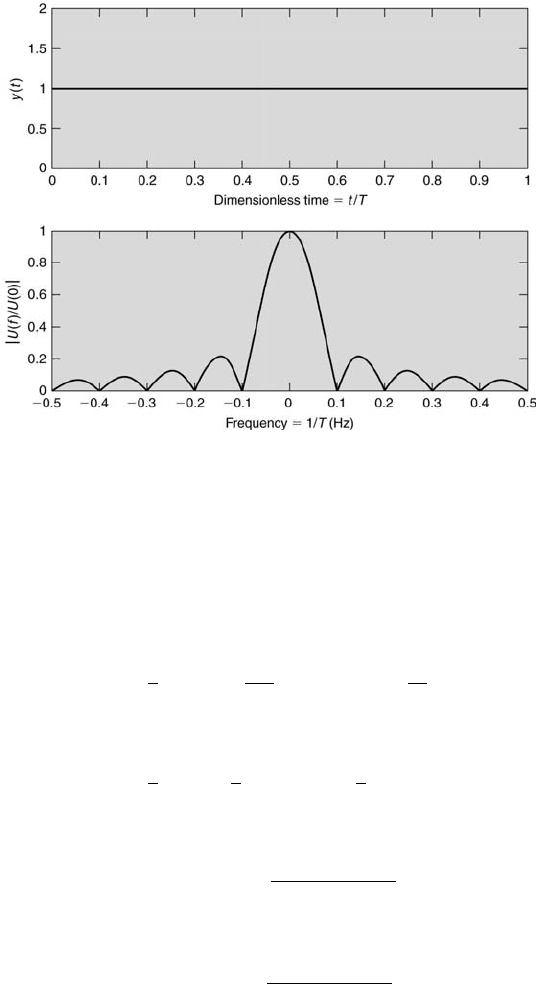
Signal Analysis 401
FIGURE 10.21
The rectangular (boxcar) window.
It is better to taper the signal to eliminate the discontinuity at the
beginning and end of the data record. There are many types of tapering
windows available. The cosine-squared window, also known as the Hanning
window, is used most commonly. This is given by
u
hanning
(t) =
1
2
1 − cos
2πt
T
= 1 − cos
2
πt
T
,
(10.20)
when 0 ≤ t ≤ T . Otherwise, u
hanning
= 0. Further,
U
hanning
(f) =
1
2
U(f) +
1
4
U(f − f
1
) +
1
4
U(f + f
1
), (10.21)
where f
1
= 1/T and U(f ) is defined as before with
U(f − f
1
) = T
sin π(f −f
1
)T
π(f − f
1
)T
(10.22)
and
U(f + f
1
) = T
sin π(f + f
1
)T
π(f + f
1
)T
. (10.23)
The Hanning window is presented in Figure 10.22.
Finally, it should be noted that windows reduce the amplitudes of the
spectrum. For a given window, this loss factor can be calculated [2]. For
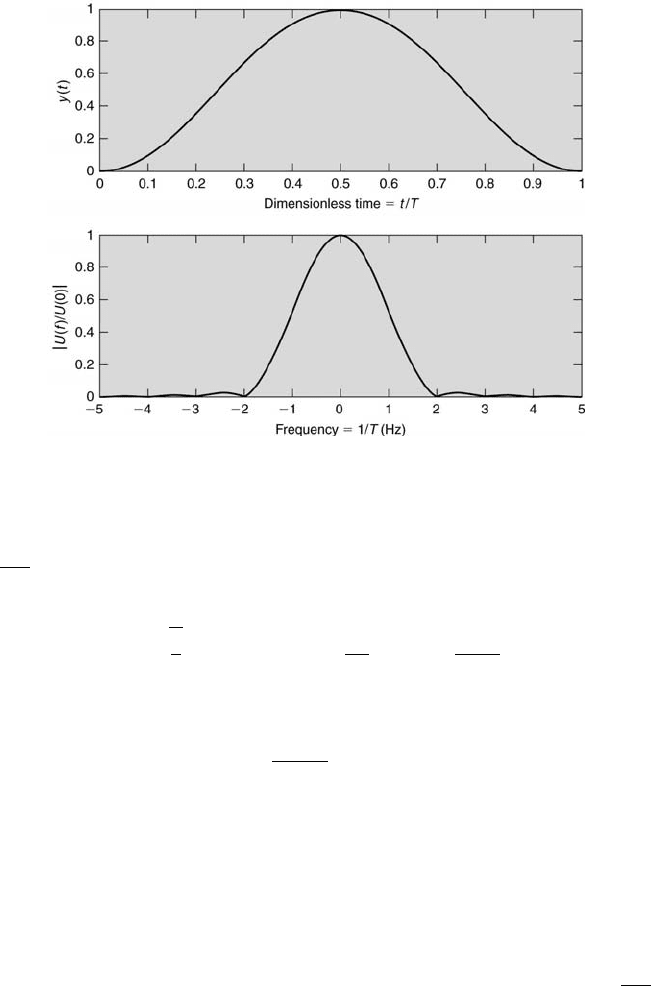
402 Measurement and Data Analysis for Engineering and Science
FIGURE 10.22
The Hanning window.
the Hanning window, the amplitude spectrum must be scaled by the factor
p
8/3 to compensate for this attenuation. Thus,
Y
n
(f
k
) = δt
r
8
3
N−1
X
n=0
y
nk
1 − cos
2
πn
N
exp
−i
2πkn
N
, (10.24)
with f
k
= k/(N δt), where k = 0, 1, 2, . . . , N/2 and
G
y
(f
k
) =
2
n
d
Nδt
n
d
X
i=1
|Y
n
(f
k
)|
2
. (10.25)
The recommended procedure [2] for computing a smoothed amplitude
spectrum is the following:
1. Divide data into n
d
blocks, each of size N = 2
M
.
2. Taper the data values in each block {y
n
} (n = 0, 1, 2, . . . , N − 1) with a
Hanning or other window.
3. Compute the N-point FFT for each data block yielding Y
n
(f
k
), adjusting
the scale to account for the tapering loss (for example, multiply by
p
8/3
for the Hanning window).
4. Compute G
y
(f
k
) for n
d
blocks.

Signal Analysis 403
10.8 Problem Topic Summary
Topic
Review Problems
Homework Problems
Sampling
1, 2, 5
1, 2, 3, 4, 5, 6, 7, 8, 9
Aliasing
4
2, 3, 4, 5, 6, 7, 8, 9,
Amplitude Ambiguity
3
2, 4, 7, 9
TABLE 10.1
Chapter 10 Problem Summary
10.9 Review Problems
1. Determine the number of discrete frequencies from the minimum to and
including the maximum frequency that will appear in an amplitude-
frequency plot of a signal sampled every 0.2 s. The signal’s minimum
frequency is 0.5 Hz.
2. Determine the frequency resolution of a signal sampled 256 times for a
period of 4 s.
3. Does windowing of a signal produce a signal with no amplitude distor-
tion?
4. Determine the aliased frequency, in Hz, of a 100-Hz sine wave sampled
at 50 Hz.
5. The frequency resolution, in Hz, of a signal sampled 256 times for a
period of 4 s is (a) 256 (b) 1/4, (c) 4/256, or (d) 4.
10.10 Homework Problems
1. A discrete Fourier transform of the signal B(t) = cos(30t) is made to
obtain its power-frequency spectrum. N = 4000 is chosen. Determine
(a) the period of B(t) (in s), (b) the cyclic frequency of B(t) (in Hz),
(c) the appropriate sampling rate (in samples/s), and (d) the highest

404 Measurement and Data Analysis for Engineering and Science
resolvable frequency, f
max
(in Hz). Finally, (e) if N = 4096 was chosen
instead, would the computations of the Fourier transform be faster or
slower and why?
2. Using a computer program written by yourself or constructed from avail-
able subroutines, calculate and plot the following: one plot containing
the continuous signal y(t) and its discrete version versus time, and the
other plot containing the amplitude spectrum of the discrete sample.
Provide a complete listing of the program. Do this for each of the cases
below. Support any observed aliasing or leakage of the sample by appro-
priate calculations. State, for each case, whether or not aliasing and/or
leakage occur. The continuous signal is given by
y(t) = 5 sin(2πt + 0.8) + 2 sin(4πt) + 3 cos(4πt) + 7 sin(7πt).
The cases to examine are (a) N = 100, T = 10 s, (b) N = 100, T =
18 s, (c) N = 100, T = 20 s, (d) N = 100, T = 15 s, and (e) N = 50,
T = 15 s, where N represents the number of sample points and T the
sample period.
3. Consider the signal y(t) = 5 + 10 cos(30t) + 15 cos(90t). Determine (a)
the frequencies (in Hz) contained in the signal, (b) the minimum sample
rate (in samples/s) to avoid aliasing, and (c) the frequency resolution
of the frequency spectrum if the signal is sampled at that rate for 2
seconds. Finally, sketch (d) the amplitude-frequency spectrum of y(t)
and (e) the amplitude-frequency spectrum if the signal is sampled at 20
samples/s.
4. A velocity sensor is placed in the wake behind an airfoil subjected to a
periodic pitching motion. The output signal of the velocity transducer
is y(t) = 2 cos(10πt) + 3 cos(30πt) + 5 cos(60πt). Determine (a) the
fundamental frequency of the signal (in Hz), (b) the maximum frequency
of the signal (in Hz), (c) the range of acceptable frequencies (in Hz) that
will avoid signal aliasing, and (d) the minimum sampling frequency (in
Hz) that will avoid both signal aliasing and amplitude ambiguity if 20
samples of the signal are taken during the sample period. Finally, if
the signal is sampled at 20 Hz, determine (e) the frequency content of
the resulting discrete series, y(δnt), and (f) the resulting discrete series
y(δnt).
5. The signal y(t) = 3 cos(ωt) has a period of 4 seconds. Determine the
following for the signal: (a) its amplitude, (b) its cyclic frequency, (c)
the minimum sampling rate to avoid aliasing, (d) its mean value over
three periods, and (e) its rms value over two periods. The formula
R
[cos(ax)]
2
dx =
1
a
[−
1
2
cos(ax) sin(ax) +
1
2
ax] may or may not be useful.
Signal Analysis 405
6. At what cyclic frequency will the signal y(t) = 3 sin(4πt) appear if (a)
f
s
= 6 Hz, (b) f
s
= 4 Hz, (c) f
s
= 2 Hz, and (d) f
s
= 1.5 Hz?
7. For the deterministic signal y(t) = 2 + 3 sin(6πt) + 4 sin(18πt), sketch
the amplitude-frequency spectrum of y(t) (a) when the signal is sampled
at a rate of 24 Hz (indicate by solid lines) and (b) when it is sampled
at a rate of 12 Hz (indicate by dashed lines). Finally, (c) determine
the minimum sample period (in s) to avoid amplitude ambiguity in the
amplitude-frequency spectrum.
8. At what cyclic frequency will the signal y (t) = 12 cos (3πt) appear if
sampled at (a) f
s
= 6 Hz, (b) f
s
= 2.75 Hz, (c) f
s
= 3 Hz, and (d)
f
s
= 1 Hz?
9. Consider the signal z(t) = 3 cos(8πt) + 4 sin(5πt + 0.25). (a) Classify the
signal by its main division plus all subdivisions (for example, nondeter-
ministic/stationary/ergodic). Next, determine (b) the cyclic frequency
of each component, (c) the shortest sample period to avoid amplitude
ambiguity, and (d) the minimum sampling rate to avoid aliasing. Finally,
determine, if any, (e) the aliased frequencies if the signal is sampled at
7 Hz.