Odekon M. Encyclopedia of paleoclimatology and ancient environments
Подождите немного. Документ загружается.


Ulrich C. Müller
Institute of Geology and Paleontology
Johann Wolfgang Goethe University-Frankfurt
Senckenberganlage 32–34
60054 Frankfurt
Germany
ulrich.mueller@em.uni-frankfurt.de
David J. Nash
School of Environment and Technology
University of Brighton
Lewes Road
Brighton BN2 4GJ
UK
d.j.nash@bton.ac.uk
Sandra G. Neuzil
U.S. Geological Survey
12201 Sunrise Valley Dr., MS 956
Reston VA 20192
USA
sneuzil@usgs.gov
Anthony Newton
Institute of Geography, School of Geosciences
University of Edinburgh
Drummond Street
Edinburgh Scotland EH8 9XP
UK
ajd@geo.ed.ac.uk
anthony.newton@ed.ac.uk
Daniela Nitoiu
Institute of Geodynamics of the Romanian Academy
19–21 Jean-Louis Calderon St.
020032 Bucharest–37
Romania
nitoiu@geodin.ro
Robert Oglesby
Department of Geosciences
University of Nebraska Lincoln
214 Bessey Hall
PO Box 880340
Lincoln NE 68588–0340
USA
roglesby2@unl.edu
Antti Ojala
Geological Survey of Finland
P.O. Box 96
2150 Espoo
Finland
antti.ojala@gtk.fi
Paul E. Olsen
Lamont-Doherty Earth Observatory
61 Route 9W
Palisades NY 10964
USA
polsen@ldeo.columbia.edu
Mark Pagani
Department of Geology and Geophysics
Yale University
P.O. Box 208109
New Haven CT 06520–8109
USA
mark.pagani@yale.edu
Didier Paillard
Laboratoire des Sciences du Climat et de l'Environnement
CEA-CNRS
Centre d'Etudes de Saclay
Orme des Merisiers
91191 Gif-sur-Yvette
France
didier.paillard@cea.fr
Martin R. Palmer
Southampton Oceanography Centre
University of Southampton
European Way
Southampton SO14 32H
UK
pmrp@soc.soton.ac.uk
Frédéric Parrenin
Laboratoirede Glaciologie et de Géophysique de l'Environnement
CNRS BP 96
38402 Grenoble, St. Martin d'Hères Cedex
France
parrenin@lgge.obs.ujf-grenoble.fr
Adina Paytan
Institute of Marine Sciences
Earth & Marine Sciences Build.
University of California Santa Cruz
1156 High St.
Santa Cruz CA 95064
USA
apaytan@ucsc.edu
William H. Peck
Department of Geology
Colgate University
13 Oak Dr.
Hamilton NY 13346
USA
wpeck@mail.colgate.edu
Stephen F. Pekar
Queens College
School of Earth and Environmental Sciences
65–30 Kissena Blvd.
Flushing, NY 11367
USA
stephen.pekar@qc.cuny.edu
Dorothy M. Peteet
NASA Goddard Institute for Space Studies
Columbia University
2880 Broadway
New York NY 10025
USA
dpeteet@giss.nasa.gov
peteet@ldeo.columbia.edu
xx CONTRIBUTORS

Elisabetta Pierazzo
Planetary Science Institute
1700 E. Ft. Lowell, Suite 106
Tucson AZ 85719
USA
betty@psi.edu
Christopher J. Poulsen
Department of Geological Sciences
University of Michigan
1100 North University Ave.
Ann Arbor MI 48109
USA
poulsen@umich.edu
Gregory D. Price
Department of Geology
University of Plymouth
Drake Circus
Plymouth PL4 8AA
UK
g.price@plymouth.ac.uk
Donald R. Prothero
Department of Geology
Occidental College
1600 Campus Road
Los Angeles CA 90041
USA
prothero@oxy.edu
Michael Rampino
Earth and Environmental Science Program
New York University
1009 Silver Center
100 Washington Square East
New York NY 10003–6688
USA
mmr1@nyu.edu
Anne Raymond
Department of Geology and Geophysics
Texas A and M University
College Station TX 77843–3115
USA
raymond@geo.tamu.edu
Dominique Raynaud
Laboratoire de Glaciologie et de Géophysique
de l'Environnement CNRS BP 96
38402 Grenoble, St. Martin d'Hères Cedex
France
raynaud@lgge.obs.ujf-grenoble.fr
David K. Rea
1232 Regency Court
Las Cruces NM 88007
USA
davidrea@umich.edu
Mel A. Reasoner
(no address)
Gregory J. Retallack
Department of Geological Sciences
University of Oregon
1260 Franklin Boulevard
Eugene OR 97403–1272
USA
gregr@uoregon.edu
JoAnne Reuss
IODP Interim Planning Committee, Department of Geological
Sciences
University of Michigan
425 E. University Ave.
Ann Arbor MI 48109–1063
USA
jor@umich.edu
Thomas H. Rich
Curator of Vertebrate Paleontology
Museum Victoria
P.O. Box 666
Melbourne Victoria 3001
Australia
trich@museum.vic.gov.au
David H. Rind
NASA Goddard Institute for Space Studies
2880 Broadway
New York NY 10025
USA
david.h.rind@nasa.gov
Neil Roberts
School of Geography
University of Plymouth
Drake Circus
Plymouth PL4 8AA
UK
c.n.roberts@plymouth.ac.uk
Alastair Ruffell
School of Geosciences, School of Geography, Archaeology and
Palaeoecology
Queens University
Belfast Northern Ireland BT7 1NN
UK
a.ruffell@qub.ac.uk
Matti Saarnisto
Suomalainen Tiedeakatemia
Finnish Academy of Science and Letters
Pääsihteeri, Secretary General
Mariankatu 5
00170 Helsinki
Finland
matti.saarnisto@acadsci.fi
CONTRIBUTORS xxi

Julian Sachs
School of Oceanography & The Program on Climate Change
University of Washington
Ocean Sciences Building, Room 521
Box 355351
Seattle WA 98195–5351
USA
jsachs@u.washington.edu
Peter Sadler
Department of Earth Sciences
University of California
Riverside CA 92521
USA
peter.sadler@ucr.edu
Oleg A. Saenko
Canadian Centre for Climate Modelling and Analysis
University of Victoria
P.O. Box 3055
Victoria BC V8W 3P6
Canada
oleg.saenko@ec.gc.ca
Bradley Sageman
Earth and Planetary Sciences
Northwestern University
1850 Campus Drive
Evanston IL 60208
USA
brad@earth.northwestern.edu
Andrew D. Saunders
Department of Geology
University of Leicester
Leicester LE1 7RH
UK
ads@le.ac.uk
Gavin A. Schmidt
NASA Goddard Institute for Space Studies
2880 Broadway
New York NY 10025
USA
gschmidt@giss.nasa.gov
Christopher R. Scotese
Department of Geology
University of Texas
Arlington TX 76012
USA
cscotese@uta.edu
Dan Seidov
NOAA NODC/Ocean Climate Laboratory
SSMC-III, E/OC5, Room 4326
1315 East-West Highway
Silver Spring, MD 20910
USA
dan.seidov@noaa.gov
Nathan D. Sheldon
Department of Geology
Royal Holloway University of London
Egham, Surrey TW20 0EX
UK
n.sheldon@gl.rhul.ac.uk
Drew T. Shindell
NASA Goddard Institute for Space Studies
2880 Broadway
New York NY 10025
USA
drew.t.shindell@nasa.gov
Martin J. Siegert
School of Geosciences, Grant Institute
University of Edinburgh
West Mains Road
Edinburgh EH9 3JW
UK
m.j.siegert@ed.ac.uk
Bruce M. Simonson
Geology Department
Oberlin College
52 West Lorain Street
Oberlin OH 44074–1052
USA
bruce.simonson@oberlin.edu
Joseph P. Smoot
U.S. Geological Survey
12201 Sunrise Valley Drive MS 926A
Reston VA 20192
USA
jpsmoot@usgs.gov
Robert A. Spicer
Department of Earth Sciences
The Open University
Walton Hall
Milton Keynes MK7 6AA
UK
r.a.spicer@open.ac.uk
Bernhard Stauffer
Climate and Environmental Physics Department,
Physics Institute
University of Bern
Sidlerstrasse 5
3012 Bern
Switzerland
stauffer@climate.unibe.ch
Richard Stothers
NASA Goddard Institute for Space Studies
2880 Broadway
New York NY 10025
USA
rstothers@giss.nasa.gov
xxii CONTRIBUTORS

Harald Strauss
Geologisch-Paläontologisches Institut und Museum
Westfälischen Wilhelms-Universität Münster
Corrensstraße 24
48149 Münster
Germany
hstrauss@uni-muenster.de
Ian P. Swainson
Canadian Neutron Beam Centre
Steacie Institute for Molecular Sciences
National Research Council of Canada
Chalk River Laboratories
Chalk River ON K0J 1J0
Canada
ian.swainson@nrc.gc.ca
Manik Talwani
IODP-MI, Inc.
#210, 815 Connecticut Av., NW
Washington DC 20006
USA
mtalwani@iodp.org
Kendrick Taylor
Desert Research Institute
2215 Raggio Parkway
Reno NV 89512
USA
kendrick@dri.edu
R. Ervin Taylor
Radiocarbon Laboratory, Department of Anthropology
University of California at Riverside
Watkins Hall 1303 A
Riverside CA 92521–0423
USA
ervin.taylor@ucr.edu
retaylor@ucr.edu
Ina Tegen
Institute for Tropospheric Research
Permoserstrasse 15
04318 Leipzig
Germany
itegen@tropos.de
Lonnie G. Thompson
Department of Geological Sciences, School of Earth Sciences
Ohio State University
275 Mendenhall Laboratory, 125 S. Oval Mall
Columbus OH 43210–1002
USA
thompson.3@osu.edu
David J. Thomson
Mathematics and Statistics
Queen's University
411 Jeffery Hall
Kingston ON K7L 3N6
Canada
djt@mast.queensu.ca
Willy Tinner
Institute of Plant Sciences and Oeschger Centre for Climate
Change Research (OCCR)
University of Bern
Altenbergrain 21
3013 Bern
Switzerland
willy.tinner@ips.unibe.ch
Garland R. Upchurch, Jr.
Department of Biology
Texas State University
601 University Drive
San Marcos TX 78666
USA
gu01@txstate.edu
John W. Valley
Department of Geology and Geophysics
University of Wisconsin
1215 W Dayton St.
Madison WI 53706
USA
valley@geology.wisc.edu
Brigitte Van Vliet-Lanoë
UMR 6538 CNRS, Domaines Océaniques
IUEM
29280 Plouzané
France
brigitte.vanvlietlanoe@univ-brest.fr
Ján Veizer
Department of Earth Sciences
University of Ottawa
Ottawa ON K1N 6N5
Canada
jveizer@uottawa.ca
Andrei A. Velichko
Laboratory of Evolutionary Geography
Russian Academy of Sciences
Staromonetny 29
119017 Moscow
Russia
Paleo_igras@mail.ru
John E. N. Veron
Australian Institute of Marine Science
PMB 3
Townsville Queensland 4810
Australia
jveron@aims.gov.au
or
Coral Reef Research
10 Benalla Road
Oak Valley
Townsville Queensland 4811
Australia
j.veron@coralreefresearch.com
CONTRIBUTORS xxiii

Patricia Vickers-Rich
School of Geosciences
Monash University
Clayton Victoria 3800
Australia
pat.rich@sci.monash.edu.au
Pinxian Wang
School of Ocean and Earth Sciences
Tongji University
Siping Rd. 1239
Shanghai 200092
China
pxwang@online.sh.cn
Andrew J. Weaver
School of Earth and Ocean Sciences
University of Victoria
P.O. Box 3055
Victoria BC V8W 3P6
Canada
weaver@uvic.ca
Thompson Webb III
Department of Geological Sciences
Brown University
324 Brook Street, Box 1846
Providence RI 2912
USA
Thompson_Webb_III@brown.edu
Gerold Wefer
General Geology – Marine Geology
University of Bremen
Marum, Leobener Straße
28359 Bremen
Germany
gwefer@rcom-bremen.de
Mara Weinelt
Institut für Geowissenschaften
University of Kiel
Ludwig Meyn Strasse 14
24118 Kiel
Germany
mw@gpi.uni-kiel.de
Jessica H. Whiteside
Geological Sciences
Brown University
324 Brook Street
Box 1846
Providence RI 02912
USA
Jessica_Whiteside@brown.edu
Michael Widdowson
Department of Earth and Environmental Sciences
The Open University
Walton Hall
Milton Keynes MK7 6AA
UK
m.widdowson@open.ac.uk
John W. Williams
Department of Geography
University of Wisconsin-Madison
Rooms 421 or 213 Science Hall
550 North Park St.
Madison WI 53706–1404
USA
jww@geography.wisc.edu
Dieter A. Wolf-Gladrow
Alfred Wegener Institut für Polar und Meeresforschung (AWI)
Am Handelshafen 12
27570 Bremerhaven
Germany
Dieter.Wolf-Gladrow@awi.de
James D. Wright
Department of Geological Sciences
Rutgers University, Wright-Reiman Labs
610 Taylor Rd.
Piscataway NJ 08854–8066
USA
jdwright@rci.rutgers.edu
Grant M. Young
Department of Earth Sciences
University of Western Ontario
London ON N6A 5B7
Canada
rokchip@rogers.com
Jeremy R. Young
Palaeontology Department
The Natural History Museum
Cromwell Road
London SW7 5BD
UK
j.young@nhm.ac.uk
Richard E. Zeebe
School of Ocean and Earth Science and Technology
Department of Oceanography
University of Hawaii, Manoa
1000 Pope Road MSB 504
Honolulu HI 96822
USA
zeebe@soest.hawaii.edu
Bernd Zolitschka
GEOPOLAR, Institute of Geography
University of Bremen
Celciusstrasse FVG-M
28359 Bremen
Germany
zoli@uni-bremen.de
xxiv CONTRIBUTORS
Preface
The growing levels of atmospheric greenhouse gases generated
by anthropogenic activities are already beginning to affect the
Earth's climate, according to the latest report by the Intergovern-
mental Panel on Climate Change, and concern is mounting over
potential adverse consequences to society. However, Earth's cli-
mate has shifted dramatically and frequently during the last few
million years, alternating between ice ages, when vast glaciers
covered Northern Europe and much of North America, and
interglacials—warm periods much like today. Farther back in
geologic time, climates have differed even more from the pre-
sent. Could human actions push the Earth's climate system into
an unstable mode, beyond the relatively mild oscillations of the
last few millennia? To fully understand the unusual changes of
the 20th century and possible future trends, these need to be
placed in a longer-term context extending well beyond the period
of instrumental records. Paleoclimatology—the study of climates
of the past–may provide us with insights into the workings of the
modern climate system. By reconstructing ancient climates using
natural “archives” of environmental change recorded in trees, cor-
als,cave deposits, ice cores, lakeandocean sediments, and running
computer models, paleoclimatologists can place bounds on past
climate variability and help us anticipate possible future changes.
The Encyclopedia of Paleoclimatology and Ancient Envi-
ronments, a companion volume to the recently-published
Encyclopedia of World Climatology, provides the reader with
an entry point to the rapidly expanding field of paleoclimatol-
ogy. Highly interdisciplinary, paleoclimatology integrates infor-
mation from a broad array of disciplines in the geosciences,
spanning across stratigraphy, geomorphology, glaciology, paleoe-
cology, paleobotany, isotope geochemistry, geochronology, and
geophysics, among others. The encyclopedia covers the entire
span of the Earth's climate history from the early Precambrian
to the Little Ice Age, and also offers an interplanetary compari-
son with the contrasting climates of Mars and Venus in 230 infor-
mative articles written by over 200 well known international
experts. The climates of the past were the product of closely
inter-connected processes that shaped the Earth's atmosphere,
lithosphere, and biosphere. Therefore, the separation between
topics is somewhat arbitrary and a certain degree of overlap
is inevitable. However, since authors often approach similar
topics from differing perspectives, these differences can provide
a fuller picture overall. The volume is abundantly illustrated with
line-drawings, black-white and color photographs. Articles are
arranged alphabetically, with extensive bibliographies and cross-
references.
March 2008
Vivien Gornitz
Acknowledgements
This volume is offered in tribute to the memory of Rhodes W.
Fairbridge, Senior Editor of the Encyclopedia of Earth Sciences
Series, who sadly passed away before this encyclopedia could
be completed. It was upon his recommendation and inspiration
that this project was undertaken. Rhodes Fairbridge took a keen
interest in paleoclimatology, which ties together many aspects
of the geosciences. He wrote several articles especially for this
encyclopedia, including a detailed history of paleoclimatology
and “Earth Laws and Paleoclimatology”, which summarizes
many of the ideas he had covered in his long and distinguished
career. He was way ahead of his time in his early acceptance of
Wegener's theory of continental drift, the role of orbital cycles
in climate change (i.e., the Milankovitch theory), solar influences
on climate, and recognition of general aridity during glacial per-
iods. He was among the first to report the twentieth century rise in
global sea level in the 1960s. One of the recurrent themes in
Rhodes’ many publications is the role of cyclical phenomena
on all timescales. A 1961 symposium that he organized at
Columbia University was among the earliest to explore the
connections between Earth cycles and paleoclimates. With his
colleagues, he investigated planetary alignments, their possible
effects on solar activity, and ultimately on Earth's paleoclimates.
While still controversial, a growing body of literature points to
some solar influence on climate and one of the articles in this
volume addresses this particular issue. His ability to see beyond
the minutiae of narrow specialties combined with an amazing
memory served him well as senior series editor. He will be sorely
missed and fondly remembered.
I thank the contributing authors for their efforts in bringing
this Encyclopedia to fruition. Thanks are also extended to the
members of the Editorial Advisory Board for their helpful sug-
gestions and recommendations. Appreciation is also expressed
to Ms. Eden Licardo, for her secretarial assistance, to Mr. José
Mendoza for graphics support, and to Dr. Cynthia Rosenzweig,
Head, Center for Climate Systems Research, Columbia Univer-
sity and NASA Goddard Institute for Space Studies, New York,
for her encouragement and understanding during this lengthy
undertaking.
Vivien Gornitz

A
AEROSOL (MINERAL)
General
Wind-blown mineral aerosol consists of micrometer-sized air-
borne soil dust particles. Estimates of modern global dust emis-
sions range from 1,000 to 3,000 Mt yr
–1
(Houghton et al.,
2001). Dust aerosol has a high spatial and temporal variability;
large uncertainties exist in quantitative estimates of large-scale
dust loads. Modern global dust distribution and properties can
be characterized by satellite retrievals and concentration mea-
surements at surface stations. Dust deposition data from ice
cores, marine sediments, and terrestrial sites provide informa-
tion on dust in modern and past climate periods (Kohfeld and
Harrison, 2001). Such records show that dustiness was
increased 2- to 20-fold during glacial periods compared with
interglacials, as a consequence of increased aridity, reduced
vegetation, increased availability of fine, loose sediment, and
more vigorous surface wind speeds in glacial climates.
Dust sources
Mineral aerosol is generated in arid and semi-arid continental
regions. Major dust sources include the Saharan/Sahelian
region, the Arabian Peninsula, the Gobi and Taklamakan
Deserts in Asia, and the Australian Desert (Duce, 1995). Dust
emission occurs when the surface wind stress exceeds a
threshold value, which is a function of surface properties like
roughness elements, grain size, and soil moisture. Theoretical
considerations and wind tunnel experiments show a depen-
dence of dust emissions on the surface wind stress to the third
or fourth power (Gillette and Passi, 1988; Shao et al., 1993).
Fine soil particles that can be transported over large distances
are released when larger wind-blown sand impacts on the soil,
mobilizing smaller particles (saltation). Dust emissions occur
preferentially in areas that contain fine, loose sediment.
Prospero et al. (2002) find a good agreement of satellite-
observed dust emission maxima with the location of topographic
depressions, where fine sediment can accumulate. Rough sur-
faces containing structural elements like rocks or vegetation
increase the threshold velocity required for dust emission
(Marticorena and Bergametti, 1995) since wind energy is partly
absorbed by the obstacles. Crusting of soil surfaces can reduce
the possible dust release from a source region. Dust deflation
can decrease over time due to loss of available fine soil material.
Surface disturbance and disruption of the vegetation cover
can lead to increased dust emissions, for example during the
“dust bowl” events in the United States in the 1930s and 1950s
following cultivation of the soils in dry regions.
Dust cycle
Dust injected into upper levels of the atmosphere can be trans-
ported over thousands of kilometers by strong wind systems.
Most prominently, Saharan dust is transported across the North
Atlantic to North and Central America, and is found as far
downwind as the Amazon Basin. Dust from Asia is transported
over the North Pacific towards mid-Pacific islands and North
America.
Dust is removed from the atmosphere by precipitation
(wet deposition) or through gravitational settling and turbulent
mixing at the surface (dry deposition). Close to the source
regions, gravitational sedimentation is responsible for most
dust deposition, while wet deposition determines the removal
rate of far-traveled dust particles over remote ocean areas.
Unless removed by precipitation, the length of time that dust
aerosols remain in the atmosphere depends on the deposition
velocities of the different particle sizes. Atmospheric lifetimes
of dust range from a few hours for particles larger than 10 µm
to 10–15 days for submicron particles (Ginoux et al., 2001).
Properties
The particle size of mineral aerosols determines their atmo-
spheric lifetime and thus the distance that the particles can travel.
Close to source regions the median dust particle radii are around
30–50 µm. Dust that has been transported away from the
sources has a median radius around 1 µm (e.g., Duce, 1995).
The mineral composition o f dust particles reflects the
mineralogy of the rocks at the Earth’s surface; some main con-
stituents are quartz, feldspars, carbonates and clays. Dust parti-
cles from different source regions have specific mineralogical

compositions and as a consequence, different refractive indices
determining their optical properties. For example, Saharan dust
is richer in iron and therefore darker and redder than Asian
dust. Refractive indices for different minerals span a wide
range for solar and thermal wavelengths (Sokolik and Toon,
1999). Data on dust refractive indices are currently limited to
only a few regions.
Dust effects on climate
Dust can influence the climate in several ways. Aerosols signif-
icantly impact on the climate system by changing the energy
balance of solar and thermal radiation (Houghton et al.,
2001). Dust not only scatters but also partly absorbs incoming
solar radiation, and also absorbs and emits outgoing long-wave
radiation. Any changes in atmospheric dust loads, like the
increase in dust during glacial periods, would cause a change
in the radiation balance and consequentially, in surface tem-
peratures. The magnitude and even the sign of the direct radia-
tive dust forcing is uncertain; it depends on the optical
properties of the dust, cloud cover, and the albedo of the under-
lying surface (Liao and Seinfeld, 1998).
The presence of dust may alter cloud optical properties by
changing the number of cloud condensation nuclei. The effi-
ciency of dust particles in forming nuclei for water clouds may
alter during transport due to mixing with soluble aerosol species.
This can influence both the brightness of clouds and the forma-
tion of rainfall. Dust particles can potentially change chemical
reactions in the atmosphere because of their large surface areas,
and therefore have a significant impact on the ozone and nitro-
gen cycles. Micronutrients (e.g., Fe) deposited with dust aerosol
possibly impact the productivity of marine and terrestrial ecosys-
tems, thus influencing the carbon cycle and potentially changing
the atmospheric greenhouse gas content. The impacts of these
indirect dust effects on climate are uncertain, since the underly-
ing processes are not yet fully understood.
Ina Tegen
Bibliography
Duce, R.A., 1995. Sources, distributions, and fluxes of mineral aerosols and
their relationship to climate. In Charlson, R.J., and Heintzenberg, J.
(eds.), Aerosol Forcing of Climate: Report of the Dahlem Workshop on
Aerosol Forcing of Climate, Berlin 1994, April 24–29, Chichester:
Wiley. pp. 43–72.
Gillette, D.A., and Passi, R., 1988. Modeling dust emission caused by wind
erosion. J. Geophys. Res., 93, 14,233–14,242.
Ginoux, P., Chin, M., Tegen, I., Prospero, J.M., Holben, B., Dubovik, O.,
and Lin, S.-J., 2001. Sources and distributions of dust aerosols simu-
lated with the GOCART model. J. Geophys. Res., 106, 20255–20273.
Houghton, J.T., Ding, Y., Griggs, D.J., Noguer, M., van der Linden, P.J.,
Dai, X., Maskell, K., and Johnon, C.A. (eds.), 2001. Climate Change.
New York, NY: Cambridge University Press.
Kohfeld, K.E., and Harrison, S.P., 2001. DIRTMAP: The geological record
of dust. Earth-Sci. Rev., 54,81–114.
Liao, H., and Seinfeld, J.H., 1998. Radiative forcing by mineral dust aero-
sols: Sensitivity to key variables. J. Geophys. Res., 103, 31637–31645.
Marticorena, B., and Bergametti, G., 1995. Modeling the atmospheric dust
cycle 1. Design of a soil-derived dust emission scheme. J. Geophys.
Res., 100, 16415–16430.
Prospero, J.M., Ginoux, P., and Torres, O., 2002. Environmental character-
ization of global sources of atmospheric soil dust identified with the
NIMBUS-7 TOMS absorbing aerosol product. Rev. Geophys.
doi:10.1029/ 2000RG000095.
Shao, Y., Raupach, M.R., and Findlater, P.A., 1993. Effect of saltation
bombardment on the entrainment of dust by wind. J. Geophys. Res.,
98, 12,719–12,726.
Sokolik, I.N., and Toon, O.B., 1999. Incorporation of mineralogical com-
position into models of the radiative properties of mineral aerosol from
UV to IR wavelengths. J. Geophys. Res., 104, 9423–9444.
Cross-references
Climate Forcing
Dust Transport, Quaternary
Eolian Dust, Marine Sediments
Eolian Sediments and Processes
Iron and Climate Change
ALBEDO FEEDBACKS
Technically, the term albedo refers to the reflecting power of a
body, or a surface area, and is the fraction of light reflected by
the body relative to the total light that is incident on the body,
or surface. Thus, a perfect absorber has an albedo of zero while
a perfect reflector has an albedo of unity. In general, the albedo
of a given surface is a function of wavelength. It is also depen-
dent on the angle at which the incident light strikes the reflect-
ing surface. This leads to more specialized terminology such
as “spectral albedo” and “plane albedo,” which refer to the
wavelength and solar zenith angle dependence of the reflected
radiation, respectively. Reflected radiation that has been aver-
aged over all possible angles of incidence is called “spherical
albedo.” It is also referred to as the Bond albedo, which is
the ratio of the total light reflected by a spherical body, such
as a planet, to the total radiation that is incident on the planet.
In the context of terrestrial climate where interest is primar-
ily directed toward describing the radiative energy balance of
the Earth, there is an implicit assumption that the spectral
albedo has been integrated over all wavelengths. The albedo
of the Earth is then directly related to the solar energy that is
available to drive atmospheric dynamics and for maintaining
the temperature of the Earth-atmosphere system. It is also useful
to differentiate between “surface albedo,” which is the reflectiv-
ity of the bare ground and ocean surface without including atmo-
spheric scattering effects, and “planetary albedo,” which includes
all atmospheric and surface scattering contributions and refers to
the outgoing solar radiation at the top of the atmosphere that is
reflected back to space.
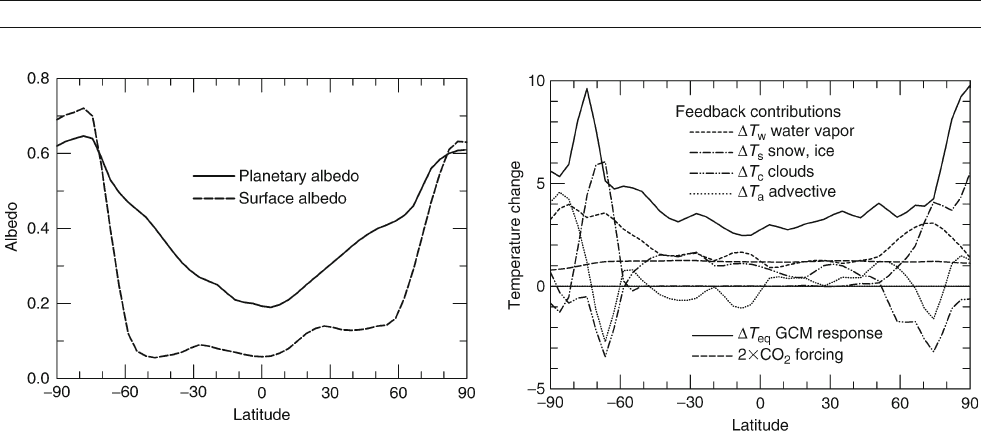
Figure A1 shows the zonally averaged annual mean surface
albedo (dashed line) and planetary albedo (solid line) of the Earth
as computed with a general circulation climate model. Character-
istically, the ocean and land are areas of low reflectivity with typ-
ical albedos in the 6–12% range. Substantially higher surface
albedos due to snow and ice are evident in the polar regions
where the albedo of fresh snow may exceed 90%. Globally aver-
aged, the surface albedo of the Earth is about 12%. The planetary
albedo is generally larger than the surface albedo due primarily to
the high reflectivity of clouds. As in the case of fresh snow, the
albedo of optically thick clouds can sometimes exceed 90%.
However, because of absorption by atmospheric gases and multi-
ple scattering effects between the atmosphere and ground sur-
face, the planetary albedo in the polar regions is frequently
lower than that of the highly reflecting snow surface. Globally
averaged, the planetary albedo of the Earth, also called the global
albedo, is approximately 30%. Thus, about 70% of the solar
2 ALBEDO FEEDBACKS
radiation that falls on the Earth is absorbed by the Earth-atmo-
sphere system, with most of the solar energy being absorbed at
low latitudes and relatively little within the polar regions. This
serves to establish the characteristic equator-to-pole temperature
gradient and the corresponding atmospheric and oceanic circula-
tion patterns that work to redistribute the absorbed solar energy
more evenly.
Despite the high surface albedo at high latitudes, the atmo-
spheric contribution to the global albedo exceeds that of the
ground surface by about a factor of 2.5, with clouds being
the single largest contributor. Smaller contributions to the global
albedo are made by atmospheric aerosols and by Rayleigh scat-
tering due to air molecules. Rayleigh scattering, which accounts
for about 5% to the global albedo, is essentially a constant offset
factor in climate considerations since it is not significantly
affected by changes in atmospheric conditions. Snow, ice, and
clouds on the other hand have specific temperature and humidity
thresholds at which they form and dissipate. The large albedo
contrast that occurs when snow, ice, and cloud amounts change
strongly affects the amount of solar radiation that is absorbed
by the Earth-atmosphere system. This in turn affects the atmo-
spheric temperature distribution, leading to mutual interactions
between regions of snow, ice, and cloud fields and the local sur-
face and atmospheric temperature distributions. These physical
interactions comprise the basic climate “feedback” effects
whereby a given change in temperature directly or indirectly
induces a change in snow, ice or cloud amount, which in turn
affects the amount of solar energy that is absorbed, thus magnify-
ing the original temperature perturbation.
Albedo feedbacks associated with changes in snow and ice
cover are generally positive. This is because for an initial
increase in temperature, ▵T
o
, due to whatever cause, the
expected result is the melting of a certain amount of snow
and ice with a corresponding decrease in local albedo, which
leads to increased absorption of solar energy and a subsequent
increase in temperature. This results in a geometric series of
temperature increments that converges to some equilibrium
temperature that is ▵T
eq
higher than the initial reference temp-
erature. The ratio, f = ▵T
eq
/▵T
o
, is called the feedback factor
by which the initial forcing is magnified. Accordingly, if f is
greater than unity the feedback is positive, and if f is less than
unity the feedback is negative.
The relative strengths of different climate feedback effects
can be evaluated with the help of a general circulation climate
model (GCM) and its radiative transfer model. The GCM is
assumed to incorporate appropriate mathematical formulations
for all of the necessary physical process to model the climate
system, such as the evaporation, transport, and condensation
of water vapor, precipitation, the freezing and melting of ice,
the diurnal and seasonal changes in solar heating and thermal
cooling, including the appropriate heat capacities for the ocean,
land, and atmosphere. In typical GCM experiments of climate
forcing, the GCM is first run to its reference equilibrium state,
at which point the global distributions of water vapor, surface
albedo, clouds, and temperature are recorded. A radiative per-
turbation, such as doubling the CO
2
amount, is then applied
and the GCM is run to its new equilibrium state whereupon
the changes in the distributions of water vapor, surface albedo,
cloud, and temperature are again recorded and analyzed.
The principal results for a doubled CO
2
experiment are sum-
marized in Figure A2 by the heavy solid line which depicts the
latitudinal dependence of the total annual-mean equilibrium
temperature change, including albedo feedbacks which globally
averaged, yields ▵T
eq
= 3.9
C, and by the heavy dashed line
which represents the applied forcing due to doubled CO
2
alone,
which, globally averaged and expressed as a temperature change,
yields ▵T
o
= 1.2
C(Table A1). The difference between the
externally imposed temperature change DT
o
, and the actual tem-
perature change ▵T
eq
that is realized as the model reaches its
new thermal equilibrium, is the feedback contribution, which
produces both a reduction of the planetary albedo of the Earth,
and an enhancement of its atmospheric greenhouse strength.
Specific information regarding the relative magnitude of
individual feedback contributions can be obtained by inserting
the recorded cloud, water vapor, surface albedo differences
between the perturbed and reference model results into the
GCM one at a time, and by running the model to equilibrium with
all physical process interactions turned off, except for only local
Figure A2 Annually averaged zonal-mean GCM surface temperature
response for doubled CO
2
(heavy solid line) and temperature forcing
due to doubled CO
2
(heavy dashed line). The other curves depict other
feedback contributions as indicated.
Figure A1 Zonally averaged annual mean surface albedo (dashed line)
and planetary albedo (solid line) of the Earth as computed with a
general circulation climate model.
ALBEDO FEEDBACKS 3