NP 100 - Mariners Handbook
Подождите немного. Документ загружается.

CHAPTER 4
100
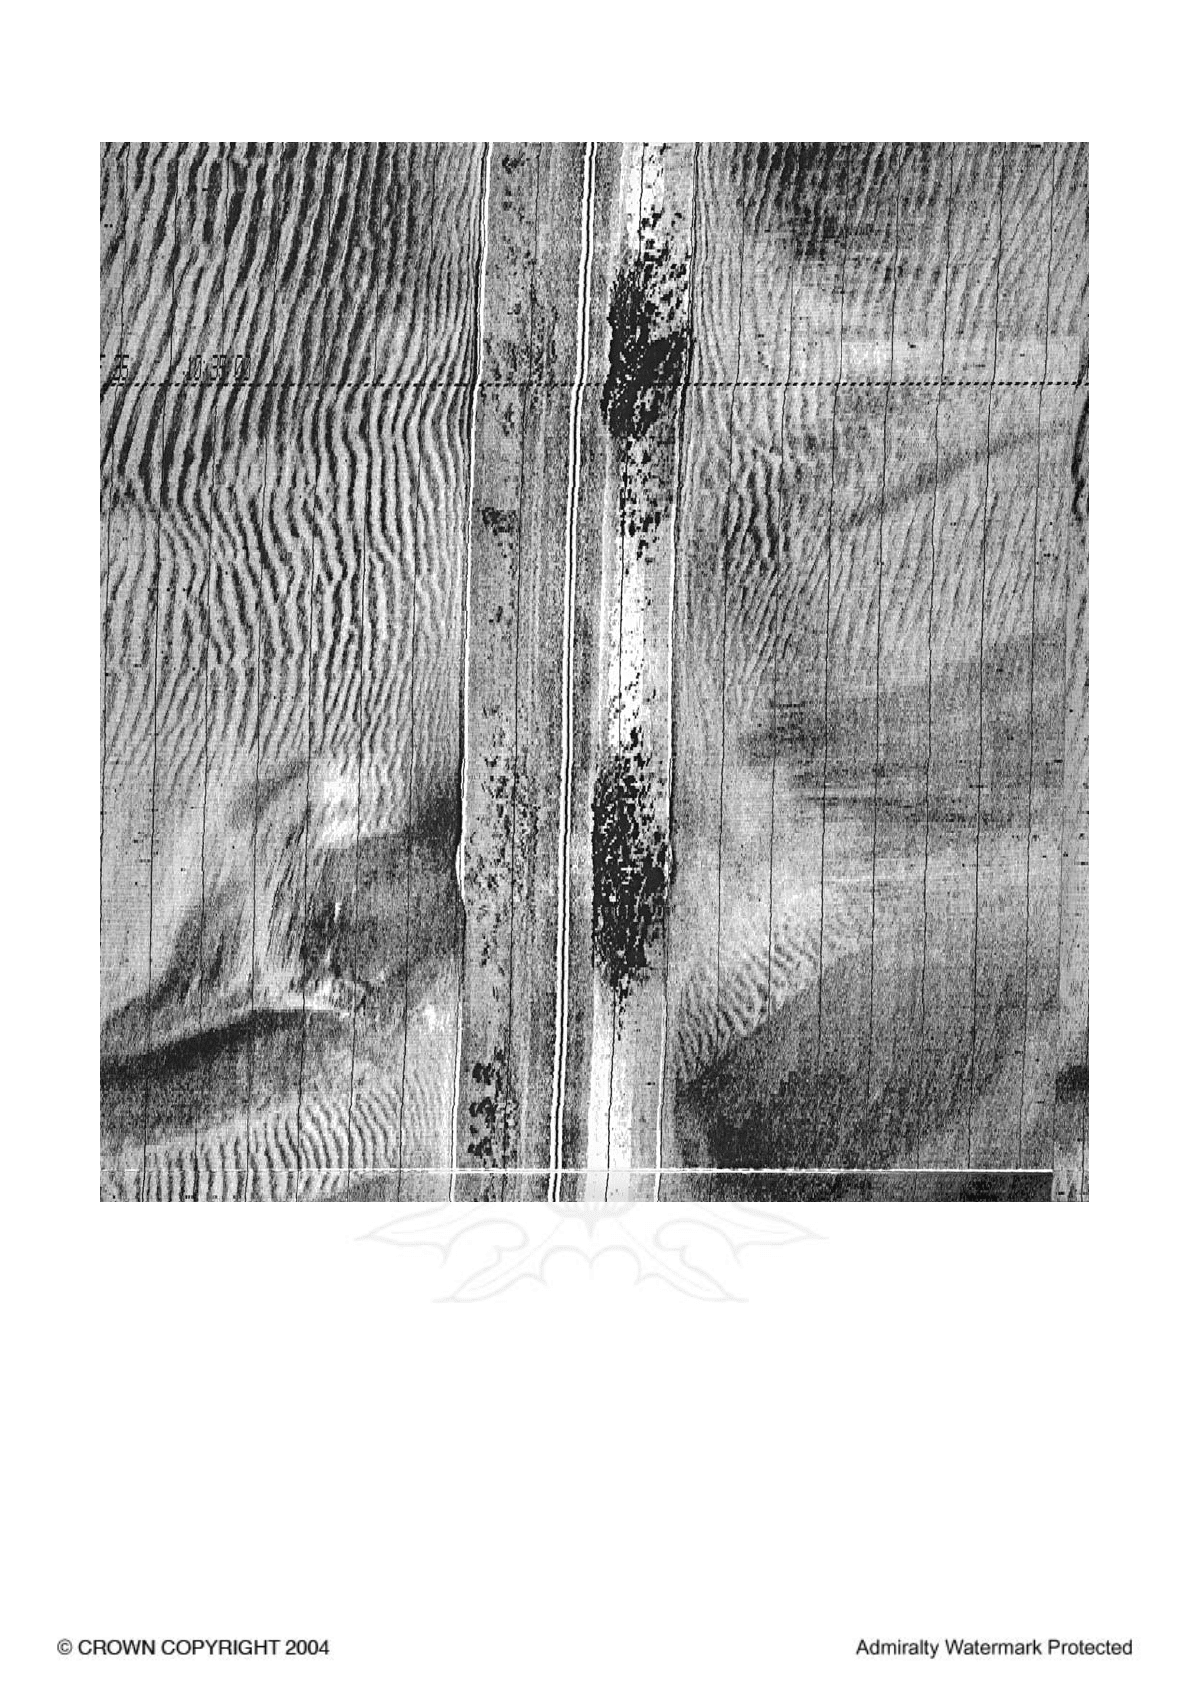
Sandwaves − Sidescan Sonar trace (4.60)
Known details of such areas are given in Admiralty Sailing
Directions.
Since the position of sandwaves and the depth of water
over them are liable to change, ships with little under-keel
clearance should treat the areas in which they are known to
exist with due caution.
LOCAL MAGNETIC ANOMALIES
General information
4.62
1 In various parts of the world, magnetic ores on or just
below the seabed may give rise to local magnetic
anomalies resulting in the temporary deflection of the
magnetic compass needle when a ship passes over them.
The areas of disturbance are usually small unless there are
many anomalies close together. The amount of the
deflection will depend on the depth of water and the
strength of the magnetic force generated by the magnetic
ores. However, the magnetic force will seldom be strong
enough to deflect the compass needle in depths greater than
about 1500 m. Similarly, a ship would have to be within
8 cables of a nearby land mass containing magnetic ores
for a deflection of the needle to occur.
2 Deflections may also be due to wrecks lying on the
bottom in moderate depths, but investigations have proved
Home
Contents
Index
CHAPTER 4
101
that, while deflections of unpredictable amount may be
expected when very close to such wrecks, it is unlikely that
deflections in excess of 7° will be experienced, nor should
the disturbance be felt beyond a distance of 250 m.
Greater deflections may be experienced when in close
quarters with a ship carrying a large cargo such as iron ore,
which readily reacts to induced magnetism.
3 Power cables carrying direct current can cause deflection
of the compass needle. The amount of the deflection
depends on the magnitude of the electric current and the
angle the cable makes with the magnetic meridian. Small
vessels with an auto-pilot dependent upon a magnetic
sensor may experience steering difficulties if crossing such
a cable. See also 5.66 for the effect of magnetic and
ionospheric storms on the compass needle.
Charting and describi ng
4.63
1 Local magnetic anomalies are depicted by a special
symbol on Admiralty charts and are mentioned in Sailing
Directions. The amount and direction of the deflection of
the compass needle is also given, if known.
Home
Contents
Index
CHAPTER 4
102
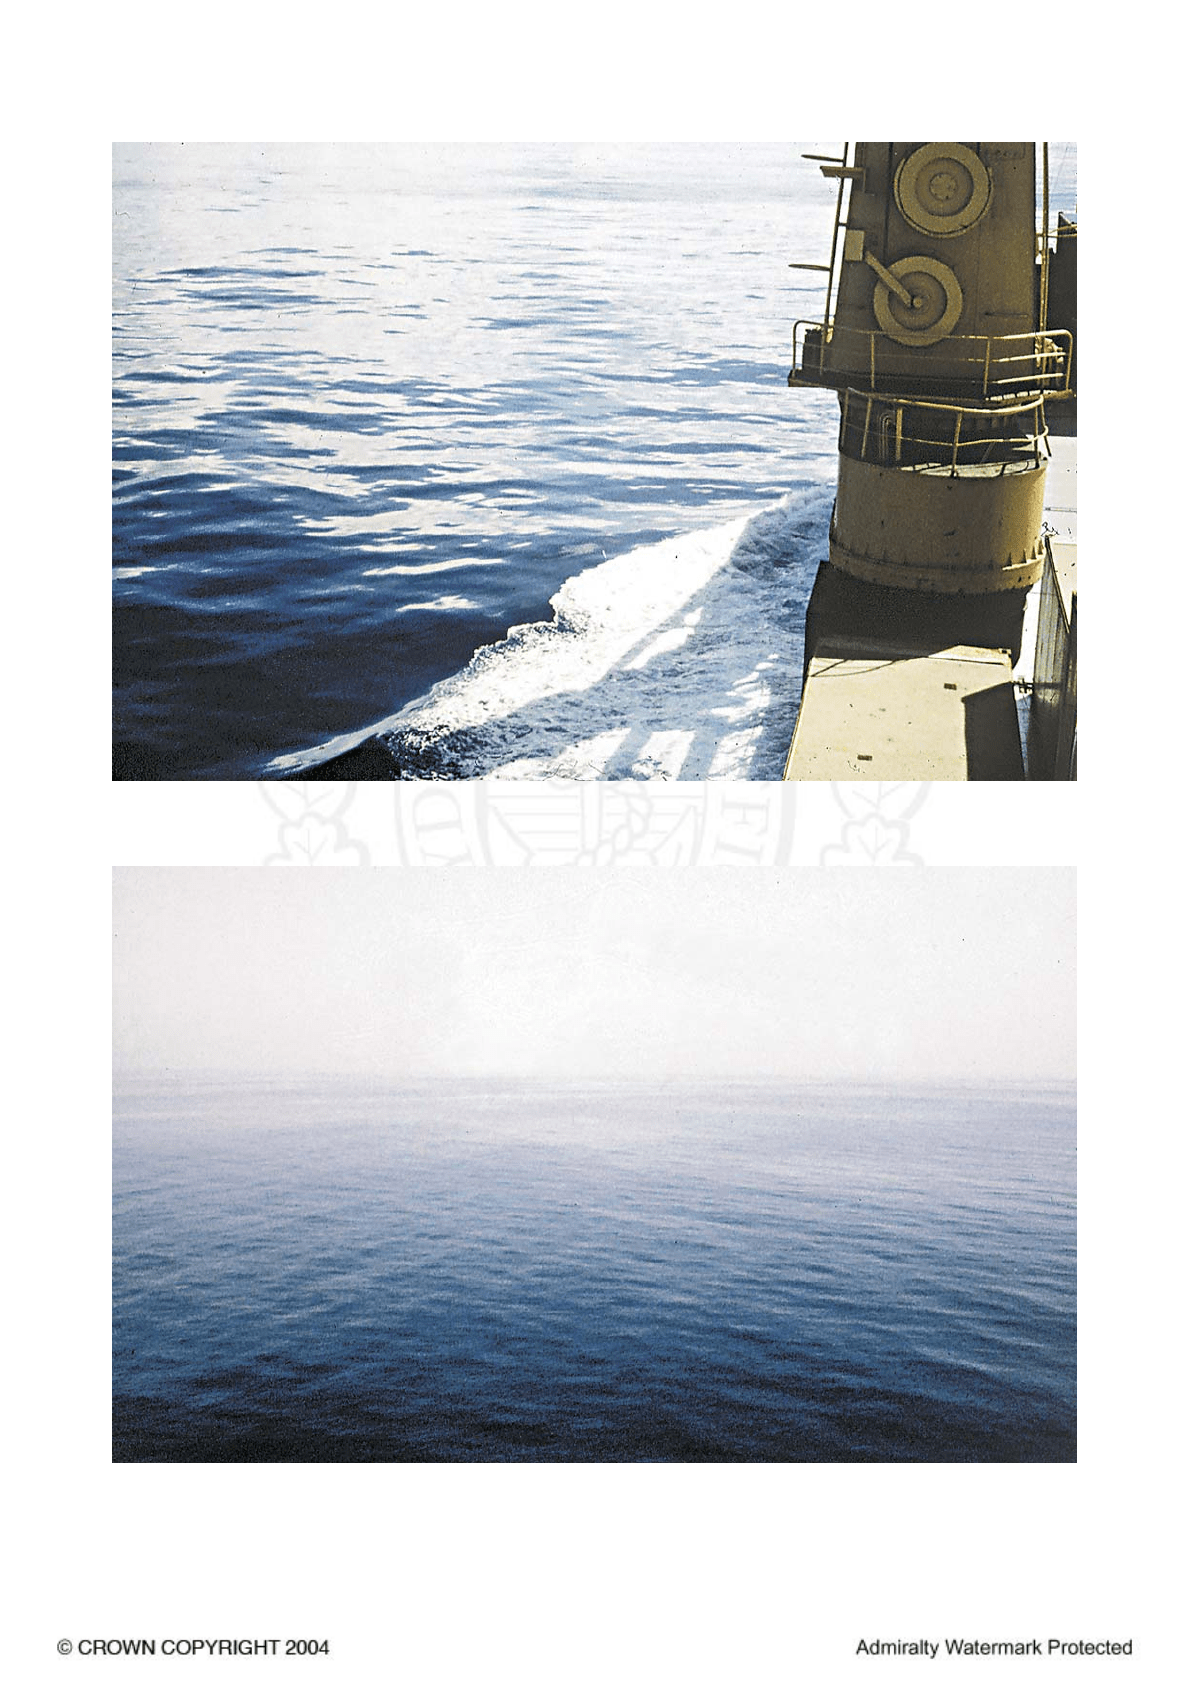
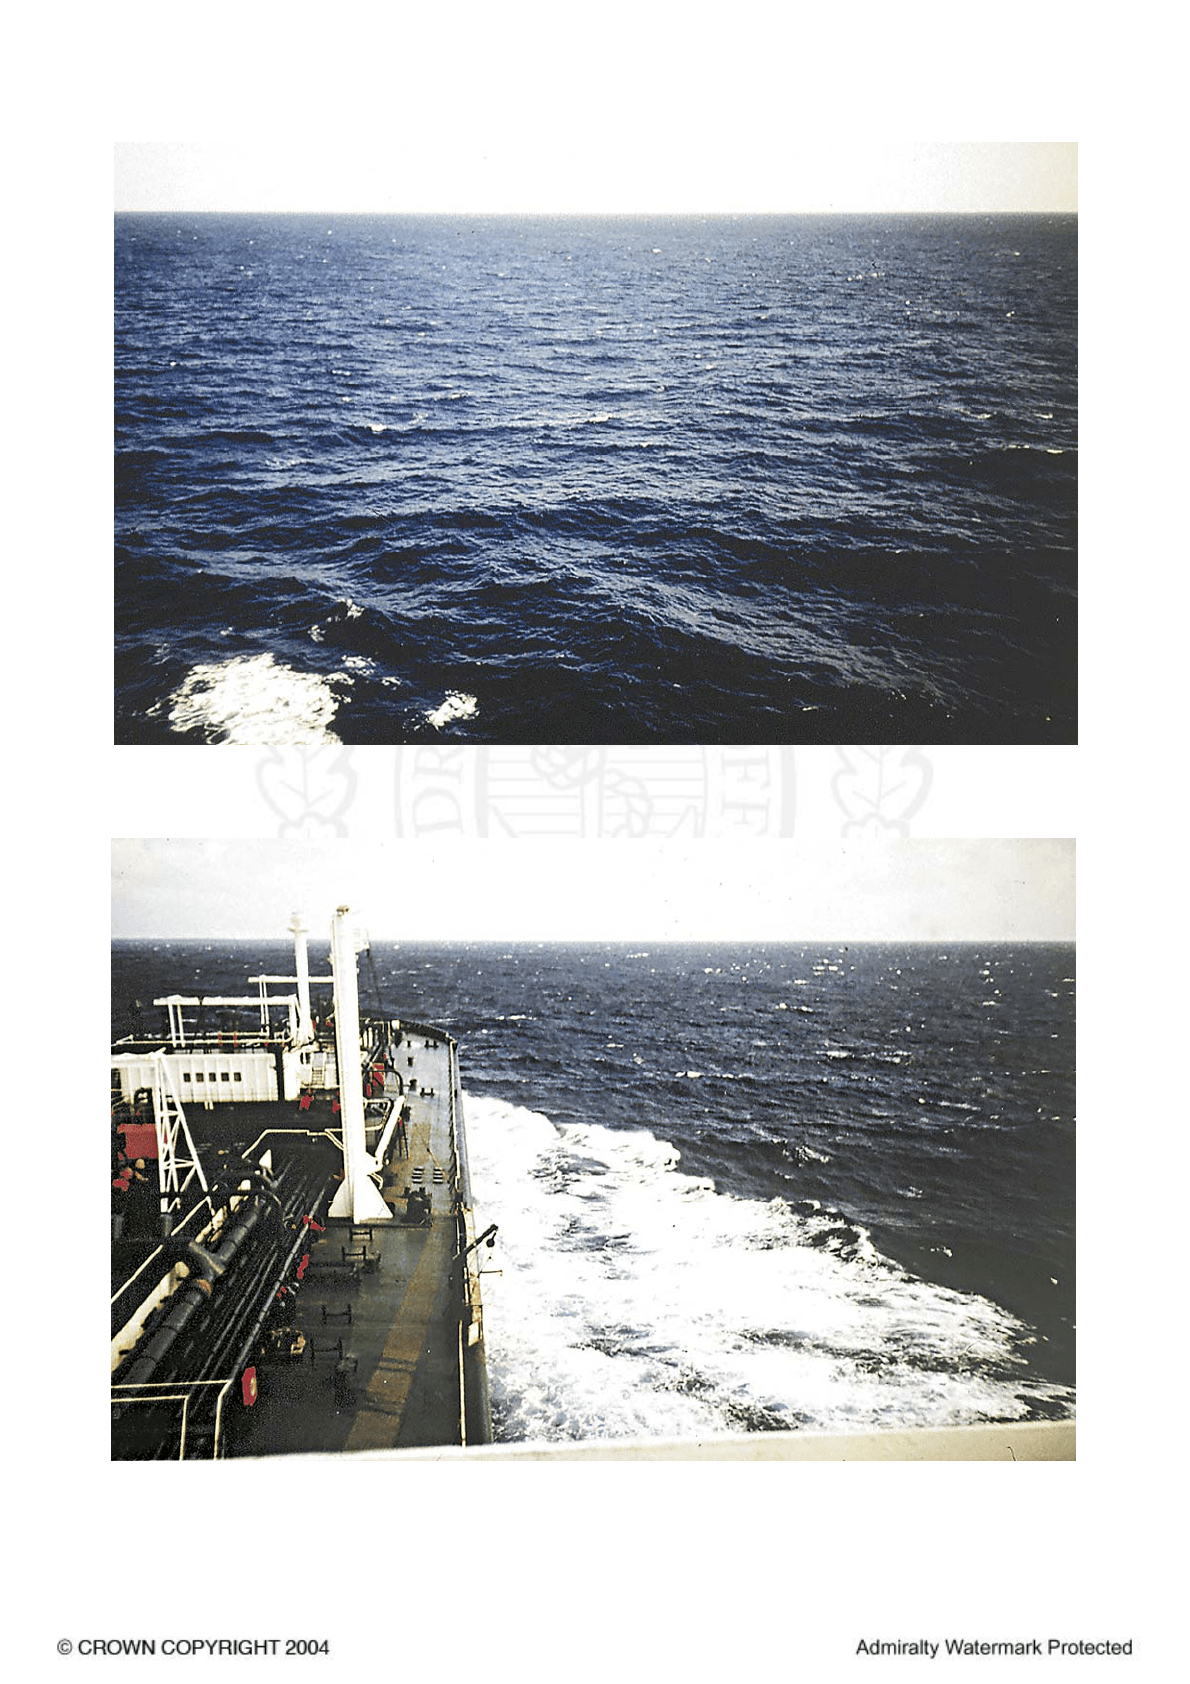
Force 0 − Wind speed less than 1 kn (Sea like a mirror)
(Photograph − M C Horner, Courtesy of the Meteorological Office)
Force 1 − Wind speed 1 − 3 kn; mean, 2 kn
(Ripples with the appearance of scales are formed, but without foam crests)
(Photograph − G J Simpson, Courtesy of the Meteorological Office)
Home
Contents
Index
CHAPTER 4
103
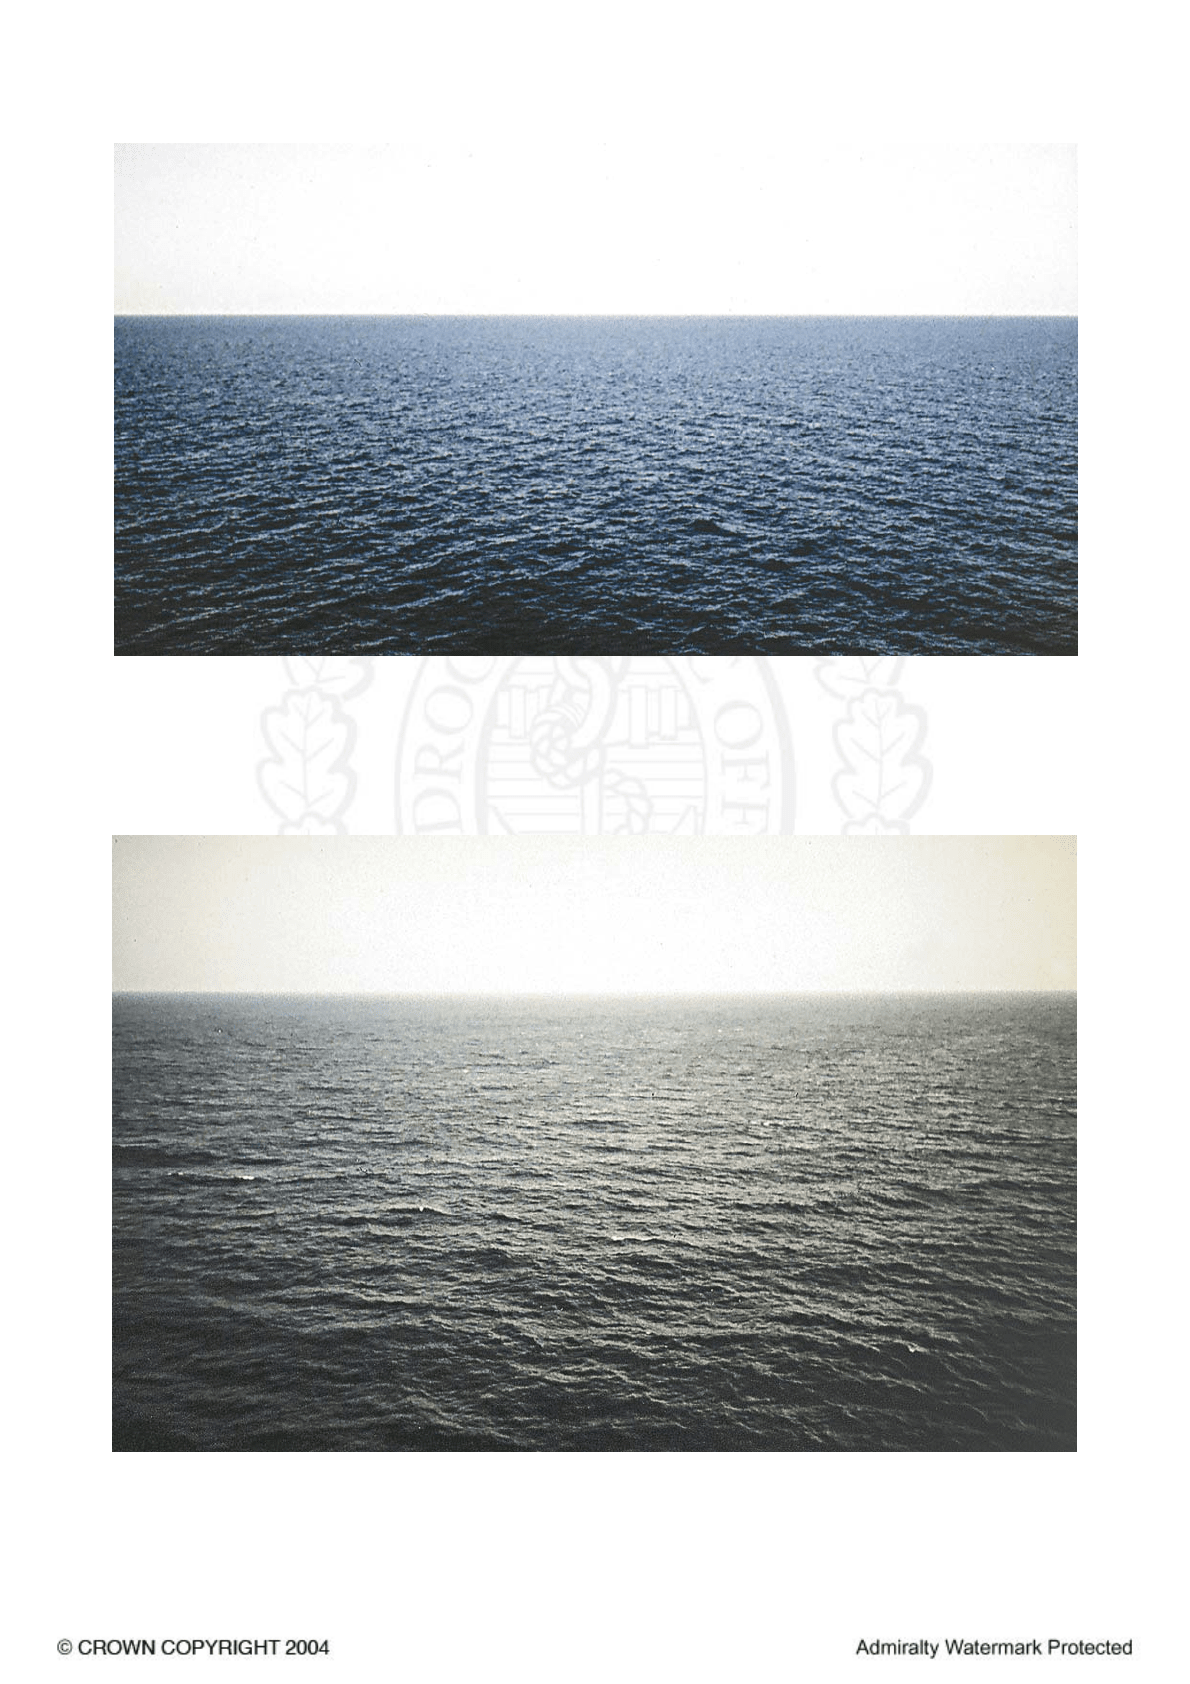
Force 2 − Wind speed 4 − 6 kn; mean, 5 kn
(Small wavelets, still short but more pronounced − crests have a glassy appearance and do not break)
(Photograph − G J Simpson, Courtesy of the Meteorological Office)
Force 3 − Wind speed 7 − 10 kn; mean, 9kn
(Large wavelets. Crests begin to break. Foam glassy appearance. Perhaps scattered horses)
(Photograph − I G MacNeil, Courtesy of the Meteorological Office)
Home
Contents
Index
CHAPTER 4
104
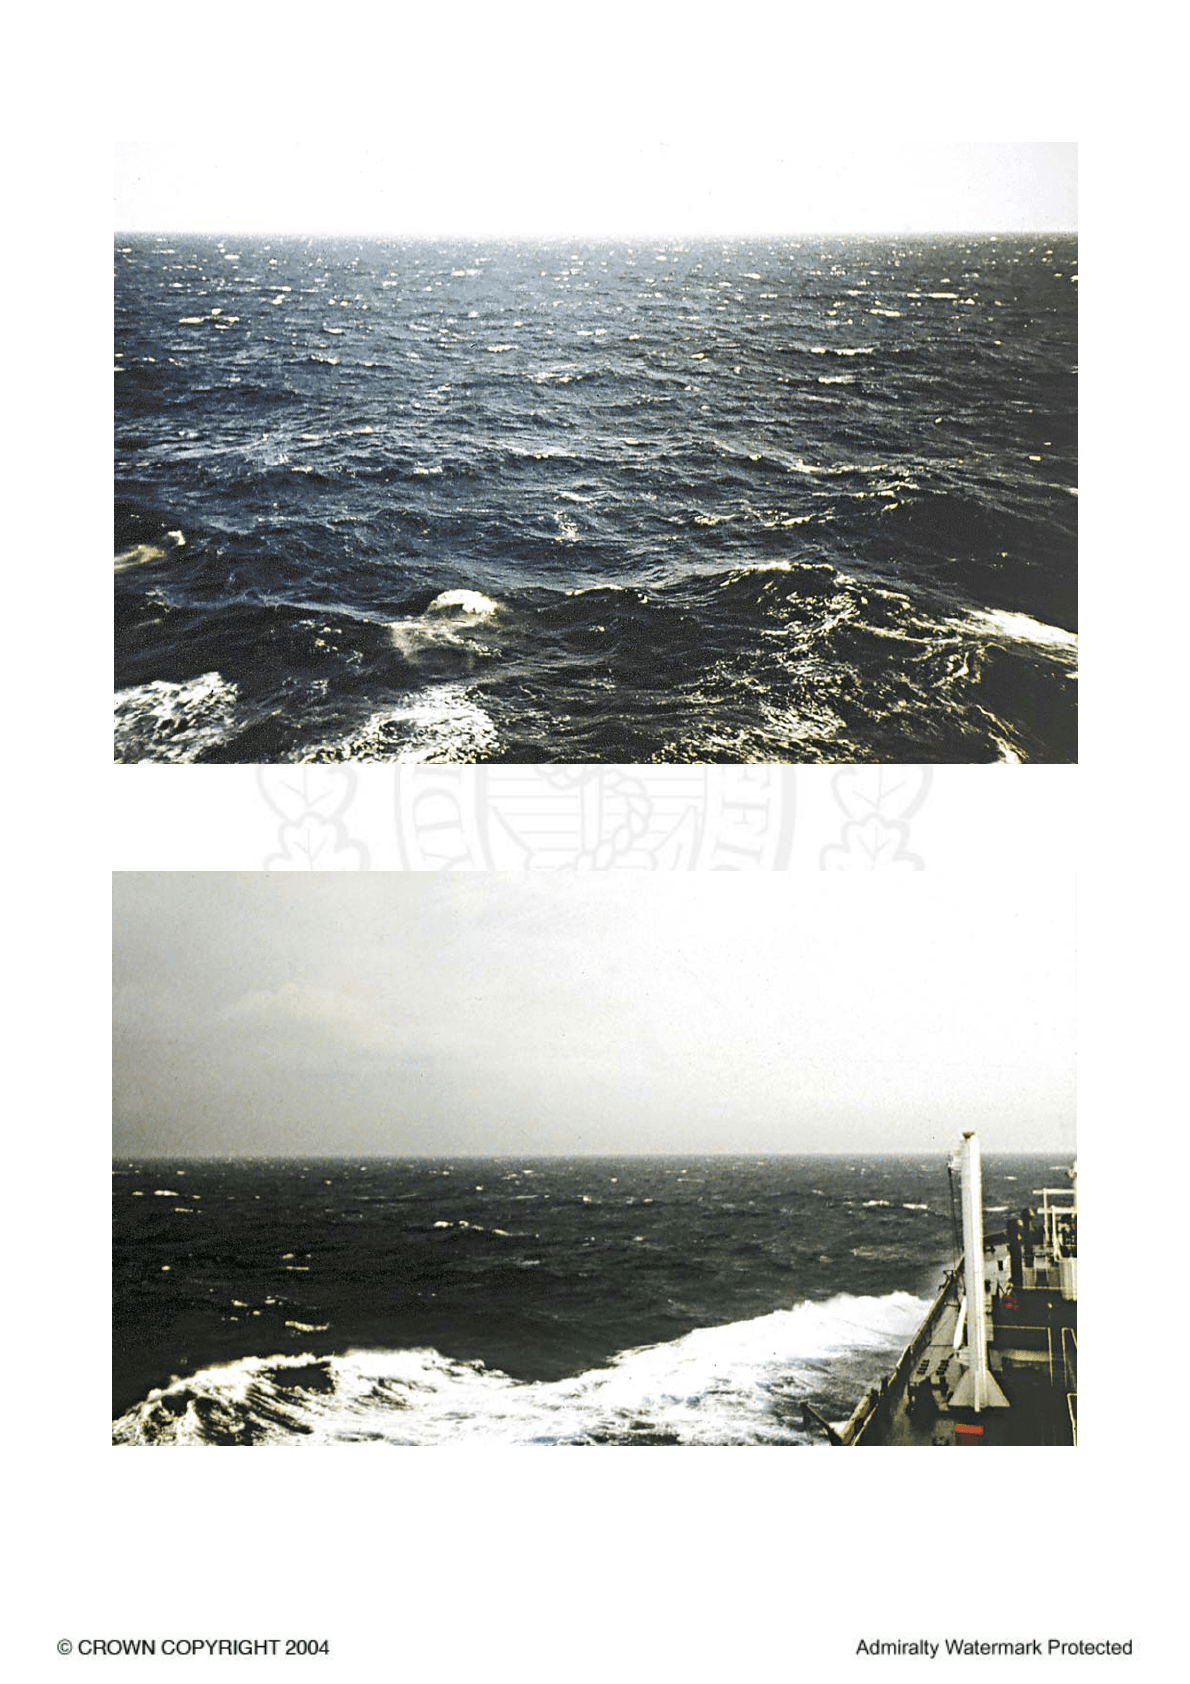
(Photograph − I G MacNeil, Courtesy of the Meteorological Office)
Force 4 − Wind speed 11 − 16 kn; mean, 13kn
(Small waves, becoming longer; fairly frequent white horses)
Force 5 − Wind speed 17 − 21 kn; mean, 19 kn
(Moderate waves, taking a more pronounced long form; many white horses are formed (Chance of some spray))
(Photograph − I G MacNeil, Courtesy of the Meteorological Office)
Home
Contents
Index
CHAPTER 4
105
Force 6 − Wind speed 22−27 kn; mean24 kn
(Large waves begin to form; the white foam crests are more extensive everywhere (Probably some spray))
(Photograph − I G MacNeil, Courtesy of the Meteorological Office)
Force 7 − Wind speed 28 − 33 kn; mean, 30 kn
(Sea heaps up and white foam from breaking waves begins to be blown in streaks along the direction of the wind)
(Photograph − G J Simpson,, Courtesy of the Meteorological Office)
Home
Contents
Index
CHAPTER 4
106
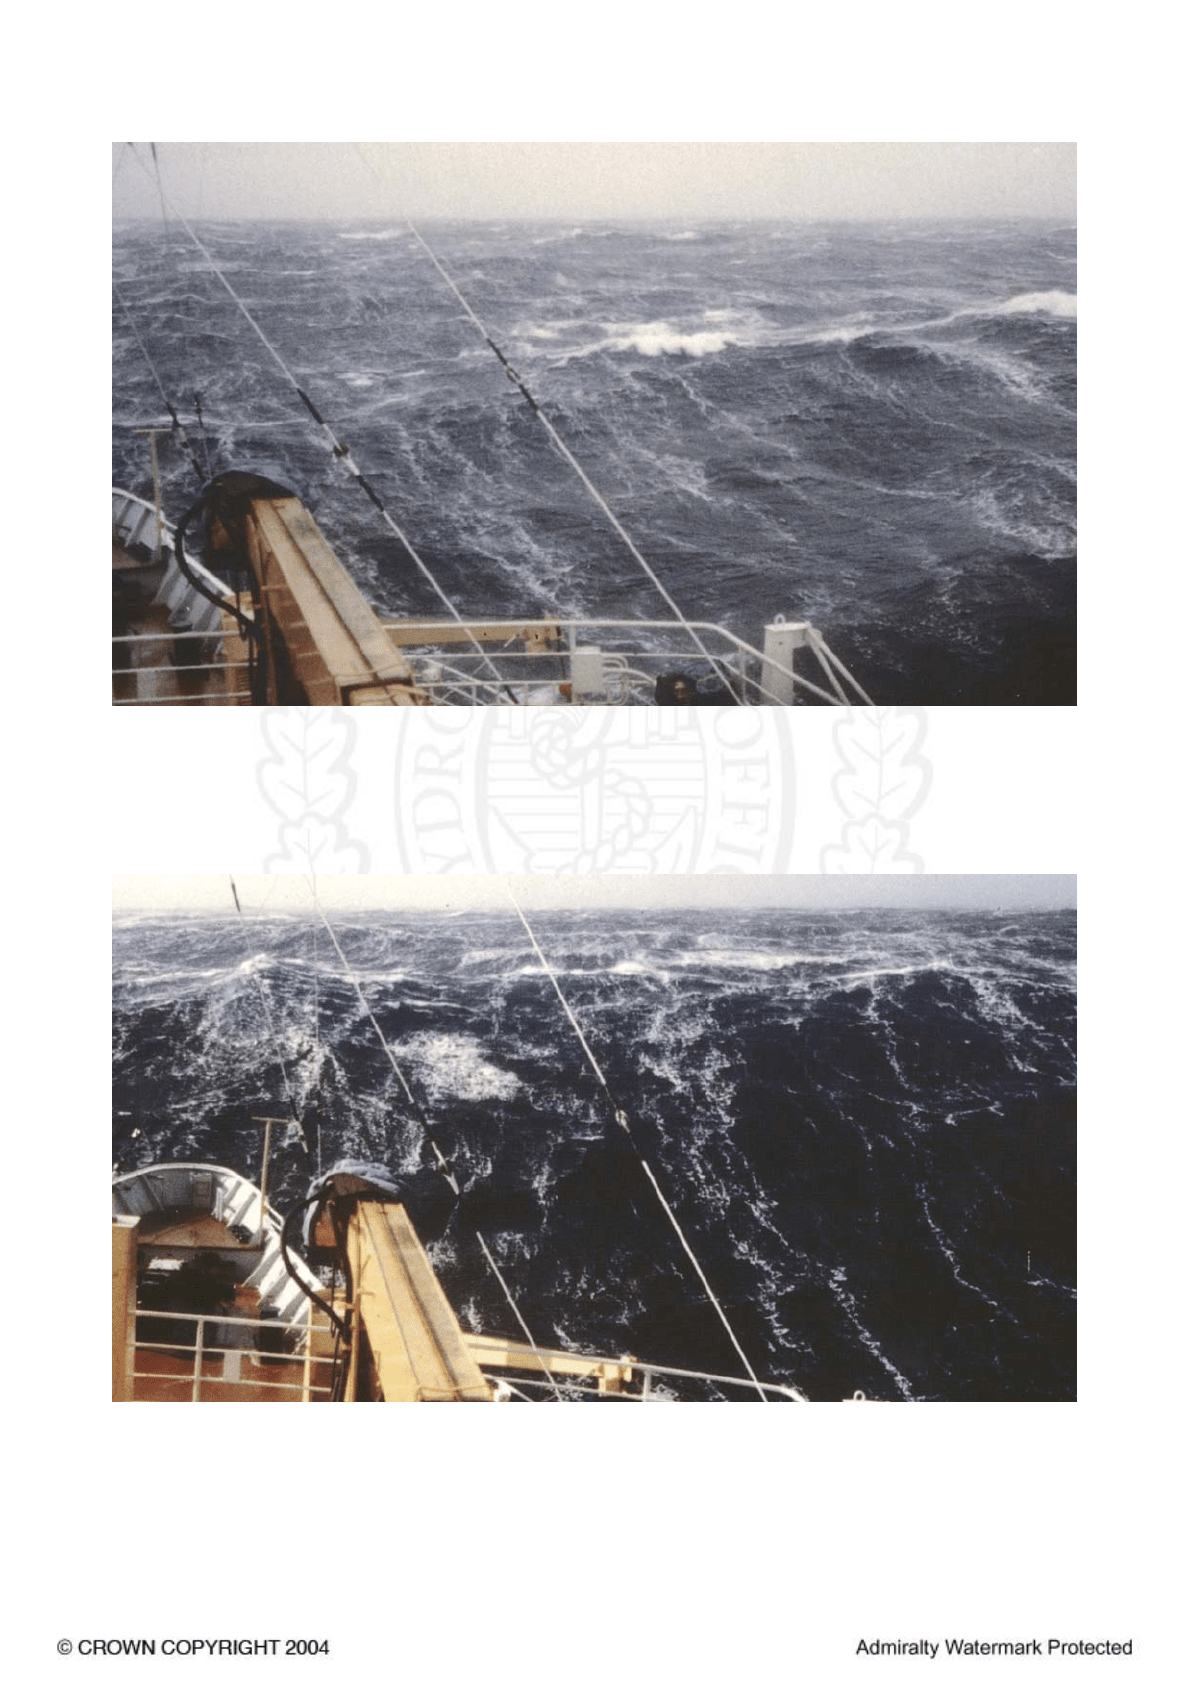
Force 8 − Windspeed 34 − 40 kn; mean 37kn
(Moderate high waves of greater length; edges of crests begin to break into the spindrift.
The foam is blown in well−marked streaks along the direction of the wind)
(Photograph − Environment Canada)
Force 9 − Windspeed 41 − 47 kn; mean 44kn
(High waves. Dense streaks of foam along direction of the wind.
Crests of waves begin to topple, tumble and roll over. Spray might affect visibility)
(Photograph − Environment Canada)
Home
Contents
Index
CHAPTER 4
107
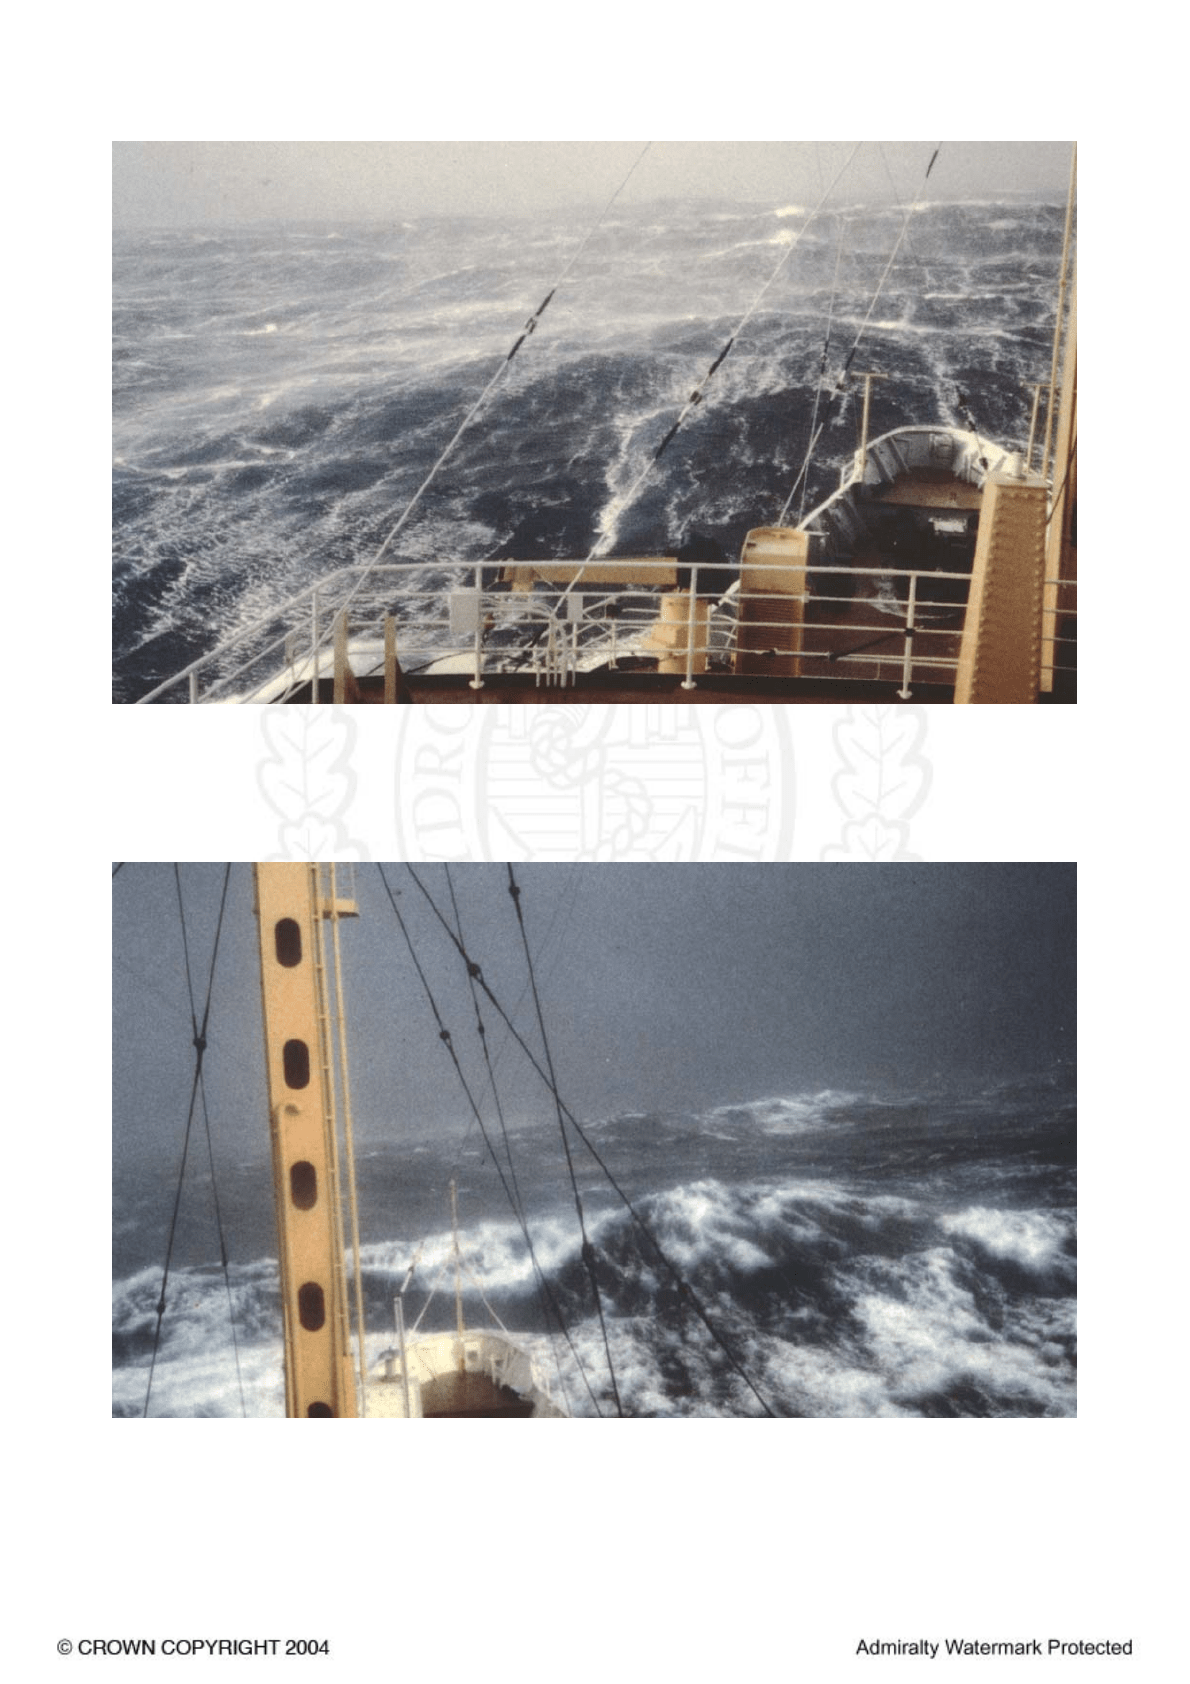
Force 10 − Windspeed 48 − 55 kn; mean 52kn
(Very high waves with long overhanging crests. The resulting foam, in great patches,
is blown in dense white streaks along the direction of the wind.
On the whole, the surface of the sea takes a white appearence. The tumbling of the sea
becomes heavy and shock−like. Visibility affected)
(Photograph − Environment Canada)
Force 11 − Windspeed 56 − 63 kn; mean 60kn
(Exceptionally high waves. (Small and medium sized ships might be for a time lost to view behind the waves.)
The sea is completely covered with long white patches of foam lying along the direction of the wind.
Everywhere the edges of the wave crests are blown into froth. Visiblity affected.)
(Photograph − Environment Canada)
Home
Contents
Index
CHAPTER 4
108
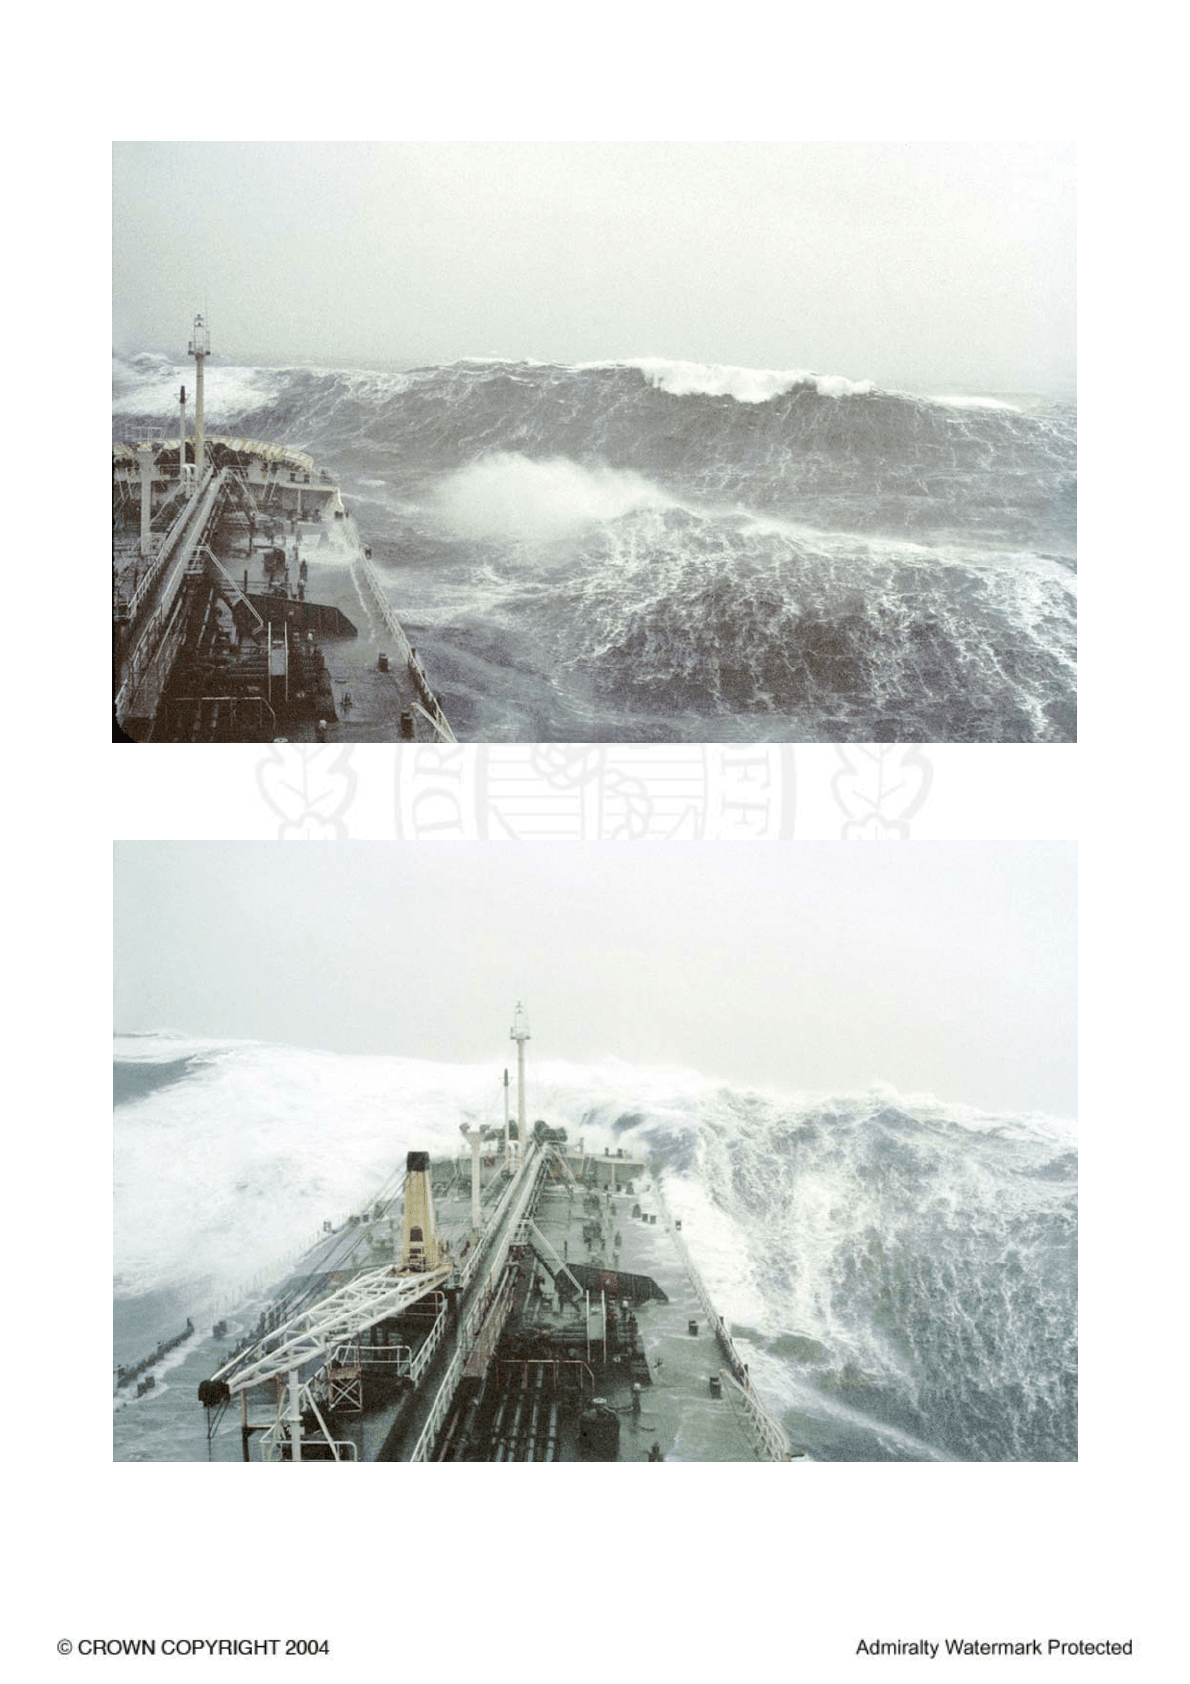
Force 12 − Windspeed greater than 63kn
(The air is filled with foam and spray. Sea completely white with driving spray; visibility very seriously affected)
(Photograph − Captain J. F. Thomson, Courtesy of the Meteorological Office))
Force 12 − Windspeed greater than 63kn
(The air is filled with foam and spray. Sea completely white with driving spray; visibility very seriously affected)
(Photograph − Captain J. F. Thomson, Courtesy of the Meteorological Office)
Home
Contents
Index
109
CHAPTER 5
METEOROLOGY
GENERAL MARITIME METEOROLOGY
Pressure and wind
Atmospheric pressure
5.1
1 Because of its weight the atmosphere exerts a pressure
on the surface of the Earth; this pressure varies from place
to place depending on the density of the air of which it is
comprised.
2 Pressure is measured by means of the barometer, and is
usually expressed in hectopascals (hPa). The millibar (mb)
was an earlier unit of measurement numerically equal to
the hectopascal. Mean value at sea level is about 1013 hPa
with extremes of around 950 and 1050 hPa. Pressure
decreases with height; in the near surface layers of the
atmosphere, at a rate of about 1 hPa every 30 ft. In order to
compare the pressures at a network of observing stations
which may be at different heights, it is necessary to use a
“standard” level. It is therefore usual to apply a
“correction” to the observed barometer reading so as to
calculate what the corresponding pressure would be at sea
level.
Wind
5.2
1 Air naturally flows from high to low pressure; but the
wind thus created does not blow directly across the isobars.
Coriolis force causes the flow to be deflected. The result is
that in the N hemisphere, air flows out of an anticyclone in
a clockwise circulation with the winds blowing slightly
outwards across the isobars at an angle of about 18°–20°.
As the air approaches an area of low pressure it forms an
anticlockwise circulation with winds blowing slightly
inwards across the isobars, again at an angle of about
10°–20°.
2 In the S hemisphere the circulations are reversed with
air diverging in an anticlockwise flow around an
anticyclone and converging in a clockwise circulation
around a depression.
The angle of flow across the isobars is the result of
friction between the air and the Earth’s surface due to
roughness of the sea or terrain, turbulence or similar effect,
which also causes a weakening of the wind strength.
3 Buys Ballot’s Law simplifies the matter as follows: face
the wind; the centre of low pressure will be from 90° to
135° on your right hand in the N hemisphere and on your
left hand in the S hemisphere.
The wind speed is governed by the pressure gradient (or
rate of change of pressure with distance) in locality: this is
shown by the spacing between the isobars; the closer the
spacing the greater the pressure gradient and the stronger
the wind.
The Beaufort Wind Scale (Table 5.2) gives criteria for
describing the force of the wind.
General global circulation
5.3
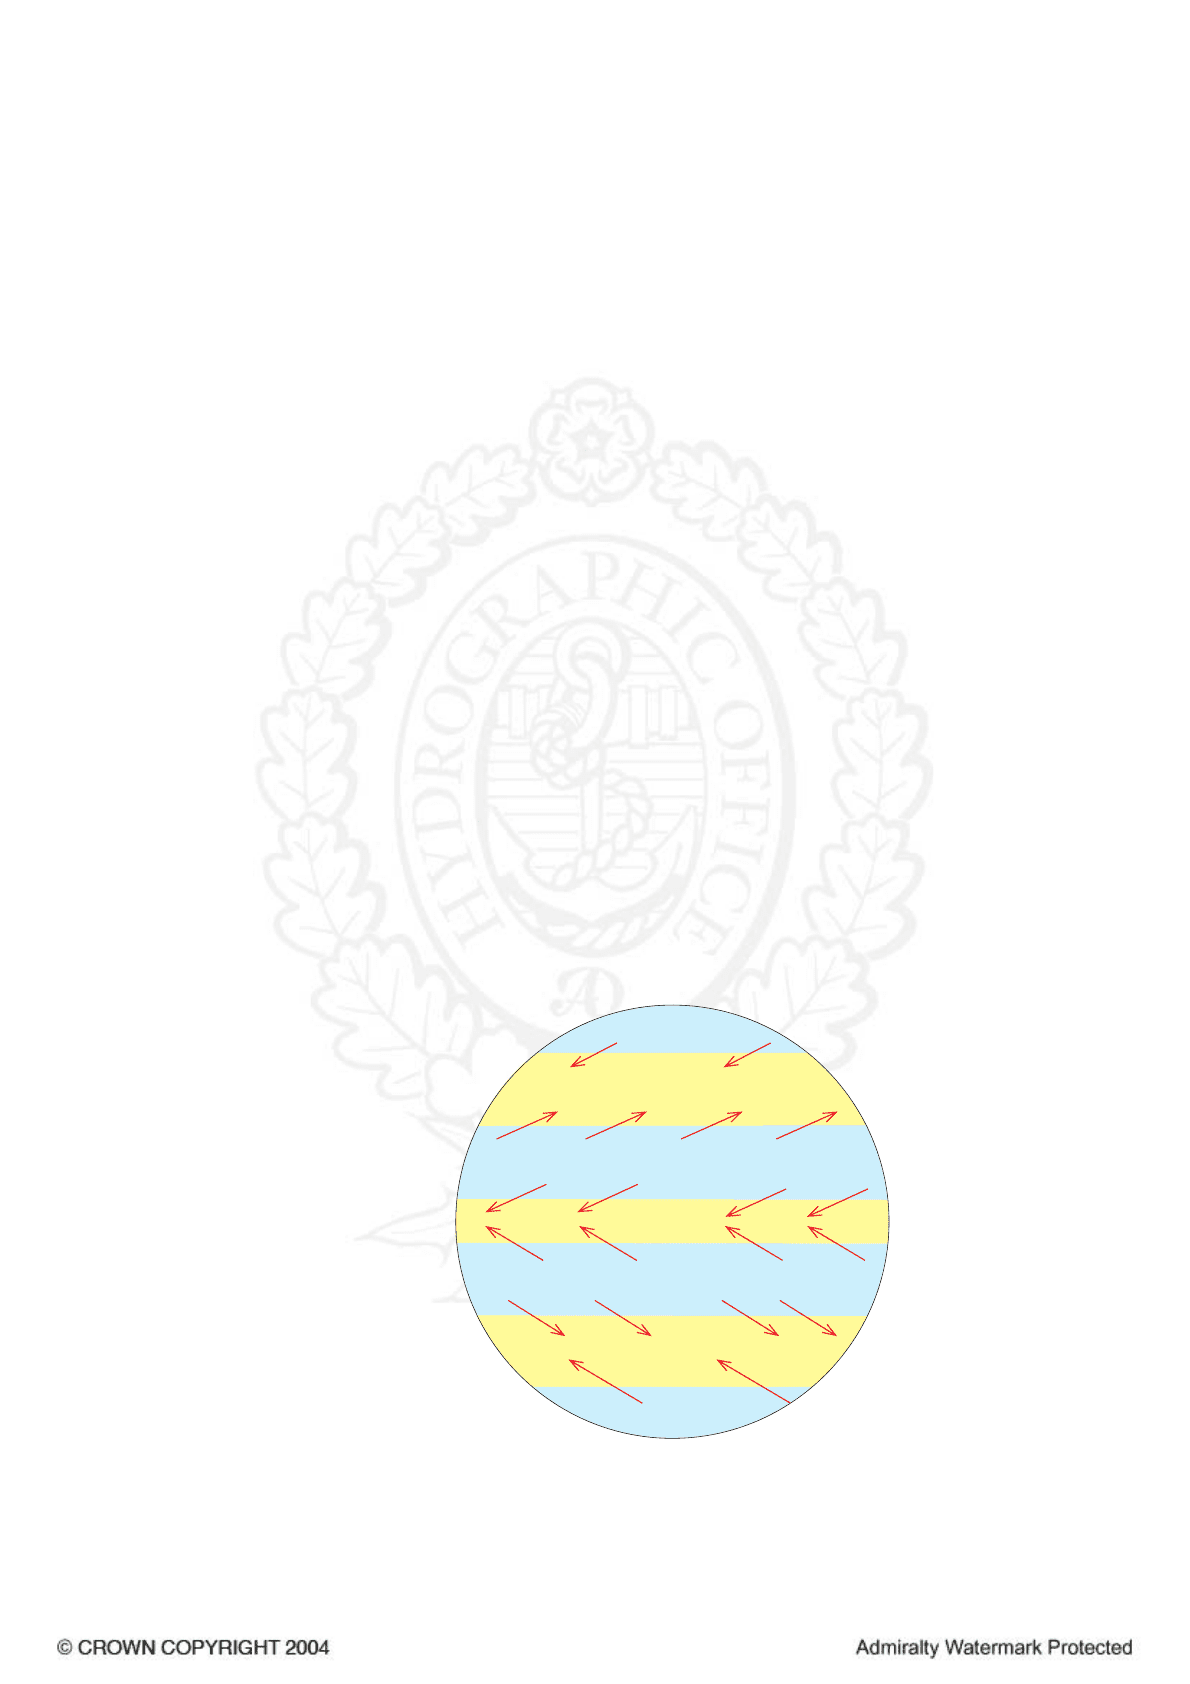
1 The diagram (5.3 below) shows the pressure belts and
associated surface wind systems which would exist over a
uniform Earth. These idealised global systems are
particularly evident over the large expanses of ocean;
substantial modifications are introduced by large land
masses.
HIGH
LOW
LOW
LOW
HIGH
HIGH
HIGH
N
S
Westerlies
Westerlies
Variables
Variables
NE Trades
Equatorial Trough
SE Trades
Polar Easterlies
Polar Easterlies
Roaring
Forties
( )
(Doldrums)
Pressure and Wind belts (5.3)
Home
Contents
Index