McConnell С., Campbell R. Macroeconomics: principles, problems, and policies, 17th ed
Подождите немного. Документ загружается.

CHAPTER 14
Interest Rates and Monetary Policy
263
Reserve Banks. When this money is circulating outside
the Federal Reserve Banks, it constitutes claims against
the assets of the Federal Reserve Banks. The Fed thus
treats these notes as a liability.
Tools of Monetary Policy
With this look at the Federal Reserve Banks’
consolidated balance sheet, we can now
explore how the Fed can influence the
money-creating abilities of the commercial
banking system. The Fed has three tools of
monetary control it can use to alter the
reserves of commercial banks:
• Open-market operations
• The reserve ratio
• The discount rate
Open-Market Operations
Bond markets are “open” to all buyers and sellers of cor-
porate and government bonds (securities). The Federal
Reserve is the largest single holder of U.S. government
securities. The U.S. government, not the Fed, issued these
Treasury bills, Treasury notes, and Treasury bonds to fi-
nance past budget deficits. Over the decades, the Fed has
purchased these securities from major financial institu-
tions that buy and sell government and corporate securi-
ties for themselves or their customers.
The Fed’s open-market operations consist of the
buying of government bonds from, or the selling of gov-
ernment bonds to, commercial banks and the general pub-
lic. (The Fed actually buys and sells the government bonds
to commercial banks and the public through two dozen or
so large financial firms, called “primary dealers. ” ) Open-
market operations are the Fed’s most important instru-
ment for influencing the money supply.
Buying Securities Suppose that the Fed decides to
have the Federal Reserve Banks buy government bonds.
They can purchase these bonds either from commercial
banks or from the public. In both cases the reserves of the
commercial banks will increase.
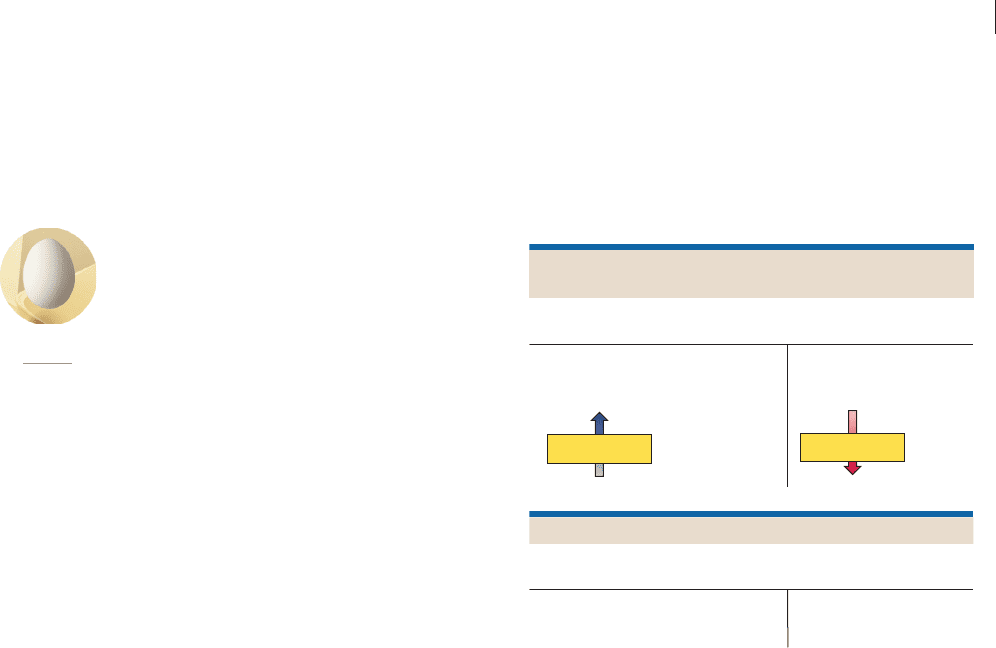
From Commercial Banks When Federal Reserve
Banks buy government bonds from commercial banks,
( a ) The commercial banks give up part of their holdings
of securities (the government bonds) to the Federal
Reserve Banks.
(b) The Federal Reserve Banks, in paying for these
securities, place newly created reserves in the
Commercial Banks
Fed Buys Bonds from Commercial Banks
Federal Reserve Banks
Liabilities and
net worth
Assets
Securities (a)
Reserves of
commercial banks (b)
Liabilities and
net worth
Assets
Securities (a)
Reserves (b)
(a) Securities
(b) Reserves
The upward arrow shows that securities have moved from
the commercial banks to the Federal Reserve Banks. So
we enter “ Securities” (minus securities) in the asset col-
umn of the balance sheet of the commercial banks. For the
same reason, we enter “ Securities” in the asset column
of the balance sheet of the Federal Reserve Banks.
The downward arrow indicates that the Federal
Reserve Banks have provided reserves to the commercial
banks. So we enter “ Reserves” in the asset column of
the balance sheet for the commercial banks. In the liability
column of the balance sheet of the Federal Reserve Banks,
the plus sign indicates that although commercial bank
reserves have increased, they are a liability to the Federal
Reserve Banks because the reserves are owned by the com-
mercial banks.
What is most important about this transaction is that
when Federal Reserve Banks purchase securities from
commercial banks, they increase the reserves in the bank-
ing system, which then increases the lending ability of the
commercial banks.
From the Public The effect on commercial bank
reserves is much the same when Federal Reserve Banks
purchase securities from the general public. Suppose the
Gristly Meat Packing Company has government bonds
O 14.2
Tools of
monetary policy
accounts of the commercial banks at the Fed. (These
reserves are created “out of thin air,” so to speak!)
The reserves of the commercial banks go up by the
amount of the purchase of the securities.
We show these outcomes as ( a ) and ( b ) on the following
consolidated balance sheets of the commercial banks and
the Federal Reserve Banks:
mcc26632_ch14_258-283.indd 263mcc26632_ch14_258-283.indd 263 9/1/06 3:46:35 PM9/1/06 3:46:35 PM
CONFIRMING PAGES
PART FOUR
Money, Banking, and Monetary Policy
264
that it sells in the open market to the Federal Reserve
Banks. The transaction has several elements:
( a ) Gristly gives up securities to the Federal Reserve
Banks and gets in payment a check drawn by the
Federal Reserve Banks on themselves.
( b ) Gristly promptly deposits the check in its account
with the Wahoo bank.
( c ) The Wahoo bank sends this check against the
Federal Reserve Banks to a Federal Reserve Bank for
collection. As a result, the Wahoo bank enjoys an
increase in its reserves.
To keep things simple, we will dispense with showing the
balance sheet changes resulting from the Fed’s sale or pur-
chase of bonds from the public. But two aspects of this
transaction are particularly important. First, as with
Federal Reserve purchases of securities directly from com-
mercial banks, the purchases of securities from the public
increases the lending ability of the commercial banking
system. Second, the supply of money is directly increased
by the Federal Reserve Banks’ purchase of government
bonds (aside from any expansion of the money supply that
may occur from the increase in commercial bank reserves).
This direct increase in the money supply has taken the
form of an increased amount of checkable deposits in the
economy as a result of Gristly’s deposit.
The Federal Reserve Banks’ purchases of securities
from the commercial banking system differ slightly from
their purchases of securities from the public. If we assume
that all commercial banks are loaned up initially, Federal
Reserve bond purchases from commercial banks increase the
actual reserves and excess reserves of commercial banks by
the entire amount of the bond purchases. As shown in the
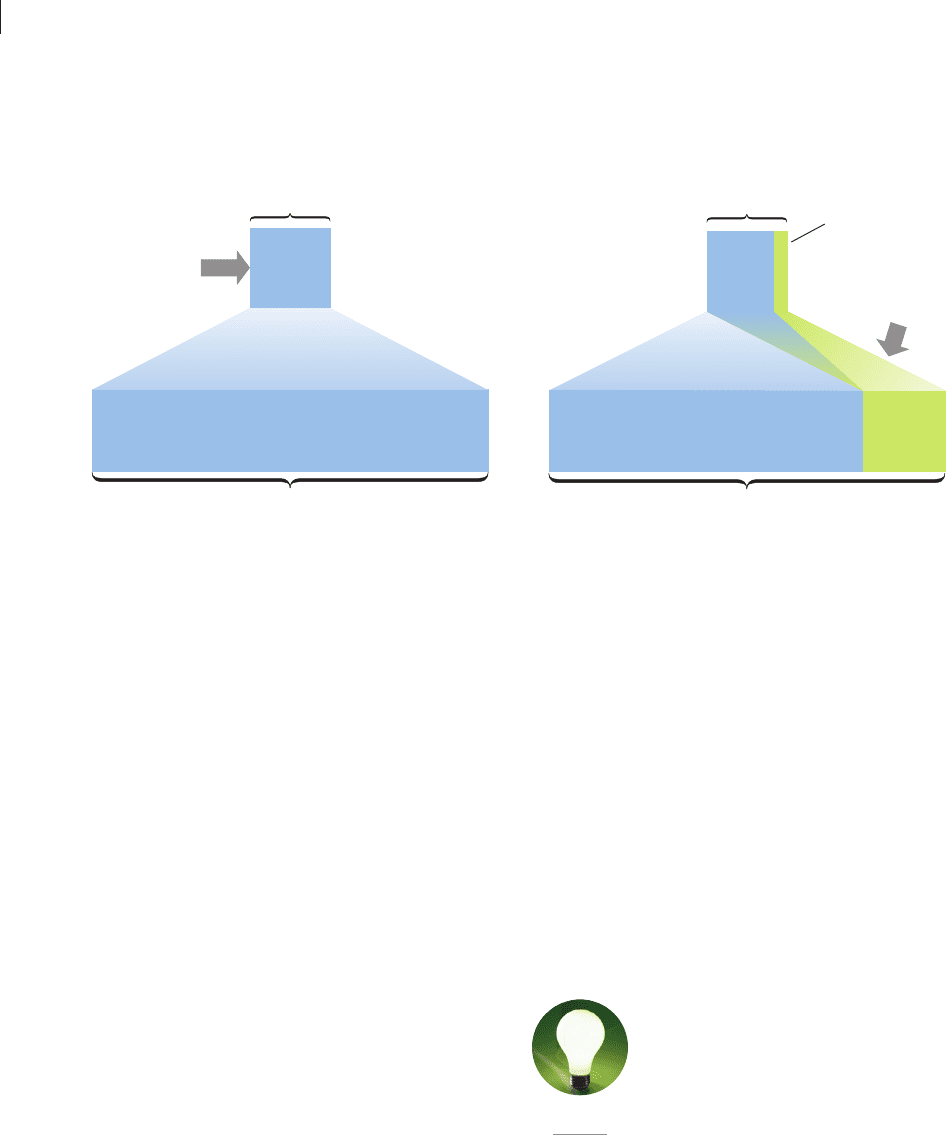
left panel in Figure 14.2 , a $1000 bond purchase from a
commercial bank increases both the actual and the excess
reserves of the commercial bank by $1000.
In contrast, Federal Reserve Bank purchases of bonds
from the public increase actual reserves but also increase
checkable deposits when the sellers place the Fed’s check
into their personal checking accounts. Thus, a $1000 bond
purchase from the public would increase checkable depos-
its by $1000 and hence the actual reserves of the loaned-up
banking system by the same amount. But with a 20 percent
reserve ratio applied to the $1000 checkable deposit, the
excess reserves of the banking system would be only $800
since $200 of the $1000 would have to be held as reserves.
However, in both transactions the end result is the same:
When Federal Reserve Banks buy securities in the open
market, commercial banks’ reserves are increased. When the
banks lend out an amount equal to their ex-
cess reserves, the nation’s money supply will
rise. Observe in Figure 14.2 that a $1000
purchase of bonds by the Federal Reserve
results in a potential of $5000 of additional
money, regardless of whether the purchase
was made from commercial banks or from
the general public.
Selling Securities As you may suspect, when the
Federal Reserve Banks sell government bonds, commer-
cial banks’ reserves are reduced. Let’s see why.
FIGURE 14.2 The Federal Reserve’s purchase of bonds and the expansion of the money supply. Assuming all banks are
loaned up initially, a Federal Reserve purchase of a $1000 bond from either a commercial bank or the public can increase the money supply by $5000 when
the reserve ratio is 20 percent. In the left panel of the diagram, the purchase of a $1000 bond from a commercial bank creates $1000 of excess reserves
that support a $5000 expansion of checkable deposits through loans. In the right panel, the purchase of a $1000 bond from the public creates a $1000
checkable deposit but only $800 of excess reserves, because $200 of reserves is required to “back up” the $1000 new checkable deposit. The commercial
banks can therefore expand the money supply by only $4000 by making loans. This $4000 of checkable-deposit money plus the new checkable deposit of
$1000 equals $5000 of new money.
$1000
Excess
reserves
$5000
Bank system lending
1. Fed buys
$1000 bond
from a
commercial bank
2. New reserves
3. Total increase in money supply ($5000)
1. Fed buys $1000
bond from the
public
3. New reserves
4. $200
(required
reserves)
5. Total increase in money supply ($5000)
2. $1000
initial
checkable
deposit
$4000
Bank system lending
$800
Excess
reserves
W 14.3
Open-market
operations
mcc26632_ch14_258-283.indd 264mcc26632_ch14_258-283.indd 264 9/1/06 3:46:35 PM9/1/06 3:46:35 PM
CONFIRMING PAGES
CHAPTER 14
Interest Rates and Monetary Policy
265
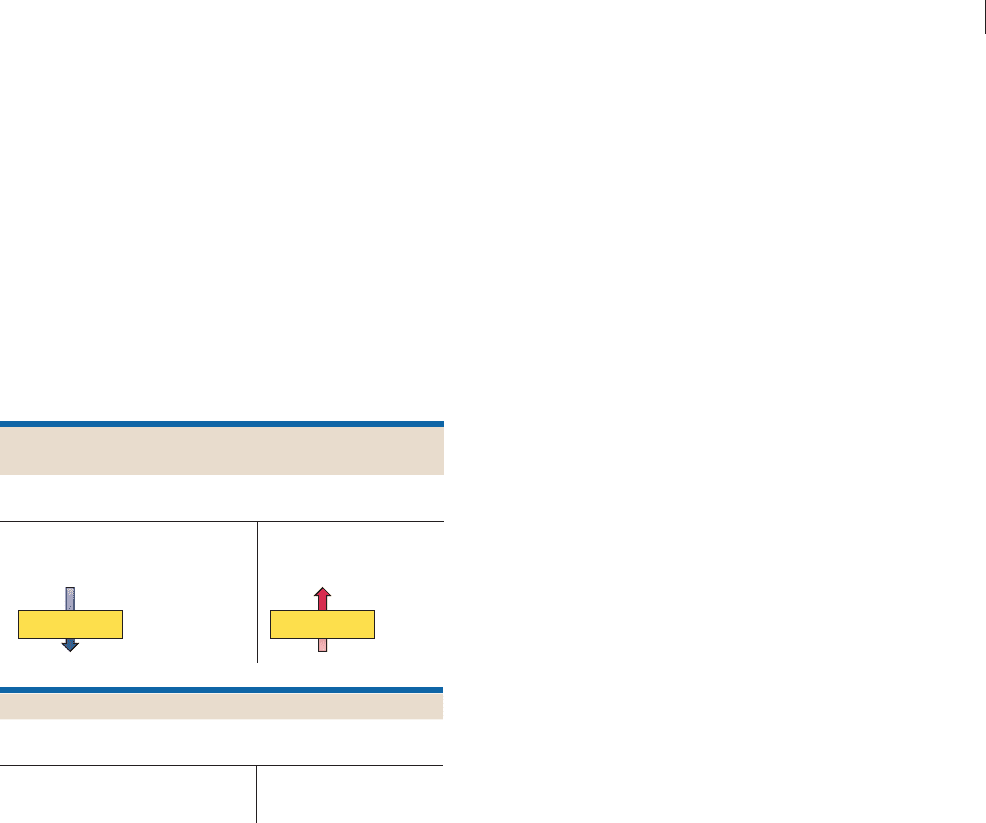
To Commercial Banks When the Federal Reserve
Banks sell securities in the open market to commercial
banks,
( a ) The Federal Reserve Banks give up securities that
the commercial banks acquire.
( b ) The commercial banks pay for those securities by
drawing checks against their deposits—that is,
against their reserves—in Federal Reserve Banks.
The Fed collects those checks by reducing the
commercial banks’ reserves accordingly.
The balance-sheet changes—again identified by ( a ) and
( b )—appear as shown below. The reduction in commercial
bank reserves is indicated by the minus signs before the
appropriate entries.
checkable-deposit money is also reduced by $1000 by the
sale. Since the commercial banking system’s outstanding
checkable deposits are reduced by $1000, banks need keep
$200 less in reserves.
Whether the Fed sells bonds to the public or to com-
mercial banks, the result is the same: When Federal
Reserve Banks sell securities in the open market, commer-
cial bank reserves are reduced. If all excess reserves are al-
ready lent out, this decline in commercial bank reserves
produces a decline in the nation’s money supply. In our
example, a $1000 sale of government securities results in a
$5000 decline in the money supply whether the sale is
made to commercial banks or to the general public. You
can verify this by reexamining Figure 14.2 and tracing the
effects of a sale of a $1000 bond by the Fed either to com-
mercial banks or to the public.
What makes commercial banks and the public willing
to sell government securities to, or buy them from, Federal
Reserve Banks? The answer lies in the price of bonds and
their interest yields. We know that bond prices and interest
rates are inversely related. When the Fed buys government
bonds, the demand for them increases. Government bond
prices rise, and their interest yields decline. The higher
bond prices and their lower interest yields prompt banks,
securities firms, and individual holders of government
bonds to sell them to the Federal Reserve Banks.
When the Fed sells government bonds, the additional
supply of bonds in the bond market lowers bond prices
and raises their interest yields, making government bonds
attractive purchases for banks and the public.
The Reserve Ratio
The Fed can also manipulate the reserve ratio in order to
influence the ability of commercial banks to lend. Suppose a
commercial bank’s balance sheet shows that reserves are
$5000 and checkable deposits are $20,000. If the legal reserve
ratio is 20 percent (row 2, Table 14.2 ), the bank’s required
reserves are $4000. Since actual reserves are $5000, the ex-
cess reserves of this bank are $1000. On the basis of $1000 of
excess reserves, this one bank can lend $1000; however, the
banking system as a whole can create a maximum of $5000
of new checkable-deposit money by lending (column 7).
Raising the Reserve Ratio Now, what if the Fed
raised the reserve ratio from 20 to 25 percent? (See row 3.)
Required reserves would jump from $4000 to $5000,
shrinking excess reserves from $1000 to zero. Raising the
reserve ratio increases the amount of required reserves
banks must keep. As a consequence, either banks lose excess
reserves, diminishing their ability to create money by lend-
ing, or they find their reserves deficient and are forced to
To the Public When the Federal Reserve Banks sell
securities to the public, the outcome is much the same.
Let’s put the Gristly Company on the buying end of
government bonds that the Federal Reserve Banks are
selling:
( a ) The Federal Reserve Banks sell government bonds to
Gristly, which pays with a check drawn on the
Wahoo bank.
( b ) The Federal Reserve Banks clear this check against
the Wahoo bank by reducing Wahoo’s reserves.
( c ) The Wahoo bank returns the canceled check to
Gristly, reducing Gristly’s checkable deposit
accordingly.
Federal Reserve bond sales of $1000 to the commer-
cial banking system reduce the system’s actual and excess
reserves by $1000. But a $1000 bond sale to the public
reduces excess reserves by $800, because the public’s
Commercial Banks
Fed Sells Bonds to Commerical Banks
Federal Reserve Banks
Liabilities and
net worth
Assets
Securities (a) Reserves of
commercial banks (b)
Liabilities and
net worth
Assets
Reserves (b)
Securities (a)
(a) Securities (b) Reserves
mcc26632_ch14_258-283.indd 265mcc26632_ch14_258-283.indd 265 9/1/06 3:46:36 PM9/1/06 3:46:36 PM
CONFIRMING PAGES
PART FOUR
Money, Banking, and Monetary Policy
266
contract checkable deposits and therefore the money sup-
ply. In the example in Table 14.2 , excess reserves are trans-
formed into required reserves, and the money-creating
potential of our single bank is reduced from $1000 to zero
(column 6). Moreover, the banking system’s money- creating
capacity declines from $5000 to zero (column 7).
What if the Fed increases the reserve requirement to
30 percent? (See row 4.) The commercial bank, to protect
itself against the prospect of failing to meet this requirement,
would be forced to lower its checkable deposits and at the
same time increase its reserves. To reduce its checkable de-
posits, the bank could let outstanding loans mature and be
repaid without extending new credit. To increase reserves,
the bank might sell some of its bonds, adding the proceeds
to its reserves. Both actions would reduce the supply of
money.
Lowering the Reserve Ratio What would
happen if the Fed lowered the reserve ratio from the origi-
nal 20 percent to 10 percent? (See row 1.) In this case, re-
quired reserves would decline from $4000 to $2000, and
excess reserves would jump from $1000 to $3000. The sin-
gle bank’s lending (money-creating) ability would increase
from $1000 to $3000 (column 6), and the banking system’s
money-creating potential would expand from $5000 to
$30,000 (column 7). Lowering the reserve ratio transforms
required reserves into excess reserves and enhances the
ability of banks to create new money by lending.
The examples in Table 14.2 show that a change in the
reserve ratio affects the money-creating ability of the
banking system in two ways:
• It changes the amount of excess reserves.
• It changes the size of the monetary multiplier.
For example, when the legal reserve ratio is raised from
10 to 20 percent, excess reserves are reduced from $3000
to $1000 and the checkable-deposit multiplier is reduced
from 10 to 5. The money-creating potential of the bank-
ing system declines from $30,000 ( $3000 10) to
$5000 ( $1000 5). Raising the reserve ratio forces
banks to reduce the amount of checkable deposits they
create through lending.
The Discount Rate
One of the functions of a central bank is to be a “lender of
last resort.” Occasionally, commercial banks have unex-
pected and immediate needs for additional funds. In such
cases, each Federal Reserve Bank will make short-term
loans to commercial banks in its district.
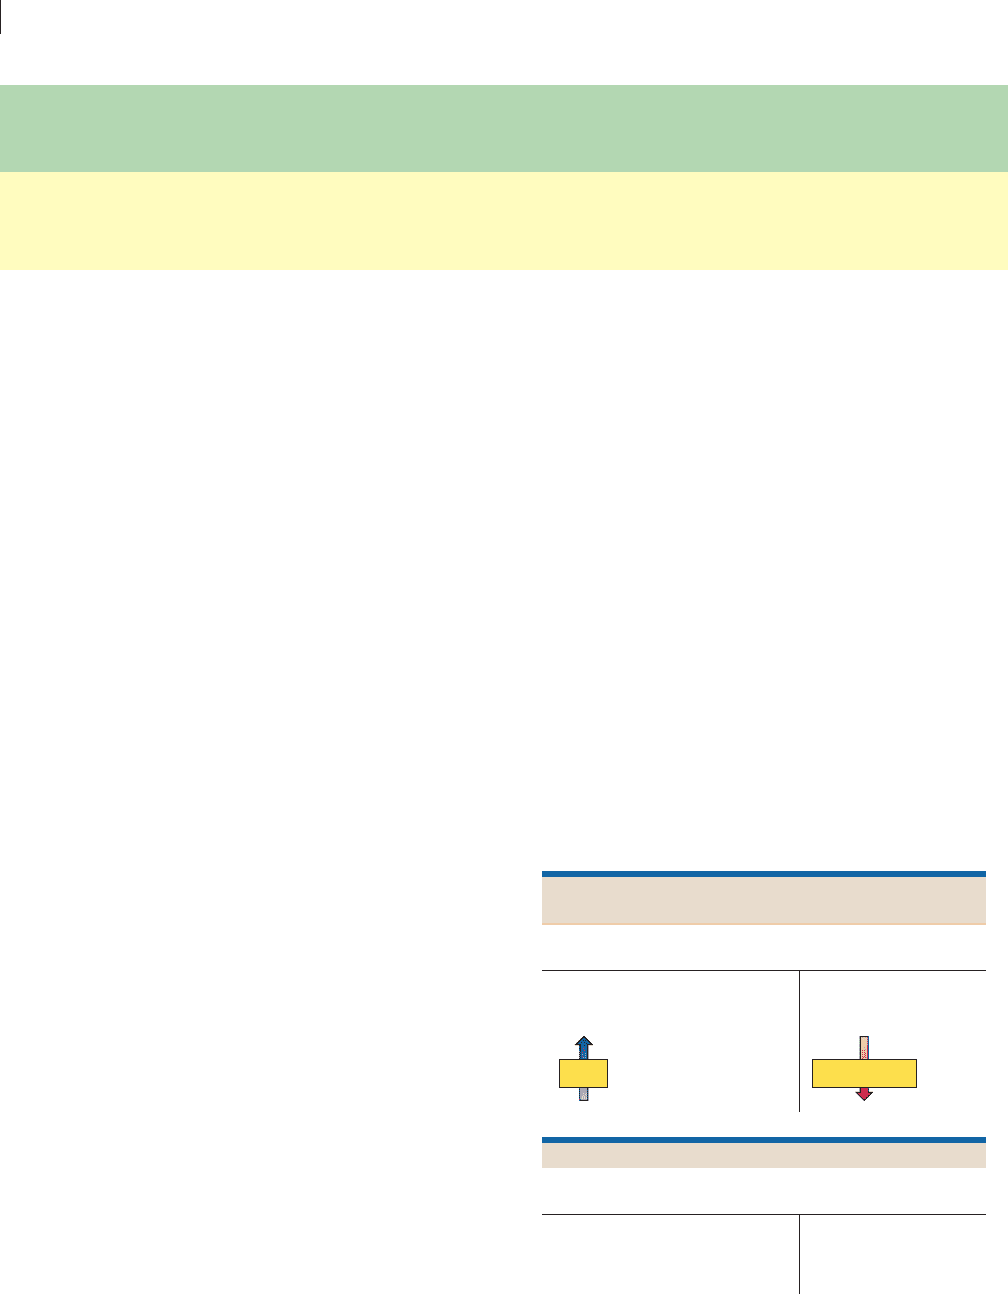
When a commercial bank borrows, it gives the
Federal Reserve Bank a promissory note (IOU) drawn
against itself and secured by acceptable collateral—
typically U.S. government securities. Just as commercial
banks charge interest on their loans, so too Federal
Reserve Banks charge interest on loans they grant to com-
mercial banks. The interest rate they charge is called the
discount rate .
As a claim against the commercial bank, the borrowing
bank’s promissory note is an asset to the lending Federal
Reserve Bank and appears on its balance sheet as “Loans
to commercial banks.” To the commercial bank the IOU is
a liability, appearing as “Loans from the Federal Reserve
Banks” on the commercial bank’s balance sheet. [See en-
tries ( a ) on the balance sheets below.]
TABLE 14.2 The Effects of Changes in the Reserve Ratio on the Lending Ability of Commercial Banks
(5) (6) (7)
(1) (2) (3) (4) Excess Money-Creating Money-Creating
Reserve Checkable Actual Required Reserves, Potential of Potential of
Ratio, % Deposits Reserves Reserves (3) ⴚ (4) Single Bank, ⴝ (5) Banking System
(1) 10 $20,000 $5000 $2000 $ 3000 $ 3000 $30,000
(2) 20 20,000 5000 4000 1000 1000 5000
(3) 25 20,000 5000 5000 0 0 0
(4) 30 20,000 5000 6000 1000 1000 3333
Commercial Banks
Commercial Bank Borrowing from the Fed
Federal Reserve Banks
Liabilities and
net worth
Assets
Loans to
commercial banks (a)
Reserves of
commercial banks (b)
Liabilities and
net worth
Assets
Reserves (b) Loans from the
Federal Reserve
Banks (a)
IOUs Reserves
mcc26632_ch14_258-283.indd 266mcc26632_ch14_258-283.indd 266 9/1/06 3:46:36 PM9/1/06 3:46:36 PM
CONFIRMING PAGES

CHAPTER 14
Interest Rates and Monetary Policy
267
In providing the loan, the Federal Reserve Bank
increases the reserves of the borrowing commercial bank.
Since no required reserves need be kept against loans
from Federal Reserve Banks, all new reserves acquired by
borrowing from Federal Reserve Banks are excess re-
serves. [These changes are reflected in entries ( b ) on the
balance sheets.]
In short, borrowing from the Federal Reserve Banks
by commercial banks increases the reserves of the com-
mercial banks and enhances their ability to extend credit.
The Fed has the power to set the discount rate at
which commercial banks borrow from Federal Reserve
Banks. From the commercial banks’ point of view, the dis-
count rate is a cost of acquiring reserves. A lowering of the
discount rate encourages commercial banks to obtain
additional reserves by borrowing from Federal Reserve
Banks. When the commercial banks lend new reserves, the
money supply increases.
An increase in the discount rate discourages commer-
cial banks from obtaining additional reserves through bor-
rowing from the Federal Reserve Banks. So the Fed may
raise the discount rate when it wants to restrict the money
supply. (Key Question 5)
Relative Importance
Of the three instruments of monetary control, buying and
selling securities in the open market is clearly the most im-
portant. This technique has the advantage of flexibility—
government securities can be purchased or sold daily in
large or small amounts—and the impact on bank reserves is
prompt. And, compared with reserve-requirement changes,
open-market operations work subtly and less directly. Fur-
thermore, the ability of the Federal Reserve Banks to affect
commercial bank reserves through the purchase and sale of
bonds is virtually unquestionable. The Federal Reserve
Banks have very large holdings of government securities
($760 billion in early 2006, for example). The sale of those
securities could theoretically reduce commercial bank re-
serves to zero.
Changing the reserve requirement is a less important
instrument of monetary control, and the Fed has used this
technique only sparingly. Normally, it can accomplish its
monetary goals easier through open-market operations.
The limited use of changes in the reserve ratio undoubt-
edly relates to the fact that reserves earn no interest.
Consequently, raising or lowering reserve requirements
has a substantial effect on bank profits. The last change in
the reserve requirement was in 1992, when the Fed re-
duced the requirement from 12 percent to 10 percent. The
main purpose was to shore up the profitability of banks and
thrifts during recession rather than to increase reserves, ex-
pand the money supply, and reduce interest rates.
The discount rate has become a passive, not active,
tool of monetary policy. The Fed now sets the discount
rate at 1 percentage point above the Fed’s targeted rate of
interest on the overnight loans that commercial banks
make to other commercial banks that need the funds to
meet the required reserve ratio. When the interest rate on
overnight loans rises or falls, the discount rate automatically
rises or falls along with it. We will say more about interest
rate on overnight loans next.
QUICK REVIEW 14.2
• The Fed has three main tools of monetary control, each of
which works by changing the amount of reserves in the
banking system: (a) conducting open-market operations
(the Fed’s buying and selling of government bonds to the banks
and the public); (b) changing the reserve ratio (the percentage
of commercial bank deposit liabilities required as reserves); and
(c) changing the discount rate (the interest rate the Federal
Reserve Banks charge on loans to banks and thrifts).
• Open-market operations are the Fed’s monetary control
mechanism of choice; the Fed rarely changes the reserve
requirement and it now links the discount rate directly to
the interest rate banks pay on overnight loans.
Targeting the Federal
Funds Rate
The Federal Reserve focuses monetary policy on the in-
terest rate that it can best control: the Federal funds rate .
This is the rate of interest that banks charge one another
on overnight loans made from temporary excess reserves.
Recall from Chapter 13 that the Federal Reserve requires
banks (and thrifts) to deposit in the regional Federal
Reserve Bank a certain percentage of their checkable de-
posits as reserves. At the end of any business day, some
banks temporarily have excess reserves (more actual re-
serves than required) and other banks have reserve defi-
ciencies (fewer reserves than required). Because reserves
held at the Federal Reserve Banks do not earn interest,
banks desire to lend out their temporary excess reserves
overnight to other banks that temporarily need them to
meet their reserve requirements. The funds being lent and
borrowed overnight are called “Federal funds” because
they are reserves (funds) that are required by the Federal
Reserve to meet reserve requirements. An equilibrium in-
terest rate—the Federal funds rate—arises in this market
for bank reserves.
Although individual banks can lend excess reserves to
one another, the Federal Reserve is the only supplier of
Federal funds—the currency used by banks as reserves.
The Fed uses its status as a monopoly supplier of reserves
mcc26632_ch14_258-283.indd 267mcc26632_ch14_258-283.indd 267 9/1/06 3:46:36 PM9/1/06 3:46:36 PM
CONFIRMING PAGES
PART FOUR
Money, Banking, and Monetary Policy
268
to target the specific Federal funds rate that it deems ap-
propriate for the economy. The FOMC meets regularly to
choose a desired Federal funds rate. It then directs the Fed-
eral Reserve Bank of New York to undertake open-market
operations to achieve and maintain the targeted rate.
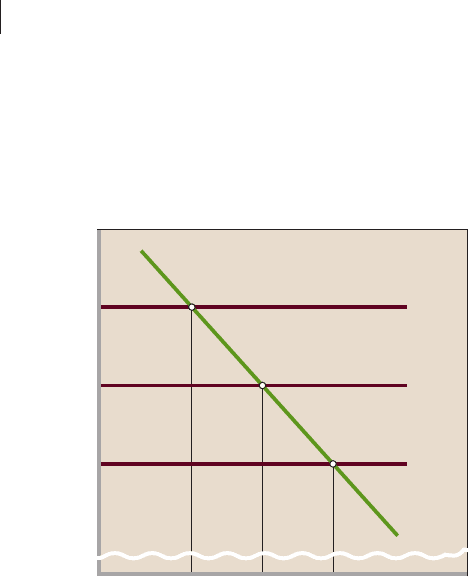
We demonstrate how this works in Figure 14.3 , where
we initially assume the Fed desires a 4 percent interest
rate. The demand curve for Federal funds D
f
is downslop-
ing because lower interest rates give commercial banks a
greater incentive to borrow Federal funds rather than re-
duce loans as a way to meet reserve requirements. The
supply curve for Federal funds, S
f 1
, is somewhat unusual.
Specifically, it is horizontal at the targeted Federal funds
rate, here 4 percent. (Disregard supply curves S
f 2
and S
f 3
for now.) The Fed will use open-market operation to pro-
vide whatever level of Federal funds the banks desire to
hold at the targeted 4 percent interest rate.
In this case, the Fed seeks to achieve an equilibrium
Federal funds rate of 4 percent. In Figure 14.3 it is suc-
cessful. Note that at the 4 percent Federal funds rate, the
quantity of Federal funds supplied ( Q
f 1
) equals the quan-
tity of funds demanded (also Q
f 1
). This 4 percent Federal
funds rate will remain, as long as the supply curve of
Federal funds is horizontal at 4 percent. If the demand for
Federal funds increases ( D
f
shifts to the right along S
f 1
),
the Fed will use its open-market operations to increase the
availability of reserves such that the 4 percent Federal fund
rate is retained. If the demand for Federal funds declines
( D
f
shifts to the left along S
f
1
), the Fed will withdraw
reserves to keep the Federal funds rate at 4 percent.
Expansionary Monetary Policy
Suppose that the economy faces recession and unemploy-
ment. How will the Fed respond? It will initiate an expan-
sionary monetary policy (or “easy money policy”). This
policy will lower the interest rate to bolster borrowing and
spending, which will increase aggregate demand and ex-
pand real output. The Fed’s immediate step will be to an-
nounce a lower target for the Federal funds rate, say
3.5 percent instead of 4 percent. To achieve that lower rate
the Fed will use open-market operations to buy bonds
from banks and the public. We know from previous dis-
cussion that the purchase of bonds increases the reserves
in the banking system. Alternatively, the Fed could expand
reserves by lowering the reserve requirement or lowering
the discount rate to achieve the same result, but we have
seen that the former is rarely used and the latter is not
presently used for active monetary policy.
The greater reserves in the banking system produce
two critical results:
• The supply of Federal funds increases, lowering the
Federal funds rate to the new targeted rate. We
show this in Figure 14.3 as a downward shift to the
horizontal supply curve from S
f 1
to S
f 2
. The
equilibrium Federal funds rate falls to 3.5 percent,
just as the FOMC wanted. The equilibrium quantity
of reserves in the overnight market for reserves rises
from Q
f 1
to Q
f 2
.
• A multiple expansion of the nation’s money supply
occurs (as we demonstrated in Chapter 13). Given the
demand for money, the larger money supply places a
downward pressure on other interest rates.
One such rate is the prime interest rate —the benchmark
interest rate used by banks as a reference point for a wide
range of interest rates charged on loans to businesses and
individuals. The prime interest rate is higher than the
Federal funds rate because the prime rate involves longer,
more risky loans than overnight loans between banks. But
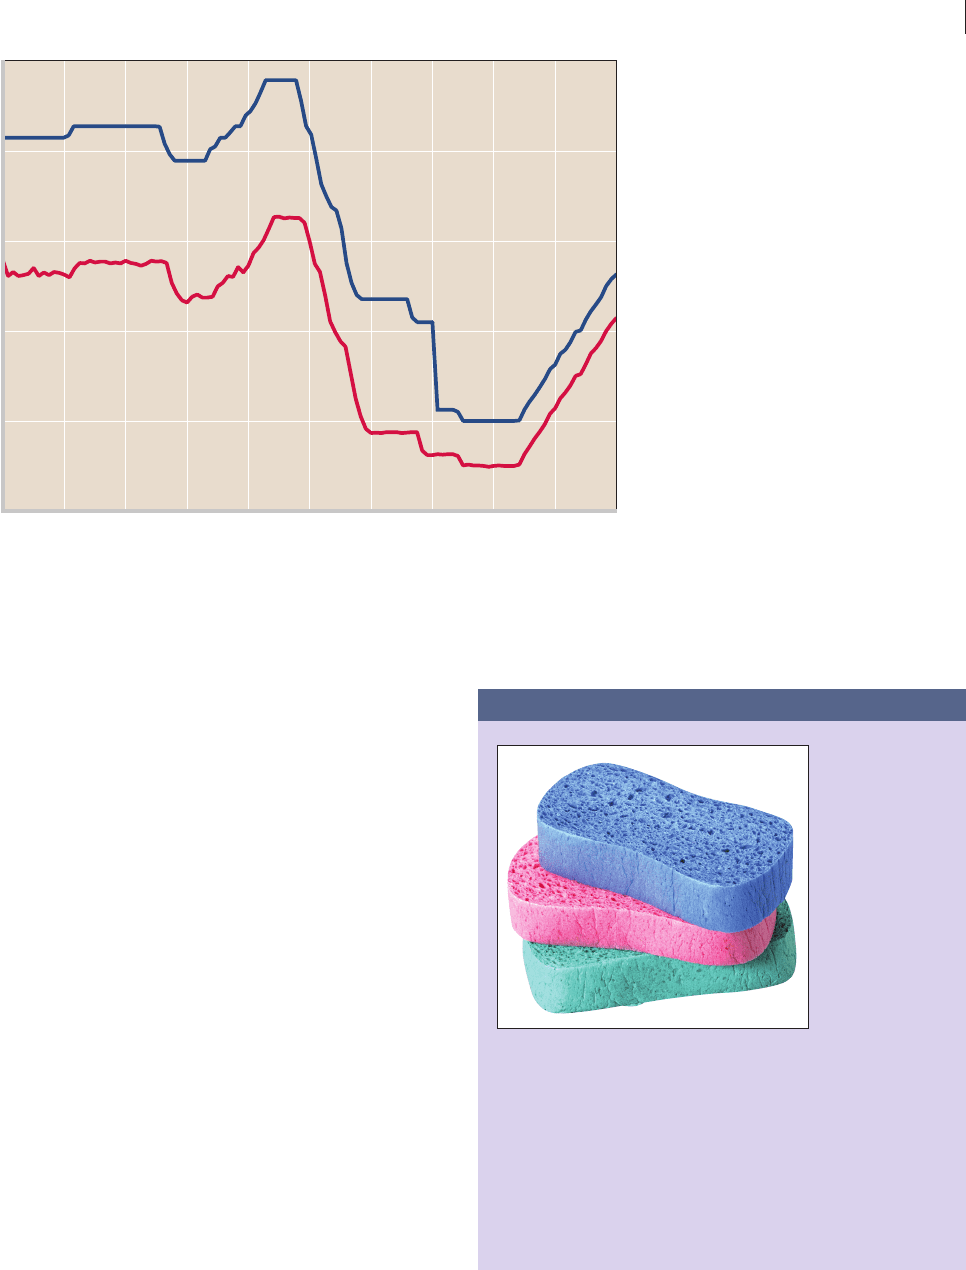
the Federal funds rate and the prime interest rate closely
track one another, as evident in Figure 14.4 .
Restrictive Monetary Policy
The opposite monetary policy is in order for periods of
rising inflation. The Fed will then undertake a restrictive
monetary policy (or “tight money policy”). This policy
will increase the interest rate in order to reduce borrowing
and spending, which will curtail the expansion of aggregate
FIGURE 14.3 Targeting the Federal funds rate In
implementing monetary policy, the Federal Reserve determines a desired
Federal funds rate and then uses open-market operations (buying and selling
of U.S. securities) to add or subtract bank reserves to achieve and maintain
that targeted rate. In an expansionary monetary policy, the Fed increases the
supply of reserves, for example, from S
f1
to S
f2
in this case, to move the
Federal funds rate from 4 percent to 3.5 percent. In a restrictive monetary
policy, it decreases the supply of reserves, say, from S
f1
to S
f3
. Here, the Federal
fund rate rises from 4 percent to 4.5 percent.
0
Federal funds rate
(percent)
Quantity of reserves
S
f1
S
f 2
S
f 3
D
f
4.5
3.5
4.0
Q
f 3
Q
f1
Q
f 2
mcc26632_ch14_258-283.indd 268mcc26632_ch14_258-283.indd 268 9/12/06 7:59:44 PM9/12/06 7:59:44 PM
CONFIRMING PAGES
CHAPTER 14
Interest Rates and Monetary Policy
269
demand and hold down price-level increases. The Fed’s
immediate step will be to announce a higher target for the
Federal funds rate, say 4.5 percent instead of 4 percent.
Through open-market operations, the Fed will sell bonds
to the banks and the public and the sale of those bonds will
absorb reserves in the banking system. Alternatively, the
Fed could absorb reserves by raising the reserve require-
ment or raising the discount rate to achieve the same re-
sult, but we have seen that the former is rarely used and the
latter is not presently used for active monetary policy.
The smaller reserves in the banking system produce
two results opposite those discussed for an expansionary
monetary policy:
• The supply of Federal funds decreases, raising the
Federal funds rate to the new targeted rate. We show
this in Figure 14.3 as an upward shift of the horizonal
supply curve from S
f 1
to S
f 3
. The equilibrium Federal
funds rate rises to 4.5 percent, just as the FOMC
wanted, and the equilibrium quantity of funds in this
market falls to Q
f 3
.
• A multiple contraction of the nation’s money supply
occurs (as demonstrated in Chapter 13). Given the
demand for money, the smaller money supply places an
upward pressure on other interest rates. For example,
the prime interest rate rises.
0
2
4
8
6
1999 2000 2001 2002 2003 2005 20062004199819971996
Percent
Year
Prime interest rate
Federal funds rate
10
FIGURE 14.4 The prime interest rate
and the Federal funds rate in the
United States, 1996–2006. The prime
interest rate rises and falls with changes in the Federal
funds rate.
Source: Federal Reserve data, www.federalreserve.gov/.
CONSIDER THIS . . .
The Fed as
a Sponge
A good way to
remem ber the
role of the Fed in
setting the Fed-
eral funds rate
might be to imag-
ine a bowl of
water, with the
amount of water
in the bowl rep-
resenting the
stock of reserves in the banking system. Then think of the FOMC
as having a large sponge, labeled open-market operations. When
it wants to decrease the Federal funds rate, it uses the sponge—
soaked with water (reserves) created by the Fed—to squeeze
new reserves into the banking system bowl. It continues this pro-
cess until the higher supply of reserves reduces the Federal funds
rate to the Fed’s desired level. If the Fed wants to increase the
Federal funds rate, it uses the sponge to absorb reserves from
the bowl (banking system). As the supply of reserves falls, the
Federal funds rate rises to the Fed’s desired level.
mcc26632_ch14_258-283.indd 269mcc26632_ch14_258-283.indd 269 9/11/06 10:12:50 PM9/11/06 10:12:50 PM
CONFIRMING PAGES
270
270
The Taylor Rule
The proper Federal funds rate for a certain period is a
matter of policy discretion by the members of the
FOMC. The FOMC does not adhere to a strict infla-
tionary target or monetary policy rule. It targets the
Federal funds rate at the level it thinks is appropriate for
the underlying economic conditions. Nevertheless, the
Fed appears to roughly follow a rule first established
by economist John Taylor of Stanford. The Taylor rule
assumes a 2 percent target rate of inflation and has three
parts:
• If real GDP rises by 1 percent above potential GDP,
the Fed should raise the Federal funds rate
by
1
_
2
a percentage point.
• If inflation rises by 1 percentage point above its
key
graph
0
Real rate of interest, i
(percent)
Amount of money
demanded and supplied
(billions of dollars)
(a)
The market for mone
y
S
m1
S
m2
S
m3
D
m
10
6
8
$125 $150 $175
0
Real rate of interest, i
and expected rate of
return (percent)
Amount of investment, I
(billions of dollars)
(b)
Investment demand
10
6
8
$15 $20 $25
Investment
demand
ID
QUICK QUIZ 14.5
1. The ultimate objective of an expansionary monetary policy is
depicted by:
a. a decrease in the money supply from S
m3
to S
m2
.
b. a reduction of the interest rate from 8 to 6 percent.
c. an increase in investment from $20 billion to $25 billion.
d. an increase in real GDP from Q
1
to Q
f
.
2. A successful restrictive monetary policy is evidenced by a shift in
the money supply curve from:
a. S
m3
to S
m2
, an increase in investment from $20 billion to
$25 billion, and a decline in aggregate demand from AD
3
to
AD
2
.
b. S
m1
to S
m2,
an increase in investment from $20 billion to $25
billion, and an increase in real GDP from
Q
1
to Q
f.
c. S
m3
to S
m2,
a decrease in investment from $25 billion to $20
billion, and a decline in the price level from P
3
to P
2
.
target of 2 percent, then the Fed should raise the
Federal funds rate by
1
_
2
a percentage point.
• When real GDP is equal to potential GDP and
inflation is equal to its target rate of 2 percent, the
Federal funds rate should remain at about 4 percent,
which would imply a real interest rate of 2 percent.
These rules are reversible for situations in which the real
GDP falls below potential GDP and the rate of inflation
falls below 2 percent. But it is crucial to
point out that the Fed has shown a clear
willingness to diverge from the Taylor rule
under some circumstances. One such occa-
sion occurred when the slow recovery from
the 2001 recession raised concerns about
potential deflation.
W 14.4
Taylor rule
mcc26632_ch14_258-283.indd 270mcc26632_ch14_258-283.indd 270 9/1/06 3:46:37 PM9/1/06 3:46:37 PM
CONFIRMING PAGES
CHAPTER 14
Interest Rates and Monetary Policy
271
271
Answers:1. d; 2. c; 3. c; 4. a
QUICK REVIEW 14.3
• The Fed conducts its monetary policy by establishing a
targeted Federal funds interest rate—the rate that
commercial banks charge one another for overnight loans
of reserves.
• An expansionary monetary policy (loose money policy)
lowers the Federal funds rate, increases the money supply,
and lowers other interest rates.
• A restrictive monetary policy (tight money policy) increases
the Federal funds rate, reduces the money supply, and
increases other interest rates.
• The Fed uses it discretion in establishing Federal
funds rates, but it generally appears to be guided by the
Taylor rule.
0
Price level
Real domestic product, GDP
(billions of dollars)
(c)
Equilibrium real
GDP and the price
level
P
3
P
2
Q
1
Q
3
Q
f
AS
AD
2
(I = $20)
AD
3
(I = $25)
AD
1
(I = $15)
d. S
m3
to S
m2,
a decrease in investment from $25 billion to $20
billion, and an increase in aggregate demand from AD
2
to
AD
3
.
3. The Federal Reserve could increase the money supply from
S
m1
to S
m2
by:
a. increasing the discount rate.
b. reducing taxes.
c. buying government securities in the open market.
d. increasing the reserve requirement.
4. If the spending-income multiplier is 4 in the economy depicted,
an increase in the money supply from $125 billion to $150
billion will:
a. shift the aggregate demand curve rightward by $20 billion.
b. increase real GDP by $25 billion.
c. increase real GDP by $100 billion.
d. shift the aggregate demand curve leftward by $5 billion.
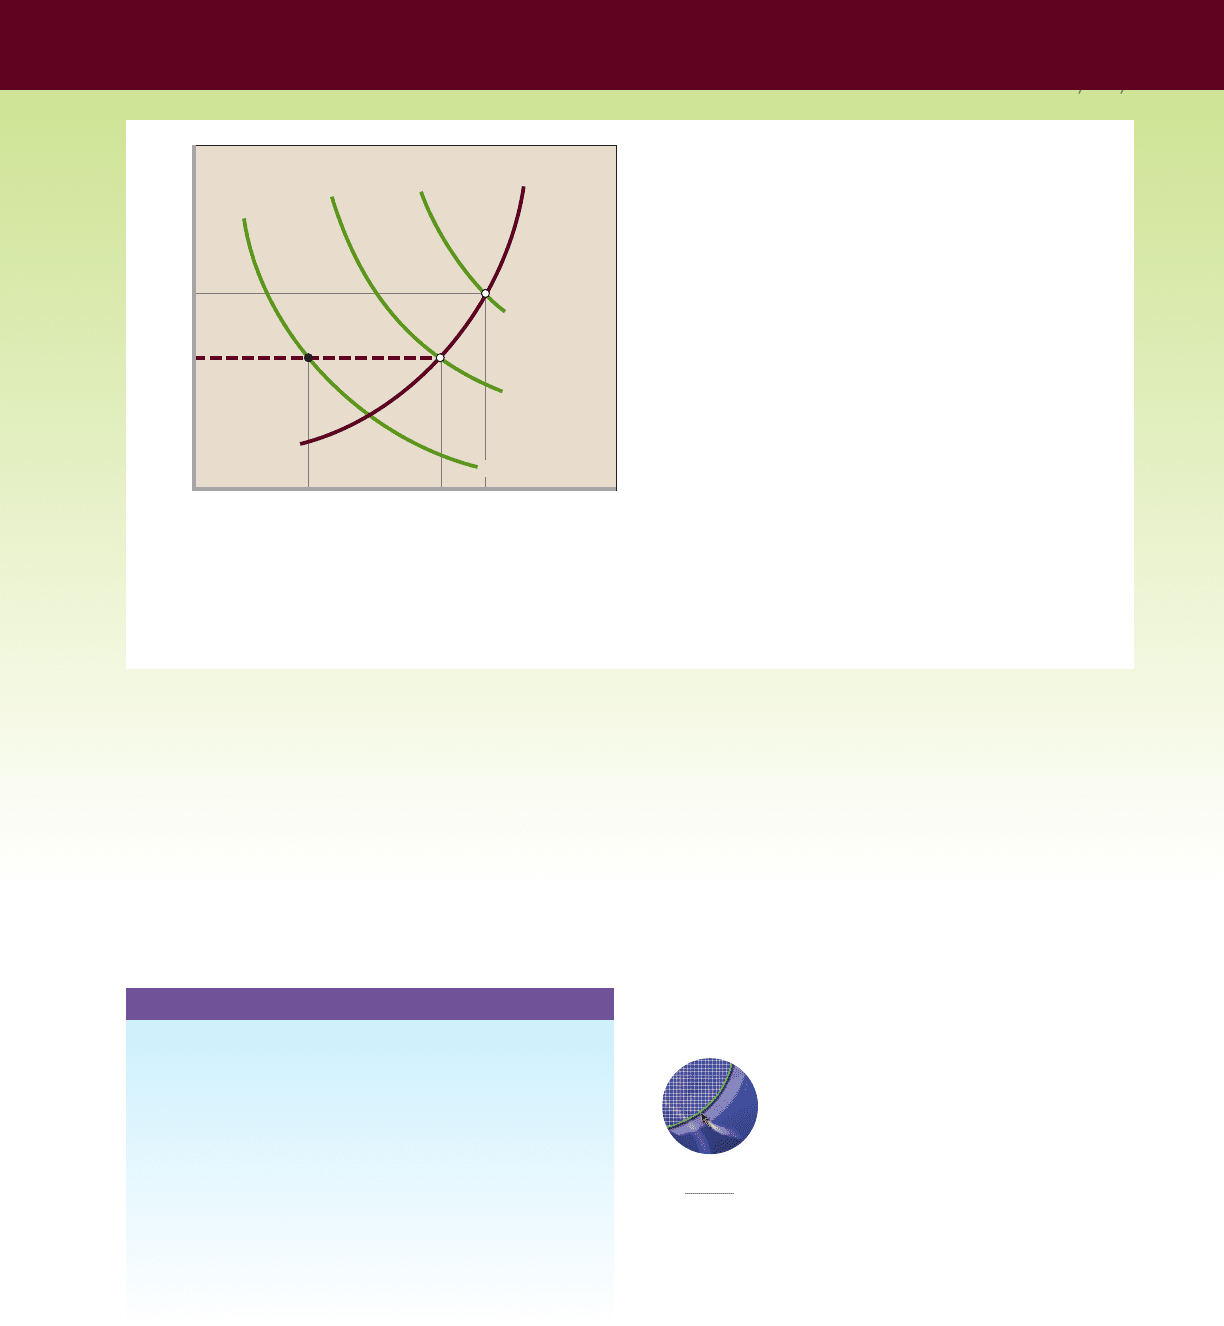
FIGURE 14.5 Monetary policy and equilibrium GDP. An
expansionary monetary policy that shifts the money supply curve rightward from
S
m1
to S
m2
lowers the interest rate from 10 to 8 percent. As a result, investment
spending increases from $15 billion to $20 billion, shifting the aggregate demand
curve rightward from AD
1
to AD
2
, and real output rises from the recessionary
level Q
1
to the full-employment level Q
f
. A restrictive monetary policy that shifts
the money supply curve leftward from S
m3
to S
m2
increases the interest rate from
6 to 8 percent. Investment spending thus falls from $25 billion to $20 billion, and
the aggregate demand curve shifts leftward from AD
3
to AD
2
, curtailing inflation.
Monetary Policy, Real GDP, and
the Price Level
We have identified and explained the tools
of expansionary and contractionary mone-
tary policy. We now want to emphasize
how monetary policy affects the economy’s
levels of investment, aggregate demand,
real GDP, and prices.
Cause-Effect Chain
The three diagrams in Figure 14.5 (Key Graph) will help
you understand how monetary policy works toward
achieving its goals.
G 14.2
Monetary policy
mcc26632_ch14_258-283.indd 271mcc26632_ch14_258-283.indd 271 9/1/06 3:46:38 PM9/1/06 3:46:38 PM
CONFIRMING PAGES

PART FOUR
Money, Banking, and Monetary Policy
272
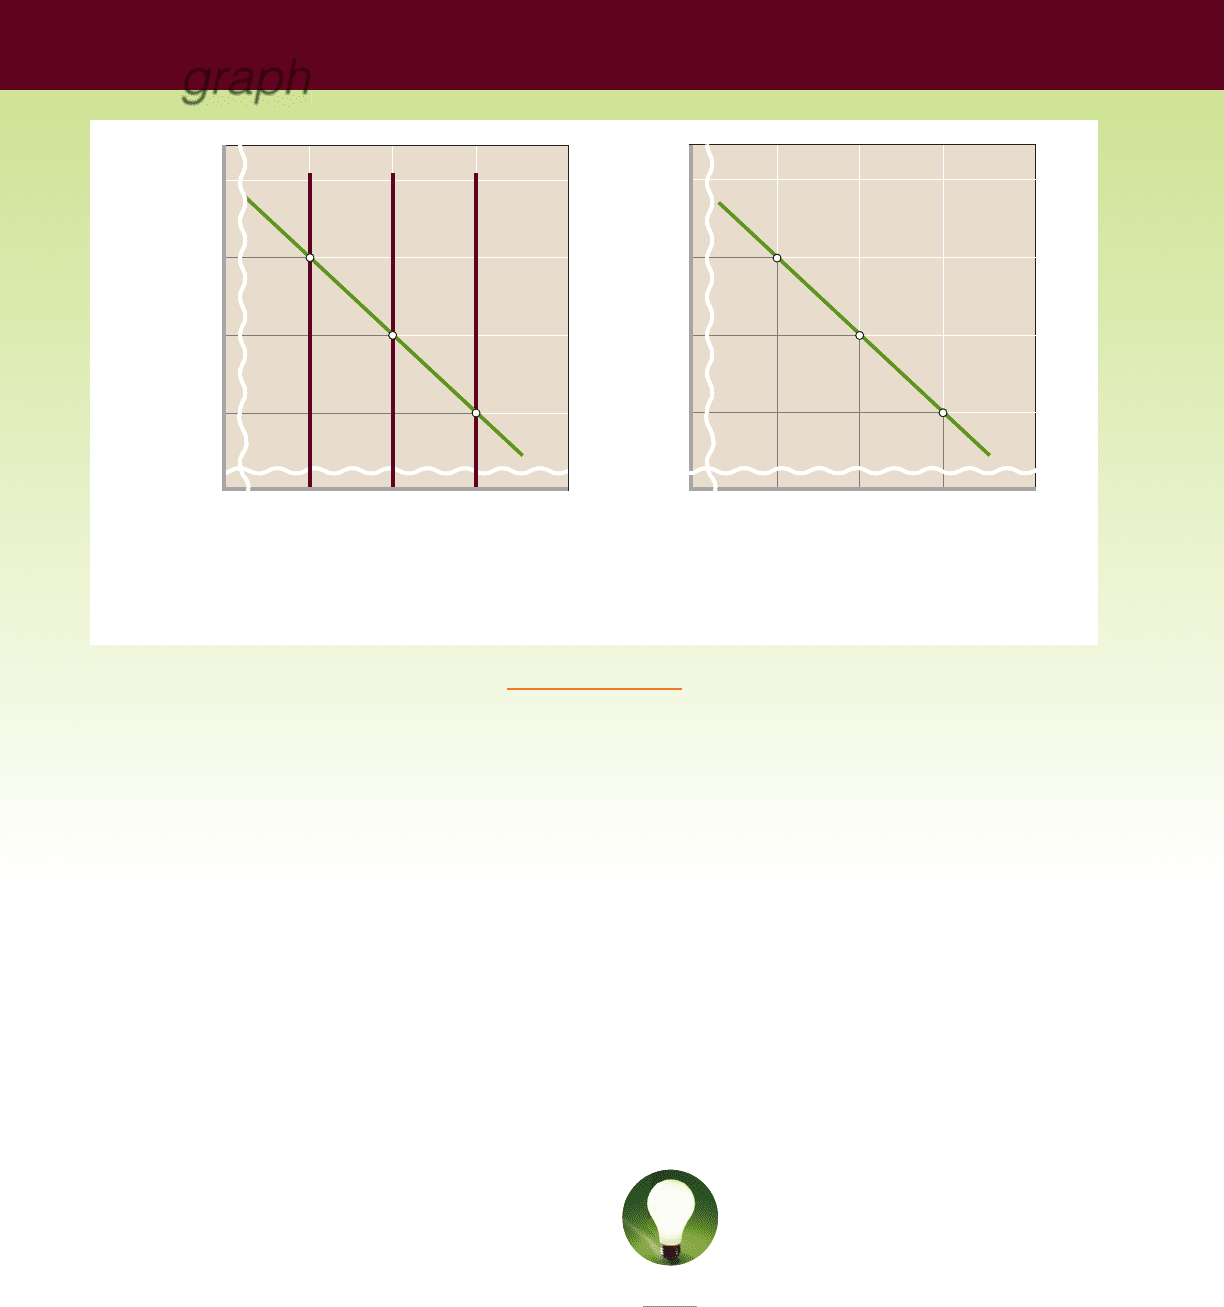
Market for Money Figure 14.5 a represents the
market for money, in which the demand curve for money
and the supply curve of money are brought together.
Recall that the total demand for money is made up of the
transactions and asset demands.
This figure also shows three potential money supply
curves, S
m 1 ,
S
m 2 ,
and S
m 3
. In each case the money supply is
shown as a vertical line representing some fixed amount of
money determined by the Fed. While monetary policy
(specifically, the supply of money) helps determine the
interest rate, the interest rate does not determine the
location of the money supply curve.
The equilibrium interest rate is the rate at which the
amount of money demanded and the amount supplied
are equal. With money demand D
m
in Figure 14.5 a, if
the supply of money is $125 billion ( S
m 1
), the equilib-
rium interest rate is 10 percent. With a money supply of
$150 billion ( S
m 2
), the equilibrium interest rate is 8 per-
cent; with a money supply of $175 billion ( S
m 3
), it is
6 percent.
You know from Chapter 8 that the real, not the
nominal, rate of interest is critical for investment decisions.
So here we assume that Figure 14.5 a portrays real interest
rates.
Investment These 10, 8, and 6 percent real interest
rates are carried rightward to the investment demand
curve in Figure 14.5 b. This curve shows the inverse rela-
tionship between the interest rate—the cost of borrowing
to invest—and the amount of investment spending. At the
10 percent interest rate it will be profitable for the nation’s
businesses to invest $15 billion; at 8 percent, $20 billion;
at 6 percent, $25 billion.
Changes in the interest rate mainly affect the invest-
ment component of total spending, although they also
affect spending on durable consumer goods (such as au-
tos) that are purchased on credit. The impact of chang-
ing interest rates on investment spending is great because
of the large cost and long-term nature of capital pur-
chases. Capital equipment, factory buildings, and ware-
houses are tremendously expensive. In absolute terms,
interest charges on funds borrowed for these purchases
are considerable.
Similarly, the interest cost on a house purchased on a
long-term contract is very large: A
1
2
- percentage-point
change in the interest rate could amount to thousands of
dollars in the total cost of a home.
In brief, the impact of changing interest rates is mainly
on investment (and, through that, on aggregate demand,
output, employment, and the price level). Moreover, as
Figure 14.5 b shows, investment spending varies inversely
with the real interest rate.
Equilibrium GDP Figure 14.5 c shows the impact
of our three real interest rates and corresponding levels
of investment spending on aggregate demand. As noted,
aggregate demand curve AD
1
is associated with the
$15 billion level of investment, AD
2
with investment of
$20 billion, and AD
3
with investment of $25 billion. That
is, investment spending is one of the determinants of ag-
gregate demand. Other things equal, the greater the in-
vestment spending, the farther to the right lies the
aggregate demand curve.
Suppose the money supply in Figure 14.5 a is $150 bil-
lion ( S
m 2
), producing an equilibrium interest rate of
8 percent. In Figure 14.5 b we see that this 8 percent in-
terest rate will bring forth $20 billion of investment
spending. This $20 billion of investment spending joins
with consumption spending, net exports, and government
spending to yield aggregate demand curve AD
2
in Figure
14.5 c. The equilibrium levels of real output and prices
are Q
f
and P
2
, as determined by the intersection of AD
2
and the aggregate supply curve AS.
To test your understanding of these relationships,
explain why each of the other two levels of money sup -
ply in Figure 14.5 a results in a different interest rate, level
of investment, aggregate demand curve, and equilibrium
real output.
Effects of an Expansionary
Monetary Policy
Next, suppose that the money supply is $125 billion ( S
m 1
)
in Figure 14.5 a. Because the resulting real output Q
1
in
Figure 14.5 c is far below the full-employment output, Q
f
,
the economy must be experiencing recession, a negative
GDP gap, and substantial unemployment. The Fed there-
fore should institute an expansionary monetary policy.
To increase the money supply, the Federal Reserve
Banks will take some combination of the following actions:
(1) Buy government securities from banks and the public
in the open market, (2) lower the legal reserve ratio, and
(3) lower the discount rate. The intended outcome will be
an increase in excess reserves in the commercial banking
system and a decline in the Federal funds rate. Because
excess reserves are the basis on which commercial banks
and thrifts can earn profit by lending and thus creating
checkable-deposit money, the nation’s money supply will
rise. An increase in the money supply will lower the
interest rate, increasing investment, aggregate demand,
and equilibrium GDP.
mcc26632_ch14_258-283.indd 272mcc26632_ch14_258-283.indd 272 9/1/06 3:46:39 PM9/1/06 3:46:39 PM
CONFIRMING PAGES
