Marulanda J.M. (ed.) Electronic Properties of Carbon Nanotubes
Подождите немного. Документ загружается.

Detection of Carbon Nanotubes Using Tip-Enhanced Raman Spectroscopy
215
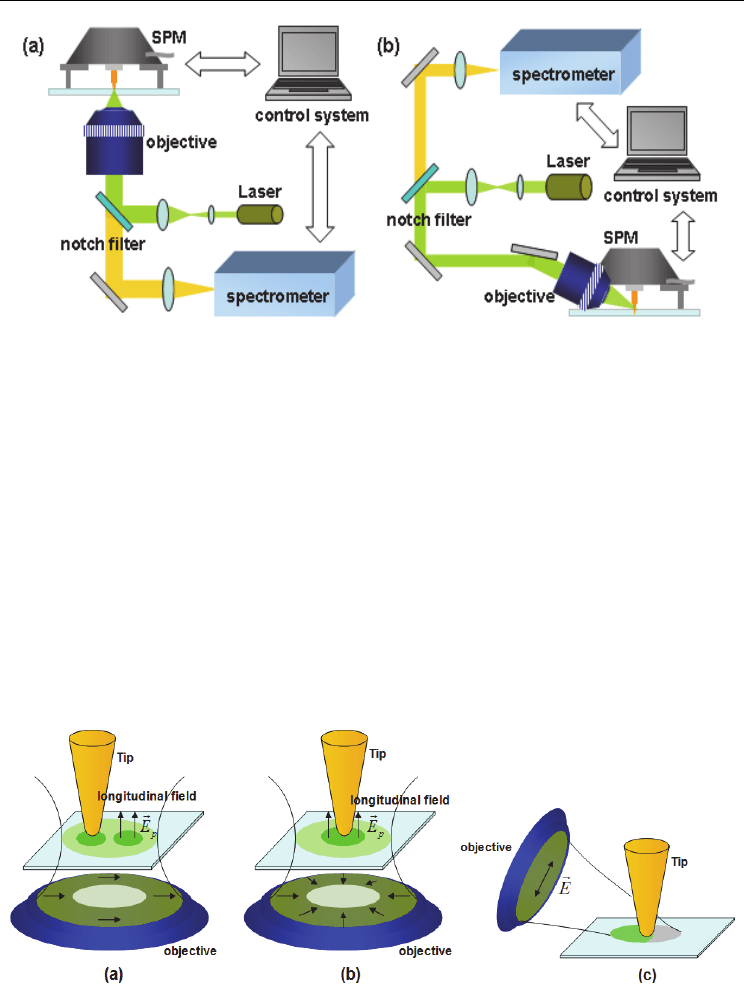
Fig. 2. Schematic diagrams of TERS systems in transmission mode (a) and in reflection
mode (b).
2.2.1 Illumination/collection configurations
According to the illumination/collection configurations, TERS systems can be divided into
transmission-mode ones and reflection-mode ones.
Considering the structural and spatial constrains, the illumination and collection
configurations often shares the same one-objective-lens-based optical path. The
configuration of the transmission-mode TERS system usually employs an inverted
microscope. The incident laser is tightly focused with a high numerical aperture (N.A.)
objective on the tip apex and the backward-scattered tip-enhanced Raman scattering signal
is collected with the same objective. The transmission-mode TERS is of ability to reduce the
far-field background signal with a high N.A. objective and the SNR is considerably
improved and the system construction is relatively simple. Nevertheless, the applicability of
transmission-mode TERS is restricted. It can only be suitable to detect transparent or
sparsely distributed specimens.
Fig. 3. Schematic diagrams of tip-enhanced Raman spectroscopy using (a) linearly polarized
light (or beam) annular illumination; (b) radially polarized annular illumination; (c) linearly
polarized side illumination.

Electronic Properties of Carbon Nanotubes
216
The reflection-mode TERS systems are suitable for detecting any specimens regardless of the
transparency. This kind of systems often utilizes a side-illumination/collection
configuration (Fig. 3(c)). The incident light pass through a long working distance objective
located at the side of the SPM scanning head and is focused on the tip apex. In this
configuration, only the long working distance objective with lower N.A. (NA0.6) can be
used. The not-so-tightly focused laser oblique incident on the specimen surface and
illuminate a relatively large elliptical area. The undesirable increased illuminated area leads
to stronger far-field background noise. Therefore, the side-illumination reflection-mode
TERS suffers from the lower SNR and signal collection efficiency.
One of illumination problems is how to generate the strongest longitudinal electric
components to excite the most efficiently the field enhancement close to the tip. One of the
solutions is to choose appropriate polarization light as the exciting beam (Hayazawa et al.,
2004; Saito et al., 2005; Anderson et al., 2006). The possible choices include linear
polarization, circular polarization, radial polarization and azimuthal polarization light. It
will be discussed in detail in the following section.
2.2.2 Distance control and topography measurement
Intend to enhance the localized Raman signal and obtain high resolution near-field optical
information, a sharp metallic tip is precisely located in the near-field region of the sample
under test and controlled at a certain few nanometers’ distance from the sample surface.
Generally, the distance is maintained within 10 nm. In TERS system, the SPM technology is
employed to control the tip-specimen separation. During the scanning detection, the constant
separation is maintained by the feedback control from SPM. Furthermore, the height of the
specimen surface is measured and consequently the topography data can be obtained.
Generally, there are three types of SPMs often used as components to build up TERS
systems: scanning tunneling microscope (STM), atomic force microscope (AFM), and shear-
force microscope (SFM).
2.3 Key technology in TERS system
Typical TERS system combines the SPM, illumination/collection optics, Raman
spectroscope with other mechanical, optical and electronic devices. There are certain key
technologies involved in this integrated detection system, including the fabrication of TERS
tips, selection of SPM, dual scanner/dual closed-loop controller, illumination with radially
polarized beam, illumination/collection configuration based on parabolic mirror,
characterizing optical properties of the tips with white light, and substrates.
2.3.1 Fabrication of TERS tips
It is indubitable that the tip is the most crucial element in TERS deciding both spatial
resolution and Raman enhancement efficiency.
The most suitable metal materials for tip are silver and gold, which are proven theoretically
and experimentally for TERS systems. They both can provide most effective tip-
enhancement under visible light illumination. Silver is capable of providing stronger
enhancement, because its imaginary part of permittivity is smaller (Johnson & Christy,
1972). However, since the Ag tips are rapidly oxidized in air, they need to be protected
properly and used timely. On the other hand, gold tips are chemically inert against oxygen
and stable against radicals.

Detection of Carbon Nanotubes Using Tip-Enhanced Raman Spectroscopy
217
The fabrication of metal-coated AFM tips used in TERS system (AFM-TERS tips) is often
based on the commercial Si or Si3N4 AFM tips. And the physical coating method
(evaporation, deposition, or sputtering) is utilized to metallize the AFM tip. It is need to
note that the stress of the metal coating might bring in the warping problem of the AFM
cantilever and affect the performance of the tip. Typically, the TERS tips acquired via this
method are unlikely to provide significant enhancement and are frequently being scraped
during scanning (Kharintsev et al., 2007).
The coating of the AFM tip can also be realized via chemical approach such as silver mirror
reaction (Saito et al., 2002; J. J. Wang et al., 2005). However, the reactants may contaminate
the cantilever and worse, yet still attach to the tip apex. Another issue concerning AFM-
TERS tips is that the Raman signal of the inner material of the TERS tips (Si or Si3N4) is also
being enhanced and exists as the noise. Especially in the research on semi-conductor
materials, this issue should be pay closer attention to (Lee et al., 2007).
The preparation of STM-TERS tips is comparatively mature. The tips are fabricated from
high purity single-crystal gold (Ren et al., 2004) or silver wires. The metal wires are shaped
with electrochemistry etching. This method is capable of providing gold STM-TERS tips
with effective enhancement and small tip apex size. And the success rate (tolerant) is high.
However, it is not so good to fabricate silver wire tip (Pettinger et al., 2002).
The preparation method of SFM-TERS tips is more flexible. Addition to the previously
mentioned etched gold tips (Hartschuh & Novotny, 2002), the etched tungsten tips with
gold or silver coating (Sun & Shen, 2001), are also suitable to the SFM in TERS system. In
recent years, the method demonstrates obvious advantage of attaching gold or silver nano-
particles to the apex of the fiber probe (Kalkbrenner et al., 2001). By optionally selecting the
size of the nano-particles, the optical property of the TERS tip can be designed to obtain
strong Raman enhancement. In addition, since the refractive index of fiber is lower, far-field
Raman scattering enhanced causes by the body of the tip can be effectively suppressed.
In addition to these mentioned methods above, in order to achieve precise control of the size
and structure of the tip for improving the enhancement efficiency, focused ion beam etching
(FIB) has been used to produce TERS tip (Frey et al., 2002). But since the FIB processing is
complex and costly, it has not being widely used.
2.3.2 Selection of SPM
As shown in Fig.4, STM, AFM, and SFM are the three types of SPMs commonly used as
components to build up TERS systems. They have different feedback mechanisms and
respective technique features. Although, they are all able to regulate effectively the tip-
specimen separation and obtain the topography. The TERS systems based on the different
types are of the different technical properties. Therefore, the TERS systems based on
appropriate SPM components can be selected in dependence to the sample and
experimental condition. The performance properties of the STM, AFM, or SFM in TERS
systems are list in Table 1.
2.3.3 Dual scanner/ dual closed-loop controller
Different from common SPMs, our homemade TERS system has a configuration of dual-
scanner/dual closed-loop controller in which the two scanners and two closed-loop
controllers are able to work independently.

Electronic Properties of Carbon Nanotubes
218
Fig. 4. The SPM equipment for TERS: (a) Atom force microscope; (b) Shear-force microscope;
and (c) Scanning tunnel microscope. (R. Wang, 2010c)
SPM Feedback
types
Advantages Disadvantages
AFM Optical lever
feedback
1) without limit to sample types
and environment;
2) easy to operate, convenient to be
combined with other AFM
imaging methods;
3) able to study pressure-induced
spectral changes by tip (Watanabe
et al.,2004; Saito et al.,2008).
1) easy to damage metallic
coating of tip;
2) low-enhancement
factor;
3) stray light from optical
lever interferes spectral
measurement.
SFM Tuning
fork/Shear
force
feedback
1) without limit to sample types
and environment, little damage on
samples, especially for biological
sample in liquid;
2) easy to fabricate tip;
3) convenient to be combined with
inverted and upright microscope
respectively.
1) complicated operation;
2) poor lateral resolution.
STM Tunneling
current
feedback
1) high spatial resolution and high
control precision;
2) working in gap mode with high
detection sensitivity and high-
resolution spectral imaging;
3) mature fabricating technique to
produce tips.
1) only conducting
samples or ultra-thin
samples distributed on
conducting substrate;
2) mostly working in
reflection mode due to
opacity of sample or
substrate.
3) surface undulation of
sample no more than a
few hundred nanometers
usually
Table 1. Comparisons of TERS systems based on AFM, SFM and STM

Detection of Carbon Nanotubes Using Tip-Enhanced Raman Spectroscopy
219
2.3.3.1 Dual scanner
The scanning types of SPM can be divided into two types, sample stage scanning and tip
head scanning. For the former type SPM, a scanning stage on which the sample is attached
to is driven by the scanner and moves in a raster pattern below the tip. The tip only moves
along its axis to adjust the tip-specimen separation. For latter type SPM, the tip is always
amounted on a 3-D movable scanning head, and the sample is kept still. The progressive
scanning and the tip-specimen separation are both controlled by the tip scanning controller.
Conventional SPM usually works with one controller in one particular mode. However,
SNOM and TERS systems work more complexly than the conventional ones. For SNOM or
TERS detection, it needs to appropriately couple the incident light beam to illuminate and
excite the sample in a certain condition\manner, which may relate to wavelength, incident
angle, focused beam, specific polarization. Additionally, appropriate optical configuration
for collecting the scattering, transmission, or reflection light in 3-D space or a specific
direction is also required.
However, it is difficult to meet various kinds of detection demands to the diversity of
specimens with single scanning type systems. For example, if the CNTs specimen is put on
the sample stage, and the optical axis of the illumination configuration is coaxial with the tip
axis, stage scanning mode is then appropriate for the optical alignment principle. But in
other conditions the tip scanning is requested, such as detecting the SPP waveguide which
needs to be precisely coupled with external fixed optical path for excitation and collection.
Although the tip might be possible to slightly deviate from the optical axis during the
scanning, the impact of the nanometer deviation can be negligible.
Therefore, it is preferable to employ the dual-scanner configuration which can provide the
sample stage scanning and the tip head scanning in TERS system respectively. Its
advantages include more precise control, arbitrarily choosing sample, and scanning mode to
any different requirements of sample detection, illumination alignment, or optical coupling
mode. It is convenient to tip-illumination alignment and ensures the optimal detection
results.
The common requirements to the dual-scanner configuration:
a. Accurate, real-time, and closed-loop measuring/ to control the tip-sample separation;
b. Precise alignment of the tip apex with the excitation focus;
c. Nanometer accuracy, high repeatability, point-by-point scanning in raster mode over
the whole detected region to obtain the sample information.
2.3.3.2 Dual closed-loop controller
In order to ensure two independent scanners to work with high-precision positioning and
high repeatability two independent closed-loop controllers should be equipped in a TERS
system. Nanometer accurate positioning and scanning are usually realized with a
piezoelectric actuator. The measuring time for TERS is usually much longer than SNOM
imaging and in result the higher stability and repeatability are required in the TERS
system.
Firstly, the piezoelectric scanner might drift a certain distance with ambient temperature
fluctuation. Thus, the real-time closed-loop control is required to correct and eliminate the
impact of drifting, and improve the accuracy and repeatability. It is of significant
importance to collecting, processing, and analyzing the Raman information and the
topography data correspondingly.

Electronic Properties of Carbon Nanotubes
220
Another important issue to be considered is that the certain integration time is needed to
each detected point to acquire Raman spectrum data in TERS detection. Since the Raman
signal is extremely weak, even with the highest sensitivity spectral detector, it still needs to
spend certain integration time. Meanwhile, the location and the topography data at the
point are recorded. It is distinct from the regular SPMs scanning point-by-point and line-by-
line with relative high frequency, the scanning speed of TERS detection is rather slow or
even stops at each detected point. It is evident that to measure the topography and point-by-
point spectra with TERS requires much longer detection time than the regular SPMs.
Therefore, TERS system demands the higher stability and repeatability which facilitate the
tip and sample maintaining the relative position during the detection process.
Popular commercial SPM systems are usually only equipped with a 3-D controller. At the
mean time, it is capable of closed-loop to control only one of the two scanners, either the
scanner of the tip or the scanner of the sample stage. But the other not-under-controlled
scanners may drift or disturbed by the external environmental perturbations such as the
mechanical vibration. These all lead to the spatial mismatch of the detected spectral data
and morphology data or even drive the tip out of the detected region. It seriously affects the
results of experiments and the corresponding identification upon the Raman mapping and
the relative topography data.
Therefore, two independent controllers should be used to realize the closed-loop control of
the tip scanning head and the sample stage scanning precisely and respectively in TERS
systems. Under closed-loop control, the 3-D scanning and positioning with high accuracy
and repeatability can be realized by the two scanners respectively, and the internal drift of
the scanner and the external perturbations of the environment can be effectively reduced. It
ensures the spectral detection, topography detection, and the spatial corresponding data
collection of the Raman spectra and the topography of the CNTs and other specimens. It is
quite benefit for the corresponding analysis of the TERS result to recognize and identify the
molecular structure, chemical information and characteristics of the sample.
2.3.4 Illumination with radially polarized beam
As mentioned above, in the lighting-rod effect, as the incident optical beam with the electric
component parallel to the tip axis illuminates on the tip, the charge is driven to the foremost
of the tip and forms a large surface charge accumulation at the tip apex. It means that the
efficient enhancement of the local electric field at the tip apex will arise with illumination by
the longitudinal E-component or incident polarization parallel to the tip axis (Novotny et al.,
1997). While the polarization of the incident beam is perpendicular to the tip axis, the tip
apex remains uncharged. So it does not actively contribute to the local field enhancement ,
also it may bring in the background noise.
Therefore, in order to obtain effective enhancement, it is crucial to form a longitudinal
(parallel to the tip axis) E-component to efficiently arise the lighting-rod effect at the tip
apex. The E-field distribution at the focus is determined by both the incident beam
polarization and the optical configuration. It is crucial to make them to match to each other
in the experimental setup.
How to generate experimentally a longitudinal E-component parallel to the tip axis?
In side-illumination situation, a linear polarization beam in TM mode illuminates the
sample in a large incident angle. The most of the E-component of the incident optical field
can be oriented parallel to the tip axis. And the strong longitudinal field excites effectively
the strong field enhancement based on the lighting-rod effect.
Detection of Carbon Nanotubes Using Tip-Enhanced Raman Spectroscopy
221
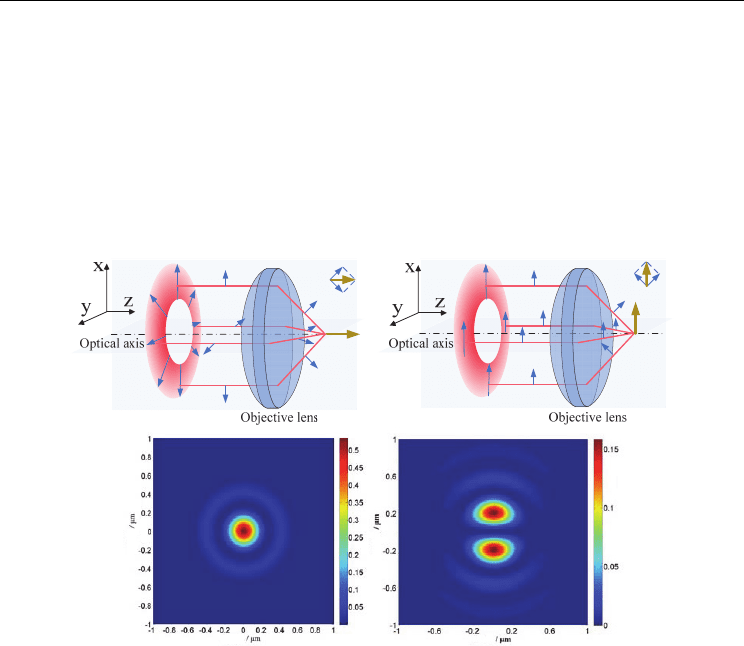
In transmission-mode TERS systems, the incident beam is focused with high N.A. objective
lens from the bottom to the tip apex as shown in Fig.3 (a) and (b). As the beam is linearly
polarized (e.g. along x-axis), the distribution of the longitudinal field presents as two
symmetric side lobes while the center is almost zero at the focus is shown in Fig.5(b). The
reason is that the phase of the longitudinal E-component is out in the focus. If the tip is
positioned at the center, the near-field enhancement is inefficient and the far-field noise is
introduced by the transverse field illumination. To improve the enhancement and decrease
the background noise, the tip has to be adjusted to either of the side lobes in the side of the
focal center.
(a) (b)
Fig. 5. Longitudinal field distributions at the focuses of radial polarization (a) and linear
polarization (b) beam focused by high N.A. objective.
Fortunately, a doughnut radially polarized incident beam focused by high N.A. objective is
found to be more suitable in this kind of configurations. The first reason is that the
longitudinal E-component is in-phase and causes enhancement at the focus as shown in
Fig.5 (a). The second reason is that the symmetry of the doughnut radial polarization beam
is more suitable to the axial or cylindrical symmetric optical system. No matter where one
looks at, in any cross-section in the optical axis the field distribution is quite symmetric. The
E-vector vibration directions of the radially symmetric rays are pointed against to each
other. As focused by an objective at the focus with symmetrical incident angle, their E-vector
vibration direction is in-phase in the longitudinal orientation and constructive interference.
Especially when the radially polarized beam is tightly focused by a high N.A. objective, the
stronger longitudinal field expected theoretically is effectively formed at the focus, Fig. 5(b).
Therefore, the local enhancement can be actively excited by the longitudinal field as the tip
entering the focus. Additionally, with radially polarized illumination, the longitudinal field
area just locates at the center of the focus. It facilitates more convenient realization of
optimal tip-longitudinal field alignment , coupling, efficient signal excitation and collection.
Electronic Properties of Carbon Nanotubes
222
2.3.5 Illumination/collection configuration based on parabolic mirror
One of the significant advantages of reflection-mode TERS systems is that the detectable
sample is not restricted no matter to transparency or opaque sample. This not only expands
measuring range of specimens, but also allows more flexibility to the choice of substrates.
The appropriate substrate can further promote the enhancement or reduce the background
noise in TERS. But with side-illumination/collection configuration, only a long working
distance objective with comparative low N.A. (typically smaller than 0.6) can be utilized.
This results a strong far-field background noise and low collection efficiency.
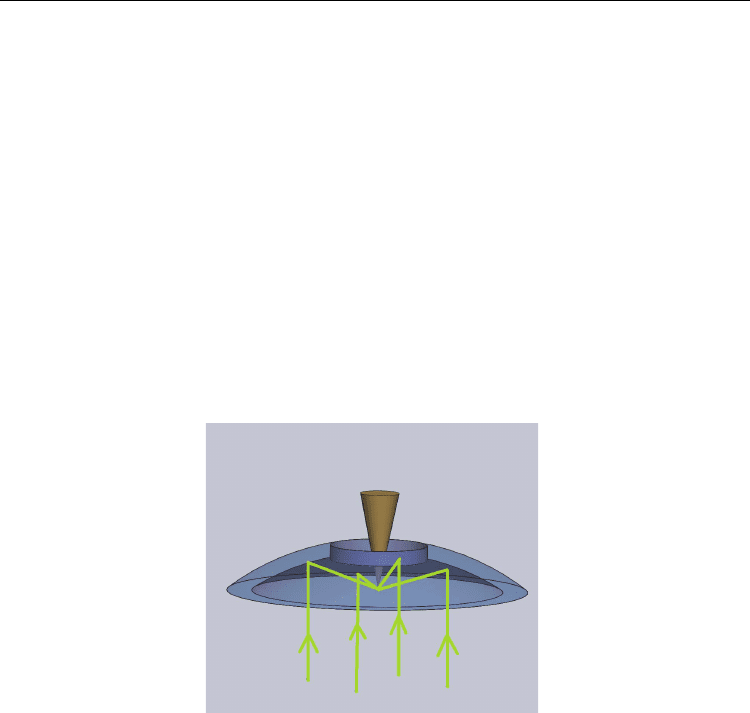
Of late years, an illumination/collection configuration with a parabolic mirror (PM) has
been introduced into the reflection-mode TERS system (Steidtner & Pettinger, 2007; Sackrow
et al., 2008). This novel solution is considerable and promising in the research and industrial
field of TERS.
The reflective surface of PM is shaped to an axial symmetric paraboloid. According to the
geometric properties of the parabolic surface and the reflection law, the incident beam
which is parallel to the axis of the PM is reflected by the reflector and converged to the focus
of the parabolic surface. Instead of an objective lens, the PM converges the parallel incident
light at the tip apex, and the enhanced Raman signal is collected with the same PM (Fig. 6).
Fig. 6. Schematic diagrams of tip-enhanced Raman spectroscopy based on a parabolic
mirror.
PM based reflection-mode TERS system has the following advantages:
a. In the PM based configuration, the focusing of the incident light is realized by
reflection, instead of refraction in other objective lens based configurations. Because
focusing with refection fundamentally avoid the chromatic aberration, regardless of the
wavelength the incident parallel beam is focused at the fixed point. This facilitates the
PM base TERS system, which can optionally employ different wavelength laser as
excitation light (D. Zhang et al., 2009).
b. The N.A. of the PM used in this configuration can be up to approximately 1. With the
high N.A. parabolic mirror, the incident light can be tightly focused at the tip apex to
enhance the near-field Raman scattering. Still, the collection of the signal is also
effective with the high N.A. parabolic mirror.
c. Unlike the side-collection one, the PM based configuration efficiently collects the signal
from the whole 3-D space around the detected position.

Detection of Carbon Nanotubes Using Tip-Enhanced Raman Spectroscopy
223
d. The PM based TERS system works in reflection-mode, and neither the incident light nor
the enhanced signal needs to transmit through the specimen. Therefore, it is capable of
detecting any specimen regardless of the transparency or opaque.
It is also noticed that the optical system is cylindrically symmetric about the optical axis as
well as the tip axis, like in the transmission-mode TERS. In order to generate a stronger
longitudinal field at the focal region to excite the enhancement, a radially polarized donut-
shaped incident beam should be utilized. Besides the more effective tip-enhancement result
from the stronger longitudinal field, the far-field background noise is reduced
simultaneously due to the smaller focal region.
But there are still several difficulties concerning the PM based TERS system. Firstly, this
configuration requires the parabolic mirror with a higher precision surface shape. The PM
which critically determines the illumination and collection efficiency is one of the most
crucial components of the optics. In addition, the amount of far-field noise is related to the
size of the focus, which depends on the shape of the reflector. Secondly, it is difficult to
precisely align and couple the optical circuit. So it needs high skill and patience to adjust
carefully.
2.3.6 Substrates
The TERS system rarely requires for the special preparation of the specimen or the specific
experimental environment (air, liquid or vacuum). But it must be considered to reduce the
far-field background noise and improve SNR. Yet, the highly dispersed thin film of
specimen tends to demonstrate better TERS detection result. The choice of substrates on
which the specimens dispersed is fairly tolerated.
Generally, the glass, mica, silicon or other commonly-used flat materials can all be utilized
as the substrates in the TERS system based on AFM or SFM. In the STM based TERS system,
single crystal metal or a metal coated surface is used. Numerous studies show that the
material and microstructures of the substrate significantly affect the excitation of LSPs in the
tip-specimen-substrate system. Considering that, only depending on the enhancement of the
tip apex is hard to achieve the single molecule detection sensitivity and nano-meter spatial
resolution, it would be ideal to further increase the enhancement factors and improving the
confinement by appropriately bringing in the suitable substrate with nanometer structures.
In AFM or SFM based TERS system, using a SERS substrate can further enhance the Raman
signal and quench the fluorescence. This technique is known as the SERS-TERS mode
(Hayazawa et al., 2001). This kind of substrates can be prepared by depositing randomly
distributed gold or silver nano-particles on the original substrate. As for STM based TERS
system, the atomic-level smooth single-crystal gold surface is commonly used as the substrate.
Under this composition namely gap-mode (Ren et al., 2005), an electromagnetic field
enhancement can be greatly excited at the gap between the tip and the specimen.
Additionally, the smooth gold substrate eliminates the SERS enhancement induced with
local surface fluctuations and provides an access to better understanding of the mechanism
of the tip-enhancement effect.
2.4 Evaluation method of performances of TERS systems
Generally, there are 3 indicators used to evaluate the performance of a TERS system,
including contrast, enhancement factor (EF), and the lateral resolution of the Raman
mapping.

Electronic Properties of Carbon Nanotubes
224
Contrast is defined as the ratio of near field tip-enhanced Raman intensity to the far-field
Raman signal intensity, and is given by Eq. (1) (Schmid et al., 2007; Tarun et al., 2009):
=1
total far
near total
far far far
II
II
C
III
(1)
in which, the
near
I indicates the intensity of the near-field Raman signal from the region just
below the tip apex,
f
ar
I denotes the far-field Raman signal intensity as the tip is withdrawn,
and
total
I
is the TERS experiment detected Raman intensity, which is the mixture of the
near-field and far-field Raman signal intensity. The contrast can be regarded as the SNR of
the TERS detection. It reflects the excitation/collection efficiency and the detection ability of
the system.
In certain studies, the ability of the tip induced Raman signal amplification tends to be more
concerned, and it is known as the enhancement factor. Taking into account of the difference
between the sizes of the regions that give rise to the near-field and far-field Raman signal,
the enhancement factor can be expressed as (Schmid et al., 2007):
2
2
f
ocus focus focus focus focus
tip tip tip tip tip
VAhdh
EF contrast contrast contrast
VAhdh
(2)
where
ti
p
V
,
ti
p
A
,
ti
p
h
,
ti
p
d
and
f
ocus
V
,
f
ocus
A
,
f
ocus
h
,
f
ocus
d
represents the near-field on the tip
apex and far-field illuminated at the focus sample volume, the cross-sectional area of the
illumination, radius and penetration depth of the illumination respectively. These
parameters mentioned above are difficult to be accurately measured in experiment and are
estimated based on the experimental conditions generally.
EF can be regarded as the normalized contrast according to the near-field/far-field signal
excitation regions. It is more suitable for comparing with the electromagnetic simulation to
analytically investigate the performance of the tip and the enhanced mechanisms.
Since only the Raman signal from the region just below the tip apex can be enhanced, the
effect in the near-field region is estimated in accord with the size of the tip apex whose
diameter is only tens of nanometers generally. But the diameter of the laser focusing spot
is usually in submicron region. As a result of the great difference between the size of the
near-field and the far field illumination, the experimentally obtained EF is usually about
10
3
~10
6
. There are still some gaps in the comparison of the electromagnetic simulation
expected and experiments.
Presently, the reported EF obtained in experiment can be as high as 10
9
, and some research
has achieved the single-molecule lever detection (Hayazawaet al., 2006; W. H. Zhang et al.,
2007; Steidtner & Pettinger, 2008). Different forms of the formula should be applied to
calculate the EF of samples with different sizes and transparency. The schematic of samples
with different thickness and the corresponding EF estimation formula is shown in Fig.7. For
thin samples (Fig. 7(a)), since the penetration depth of the near-field and the far-field
illumination are the same, the excitation region is determined just by the far-field focal spot
radius or the tip radius respectively. For thicker Raman active material (Fig. 7 (b)), the
impact of the different penetration depth has to be taken into consideration. Due to the far-
field illuminated sample volume is much larger than the tip excitation region, when the EF