Lowenthal G., Airey P. Practical Applications of Radioactivity and Nuclear Radiations
Подождите немного. Документ загружается.

Chapter 7
Industrial applications of radioisotopes and
radiation
7.1 Introduction
7.1.1 A change of emphasis
Beginning with this chapter, the emphasis of this book will shift from
discussing the science and technology of radioactivity and ionising radiations
to considering how they are employed to advance scienti®c, technological and
social objectives. The present chapter will concentrate on industrial applica-
tions of X and g rays, charged particles and neutrons, and also on the
applications of high-intensity radiations for chemical processing. Chapter 8
will discuss industrial radiotracing and Chapter 9 the contribution of nuclear
techniques to understanding and protecting the environment.
7.1.2 An overview of industrial applications
Summary
The goal of modern manufacturing is to produce quality products as
economically as possible using processes designed to minimise adverse
impacts on the environment. The processes should result in the maximum
ef®ciency in the use of energy and materials and the minimum generation of
waste products.
Nuclear techniques contribute to this goal when applied to:
. optimising the ef®ciency of industrial processes;
. diagnosing problems in plant operations;
. examining industrial components using non-destructive methods;
. analysing the composition and structure of materials;
181
. treating materials with high-energy radiation for the purposes of sterilisation or
modi®cation of their propert ies;
. assessing the impact of industrial and urban development on the environment and
designing remedial action.
The scope of these applications is outlined below.
Optimisation and control of processes in industrial plant
Optimisation and control of industrial processes depend ®rst and foremost
on the measurement of key parameters. In modern industrial plant, these
data are often interpreted with the aid of sophisticated mathematical models
designed to monitor the processes and to diagnose operational problems.
A wide range of nucleonic gauges has been developed for the acquisition of
data on industrial plant. Examples include measurements of
. the levels and densities of materials in vessels and pipelines
. the thicknesses of sheets and coatings
. the amounts and properties of materials on conveyor belts.
All gauges comprise one or more radiation sources and a detector system
optimised for the measurement of interest. In most cases the output is
obtained in real time and can therefore be used not only for monitoring, but
also for process control and optimisation. The gauges are typically mounted
external to the plant and do not interfere with the process either during
installation or operation.
Plant diagnostics
A range of radioactive tracer techniques has been designed to investigate
reasons for any reduced ef®ciency in plant operation. For instance, tracers
are routinely used to measure ¯ow rates, study mixing processes and locate
leaks in pipework and heat exchangers.
However, the role of radiotracers in plant diagnostics is fundamentally
changing. The increasing use of mathematical models is reducing the need for
tracers in many routine applications. On the other hand, radiotracers are
being increasingly used for model validation and for the monitoring of
processes which are so complex that detailed mathematical descriptions are
inadequate.
Testing and inspection of materials
Long established industrial radiography is routinely used in studying the
integrity of structural materials, especially the testing of welds. Recent
advances in data processing have enabled the two or three dimensional
Industrial applications of radioisotopes and radiation182
visualisation of the internal structure of materials and components using a
technique known as computerised tomography. Both radiography and
tomography were ®rst used in medicine but are now ®rmly established in
industry.
Composition and structure of materials
Knowledge of the composition, structure and compatibility of materials is
frequently required in the investigation phase of an industrial project.
Neutron activation and X ray ¯uorescence techniques are widely used for
elemental analyses, and a range of X ray, electron and neutron based
methods have been developed for structure and compatibility studies.
Modi®cation and syntheses of materials
The passage of suf®ciently intense ionising radiation through matter leads to
chemical and physical changes, many of which are important industrially. In
this chapter reference will be made to the chemical synthesis of a range of
polymeric materials by radiation induced reactions and to the widespread use
of radiation for the sterilisation of medical products.
Environmental applications
Despite modern policies encouraging waste minimisation, it is inevitable that
some unwanted by-products of development will be released to the environ-
ment. Applications of radioisotopes to the study of the transport of con-
taminants through terrestrial and marine ecosystems will be outlined in
Chapter 9.
Broadly speaking, the topics are classi®ed according to the radiation
source. Emphasis is placed on the applications of gamma rays (Table 7.1) and
beta and neutron radiation (see later ± Tables 7.5 and 7.6 respectively). By
organising the material in this way, reference can easily be made to the
underlying scienti®c principles. Readers are referred to publications con-
taining detailed information, for example the works of Charlton (1986),
IAEA (1990a) and Hills (1999). As an indication of the relative importance of
different applications, the distribution of commercial projects undertaken by
a major service provider in Australia over the period 1989 to 1999 is listed in
Table 7.2.
7.1 Industrial applications of ionising radiations 183

Industrial applications of radioisotopes and radiation184
Table 7.1. Industrial applications of gamma rays.
Property of
the Radiation
Application Example Reference
Attenuation
Back-scatter
Fluorescence
(X ray)
Absorption
Ionisation
(g, X rays)
Level gauges
Column scanning
Density gauges
Industrial
tomography
Dual isotope
Level gauges
g-g lagging of
boreholes
On-line thickness
monitoring
X ray Fluorescence
(XRF)
Ionisation
chambers
Gas proportional
counters
Geiger±Mu
È
ller
counters
To monitor and control
the levels of liquids and
solids in chemical
reactors, tanks and
hoppers
Diagnosis of malfunction
of ind ustrial columns
during plant operation
Density of materials in
industrial and mineral
processing streams
Visualisation of the
internal structure of
components and
materials in 2 or 3
dimensions
Ash in coal on conveyor
belts
Levels of liquids in tanks
(a) Bulk density of strata
(b) Monitoring of the
water table
(c) Monitoring of oil/
water interface
Monitor and control of
surface coating thickness
e.g. tin plate
Multi element assay
Secondary standard
instruments for
radioactivity
measurements
Radiation detection and
monitoring
Section 7.2.1
Section 7.2.2
Section 7.2.3
Sections 5.2, 6.3,
2.3
Section 5.3

7.1 Industrial applications of ionising radiations 185
Table 7.1. (cont.)
Property of
the Radiation
Application Example Reference
Chemical
effects of high
energy
radiation
Chemical
dosimetry;
Radiation
polymerisation;
Radiation
pasteurisation and
sterilisation;
Food irradiation
Industrial dosimetry;
Good radiation practice;
Radiation cross-linking ±
heat shrink plastics
Sterilisation of medical
products;
Waste water treatment;
Extend the post harvest
life of certain foodstuffs.
Section 7.6.2
Section 7.6.3
Section 7.6.4
Section 7.6.5
Table 7.2. Industrial applications of radioisotopes and their distribution in
Australia, 1989±1999.
a
Category Application Per cent
Measurement of density pro®les of distillation columns 19.3
Detection of deposition and blockages in pipelines 9.6
Measurement of levels and interfaces in process vessels 23.5
Sealed Tomographic scans for density distribution measurement 1.8
source Flooded member detection (identi®cation of water ingress 5.8
applications into sub-sea structures)
Measurement of corrosion/erosion in pipelines 1.7
Neutron scans for detection of water under thermal 1.5
insulation (corrosion pre-cursor)
Measurement of residence time distributions in process 11.7
vessels
Flowrate measurements in liquids, gases, solids 7.4
Fluid dynamics and mass transfer properties of fluidised 5.2
catalytic crackers (FCCs)
Radioactive Internal leakage detection in process vessels 4.4
tracer Detection of underground leaks 1.7
applications Liquid/gas distribut ion studies in chemical reactors and 2.2
distillation towers
Tracing ¯ow patterns in oil/gas reservoirs 1.7
Down-hole oil well studies, includi ng corrosion inhibitor 2.5
tracing, perforation marking, sand-fracture tracing
a
Information provided by Dr J.S. Charlton (1999).
7.2 Scienti®c and industrial applications of gamma rays
7.2.1 Applications employing gamma ray attenuation
Nucleonic gauges
Instruments used for the detection and measurement of nuclear radiation are
often known as gauges and their use is referred to as gauging. A simple gauge
comprises a radioactive source and a detector, e.g. a NaI(Tl) crystal with its
signal processing equipment (Figure 4.2). An example is the level gauge
shown in Figure 7.1.
A wide range of industrial applications of nuclear radiations is based on
selected characteristics of g rays. Several of these applications are summarised
in Table 7.1 and include nucleonic level and density gauging, radiography,
tomography and diagnostic column scanning. Relevant properties of g
radiations were discussed in Section 3.4.1.
Industrial applications of radioisotopes and radiation186
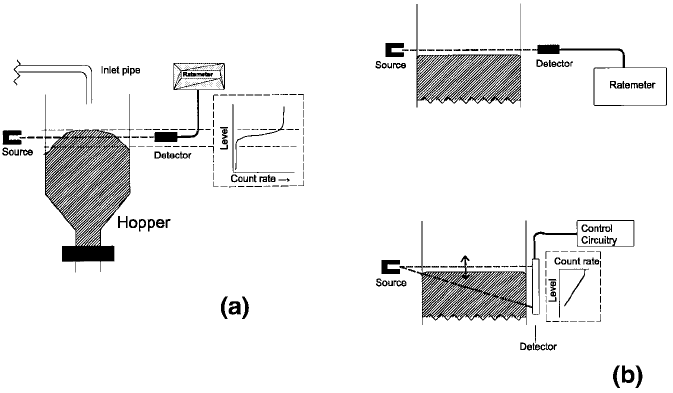
Figure 7.1. Nucleonic level gauge comprising a collimated radioactive source, a
detector and a control system. (a) Monitoring the level of material in a hopper. The
response of a ®xed detector to the raising and lowering of the surface of the material
is shown. (b) Monitoring the level of liquid in a tank. The gamma ray beam in the
lower ®gure has an angle of about 208 and a linear detector is used (after Charlton,
1986, Ch. 13). The response of the detector to changes in the liquid level is shown.
Level gauges
Level gauges employ gamma ray attenuation in a particularly simple way and
on a very large scale. They are widely used for monitoring or controlling the
level of material in tanks or hoppers in the re®ning and chemical processing
industries with many thousands installed around the world. Large plants
employ numbers of gauges with information fed on-line to central operation
rooms.
In its simplest form the gauge comprises a source of radiation in a specially
constructed shielded housing and a detector. As shown in Figure 7.1(a), the
response of the detector falls rapidly as soon as the surface level of a material
in the hopper rises to intersect the beam. Factors affecting the choice of the
radioactive source are discussed below.
In industry, there is often a need to record the position of the surface of a
liquid in a tank over an extended range. To effect this, a more sophisticated
version of the level gauge has been developed (Figure 7.1(b)) in which the
radiation beam is collimated in the vertical plane with a dispersion angle of
about 208. A linear ionisation detector is used, the output of which is a
measure of its length exposed to the radiations and therefore of the height of
the liquid. To extend the height interval that can be monitored, multiple
sources may be installed.
By feeding the detector output into circuitry connected to pumping and
valving systems, the liquid levels may be automatically controlled within a
pre-set range. This is the ®rst of many examples of nucleonic control systems
which are widely used in the control and optimisation of industrial
processes.
Optimum choice of the radioactive source
The correct selection of the radioactive source involves matching the proper-
ties of available radionuclides to the speci®c application. For level gauges, the
relevant properties are the energy of the emitted g rays, the half life and the
activity of the source.
(1) The energy of the emitted g rays: The energy is chosen to ensure that the g rays
will readily penetrate the walls of the vessel, but that the beam intensity will be
suf®ciently attenuated by the material contained therein to permit accurate
monitoring of the level.
More exacting criteria govern the choice of sources for density gauges, g
radiography and tomography as these applications usually depend on mon-
itoring small differences in the density of material with maximum precision. It
can be shown that the maximum sensitivity is obtained when the product of the
7.2 Applications of gamma rays 187
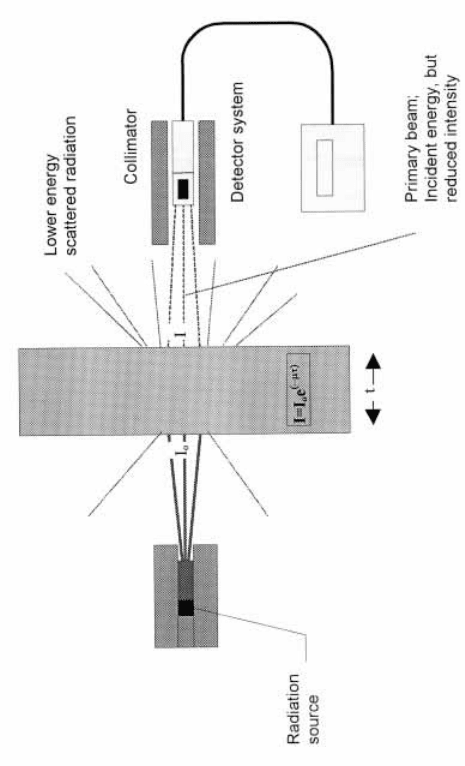
Figure 7.2. The attenuation of a collimated gamma ray beam.

linear attenuation coef®cient m
t
(cm
71
) and the thickness t (cm) of the sample
along the beam path is unity, i.e. m
t
6t = 1 (Figure 7.2). In the Compton range,
the linear attenuation coef®ci ent decreases with increa sing g ray energy. Hence,
the larger the sample, or the higher the density, the higher the gamma energy
that is required for maximum sensitivity. In practice, for a uniform material, the
energy of the gamma ray is chosen so that the path length of the collimated
beam is close to the half thickness (or half value layer) (Table 7.3).
(2) The activity of the source: The source strength should not be greater than
necessary so that the shielding requirements can be kept to a minimum. On the
other hand, the activity of the source cannot be too weak. Otherwise the signal
could be too low for a suf®ciently rapid detector response. A correct choice for a
level gauge is particularly important if the material being monitored can rise or
fall quickly. Most practical applications can be designed with relatively weak
and carefully shielded sources, so minimising radiation exposure.
(3) The half life: For installed nucleonic gauges the half life of a radionuclide used
for an installation should be a year or preferably longer, since the longer the
half life, the less frequently the source will need to be replaced.
60
Co,
137
Cs and
241
Am sources which are commonly used in level and density gauges have long
half lives and well de®ned g ray energies which together cover a wide range (see
Table 8.1).
Density gauges
These gauges are used to measure the density of material between the source
and the detector from measurements of the attenuation of a collimated g ray
beam (Figure 3.7(a)). The basic relationship between the measured g ray
intensity after passing the sample I
t
, the initial intensity I
0
for a thickness t
(cm) of the material of interest is given by
I
t
= I
o
exp (7m
m
6r6t), (7.1)
Table 7.3. Half thicknesses of aluminium, iron and lead at selected g ray
energies.
E
g
(keV) Al
a
Fe
a
Pb
a
60 9 0.7 ±
100 15 2.4 ±
300 26 8.1 1.5
600 33 12 5
1200 47 16 10
a
The densities of aluminium, iron and lead are 2.70, 7.87 and 11.35 g/cm
3
respectively. The m
m
values used to calculate these results were derived from Hubbell
(1982). The t
50%
results are uncertain by between +5% and +10%.
1897.2 Applications of gamma rays
where the mass attenuation coef®cient m
m
(cm
2
/g) is related to the linear
coef®cient m
t
(cm
71
) and the density r (g/cm
3
) of the material by m
m
= m
t
/ r
(Section 3.4.4).
Density gauges differ from level gauges, which, in their simplest mode of
operation, are just `on/off' devices. Density gauges can detect differences in
the density of materials as low as 0.1%. To achieve this level of precision it is
necessary to employ a carefully shielded and collimated g ray beam, and to
optimise the selection of the source and, in particular, the energy and intensity
of the emitted g rays.
As indicated above, the g ray energy of the source should be chosen to
ensure that the beam is attenuated in the sample by approximately 50%.
Under these conditions, small changes in density are measured with the
greatest sensitivity, other factors such as counting time being equal.
To predict the thickness leading to a 50% reduction in the intensity of the
beam, Eq. (3.8) (or Eq. (7.1)) is written I
t
= 0.5 I
0
and, on solving the
equation, m
t
6t
50%
& 0.693,
t
50%
& 0.693 / m
t
& 0.693/(m
m
6r
av
), (7.2)
where t
50%
is the range of the g rays in the sample leading to a 50%
attenuation of their intensity.
Approximate values of m
t
and m
m
(in cm
71
and cm
2
/g respectively) for the
energies and materials of interest could be read from the graphs in Figure 3.7.
Also, Table 7.3 lists t
50%
for selected values of E
g
and a range of densities
from that of aluminium to that of lead. When other values are required they
can often be approximated by interpolation to suf®cient accuracy. Alterna-
tively, reference may be made to extensive tables and graphs of attenuation
coef®cients that have been posted on the Internet by the US National
Institute for Science and Technology (NIST). Internet sources of nuclear data
are discussed in Appendix 3.
An application of density gauges is to the monitoring of slurry densities in
pipelines, shown schematically in Figure 7.3(a). Transmission gauges have
also been used to monitor the deposition of scale on the walls of pipes (Figure
7.3(b)), since extensive scaling can signi®cantly limit the capacity of the
pipeline to transport material.
One of the major strengths of nucleonic gauges is that they may be used
remotely and in hostile environments. Reference will be made to two devices
developed by the commercial company ICI Synetix Tracerco for applications
on offshore oil and gas platforms. Both are gamma transmission gauges
which may be mounted by remotely operated vehicles (ROVs). The ®rst,
known as the Gammagrout
TN
, system is designed to provide assurance that
Industrial applications of radioisotopes and radiation190